

Abstract
Research efforts related to landfalling tropical cyclones (TCs) and their hydrological impacts have focused mostly on the continental or regional scales, whereas many coastal management and infrastructure decisions are made at much finer spatial scales. In this context, this study aims to provide local-scale understandings of the climatological characteristics and hydrological impacts of TCs (from 1950 to 2019) over the Mid-Atlantic region defined as the Delaware River Basin (DRB) and Susquehanna River Basin (SRB). The climatological analysis is based on analyzing long-term, spatially distributed observational datasets of hurricane tracks, precipitation, and streamflows. Results suggest that, despite limited contribution of TCs to regional precipitation (<9%), TC is the dominant driver for extreme floods in the southern part of DRB (e.g. tributaries of the Christina River and lower Schuylkill River) and the southwestern portions of SRB (e.g. tributaries of the Lower Susquehanna and Junita River), where TC's effect on drought alleviation is also comparatively higher. At the basin level, SRB is more susceptible to flooding associated with TCs and prone to drought relative to DRB; however, strong spatial variability of TC's impact on hydrological extremes is observed within and across the basins. While the TC effect on flood/drought is negligible for the high-elevation, northern part of the region, TC increases the magnitude of the 100 year flood by up to 19.6% in DRB and 53.0% in SRB; the duration of short-term extreme hydrological drought is reduced by TC by up to 25.0% in SRB and 24.7% in DRB, respectively.
Export citation and abstract BibTeX RIS
1. Introduction
Coastal regions such as the Mid-Atlantic region are exposed to tropical cyclones (TCs) that bring high wind and heavy precipitation along the storm track over a short duration, leading to flood hazards in both natural and built environments (Rappaport 2000, Konrad 2001, Villarini and Smith 2010, Barlow 2011, Villarini et al 2011). Compound influences from natural and human systems such as sea level rise, population growth, and aging infrastructure, have further increased exposure to compound flooding in the coastal regions and cities (Pielke 2009, Smith and Katz 2013, Li et al 2020, 2021, Xiao et al 2021). Beyond flood hazards, TCs could provide drought amelioration depending on TC trajectory landfall timing (Lam et al 2012, Maxwell et al 2012, Kam et al 2013, Lowman and Barros 2016), which can have important implications for the Mid-Atlantic region that is historically susceptible to drought (Giuliani et al 2014).
Prior research efforts related to the TC effect on hydrological extremes (e.g. flood and drought) have been conducted mostly on the regional scale. For instance, Maxwell et al (2012) estimated that at least 20% of regional meteorological droughts in most climate divisions of the southeast US were terminated by TC events between 1950 and 2008. Brun and Barros (2014) examined the hydrological impacts of TCs at the watershed scale for the southeast US over 2002–2011, and found that TC was a key mechanism of mitigating regional meteorological droughts but peak floods resulting from TCs did not exceed the two year flood event at much of the southeast US. For the eastern US, Villarini and Smith (2010) found that TC was a major contributor to flood peak distributions. Kam et al (2013) assessed the effect of TCs on soil moisture droughts over the eastern US from 1980 to 2007, which suggested that TCs decreased the duration and spatial extent of droughts for all eastern regions, although the impact can vary considerably in space and time. Despite the insights gained from the above regional research, there is a lack of knowledge of how the climatological effects of TCs vary at local scales on hydrological extremes. This is a critical knowledge gap to address, given that many coastal management and infrastructure decisions are made at scales finer than regional or watershed scales used in existing research.
In this context, this study focused on the Mid-Atlantic region, which we defined as the Delaware River Basin (DRB) and Susquehanna River Basin (SRB) (figure 1). This region provides a natural laboratory for examining TCs and related hazards but has received less research attentions compared to the eastern and southeast US By analyzing spatially and temporally extensive observational records (1950–2019) over the Mid-Atlantic region, the objective of this study is to provide the historical climatological perspective of the TC impact on the severity and spatial variability of floods and droughts.
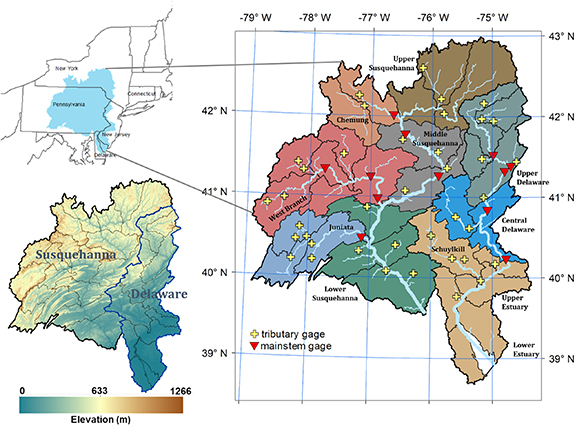
Figure 1. The map showing the Mid-Atlantic region comprised of 32 HUC8 subbasins, and 50 USGS streamflow gages used for this analysis. Tributary gages refer to the gages located within a single HUC8 subbasin, and mainstem gages are located at the confluence of at least two HUC8 subbasins.
Download figure:
Standard image High-resolution image2. The Mid-Atlantic study region
The Mid-Atlantic region varies considerably in its climate, soil, land cover, and topography. Regional topography varies from low-relief coastal plain in the southeast to Ridge-and-Valley Appalachian Mountains system. The general climate is humid continental with abundant precipitation throughout the year and seasonal snowfall in northern areas. The Delaware River drains 35 065 km2 and serves as the major source of freshwater for about 5% of the US population. The Susquehanna River drains 71 224 km2 and contributes about 50% of freshwater to the Chesapeake Bay, making its hydroclimatic condition critical for the ecological health and productivity of the nation's largest estuarine environments (Leathers et al 2008).
3. Data and method
Observational datasets used in this analysis are summarized in table 1. The TCP analysis used the Atlantic Hurricane Database (HURDAT2) (Jarvinen et al 1984, Neumann et al 1993, MacAdie et al 2009) that includes six-hourly TC track information, and the gridded, daily precipitation data at a 1/16 degree (∼6 km) spatial resolution (Livneh et al 2013). The precipitation dataset is one of the few gauge-based gridded datasets with long-term records for constructing climatology of TCP. For TC-related flood and drought analysis, HURDAT2 and daily flow measurements from United States Geological Survey (USGS) gages were used. Among 115 USGS gages across the Mid-Atlantic region, we selected 50 gages (33 gages in SRB and 17 gages in DRB) with continuous records from 1950 to 2019 and are largely unaffected by water management (i.e. >10 km downstream from major reservoirs with a maximum storage capacity >0.1 km3) (figure 1). The gages range from 3 to 371 m in elevation, and 531–25 796 km2 in drainage area. Note that many gages in the Delaware Estuary was excluded due to the lack of flow records after year 2004.
Table 1. Observational datasets used for this analysis.
| Dataset | Period of availability | Spatial/temporal resolution | Description |
|---|---|---|---|
| HURDAT2 | 1851–2019 | Event-based 6-hourly | Atlantic Hurricane Database including six-hourly information on the storm location and classifications of tropical cyclones and subtropical cyclones |
| Gridded Precipitation | 1950–2013 | Gridded 1/16° Daily | Gridded precipitation developed based on daily observations from approximately 20 000 NCDC COOP stations across the United States and bias corrected to match the long-term mean of the Parameter-Elevation Regressions on Independent Slopes Model (PRISM; Daly et al 1994) |
| USGS Streamflow | 1950–2019 | Point locations Daily | Daily streamflow measurements obtained from 50 USGS gages |
3.1. TC-related precipitation (TCP)
The TCP analysis was performed at the HUC8 subbasin level from 1950 to 2013, when both HURDAT2 and gridded precipitation records are available. A TC event is considered related to the co-occurring precipitation in a HUC8 subbasin if the basin is within the 500 km radius from the center of the TC track. The use of 500 km radius is based on recommendations from a large number of existing literature (Englehart and Douglas 2001, Barlow 2011, Nogueira and Keim 2011, Kam et al 2013, Prat and Nelson 2013, Brun and Barros 2014). For each documented TC event, the HUC8-level TCP was calculated as the total precipitation over the storm duration averaged over all (1/16th degree) precipitation grids within a HUC8 subbasin. Several metrics were computed to describe the characteristics of TCP including the TCP contribution to annual precipitation, TC frequency and duration.
3.2. TC-related flows (TCF)
If a TC event produces precipitation in a HUC8 subbasin (based on the above TCP analyses) that contributes flow to a gage location, streamflows from this gage over the event duration plus a lag time of 3 d is considered as TC related flows (TCFs). The choice of 3 d is based on gage observations showing peak discharge generally lagging peak precipitation by approximately 1–3 d. Note that a flow gage can be related to one or more HUC8 subbasins depending on the hierarchical river networks. For example, a mainstem gage is related to all upstream HUC8 subbasins that contribute flows to the gage location.
3.3. Flood frequency and associated design risk analysis
We constructed for each flow gage two sets of annual maximum daily flow (AMF) series based on: (a) daily flow records including TCF (denoted by AMF_TC) and (b) daily flows excluding TCF (denoted by AMF_NOTC). The AMF series were developed for the water years 1951–2019, when gage flows and HURDAT2 records are available. Water year was used to better capture cyclical patterns of streamflows. We quantified the impact of TC on what we define as large and extreme AMF events. Here large (or extreme) AMFs are defined as the top 10% (or 5%) of AMF events, i.e. top 7 (or 3) AMF events, ranked by the magnitude of flows.
Flood frequency analysis was conducted at each gage based on AMF_TC and AMF_NOTC, respectively; the difference in the magnitude of a design flood was compared to quantify the TC impacts. We first examined the trend in the AMF series using the nonparametric Mann–Kendall test (Kendall 1975; Mann 1945). Where trends exist at the 5% significance level, Sen's slope (Sen 1968) was used to detrend the AMF series before fitting the generalized extreme value (GEV) distribution (Perica et al 2013, Yan et al 2018). The Mann–Kendall test for monotonic analysis of trend combined with the Sen's slope is a widely applied trend analysis approach in hydrologic research (Collaud Coen et al 2020). The GEV distribution combines the Gumbel, Frechet, and Weibull distributions, and uses three parameters (location, scale and shape parameters) for distribution fittings based on L-moments statistics (Hosking and Wallis 1997). The trend analysis performed here used the 'trend' package in R and the L-moments analysis used the 'lmom' package in R. Given the daily resolution of streamflow measurements, we constructed flood frequency curves for the 24 h duration and assessed associated infrastructure design risk given by equation (1) (Chow et al 1988):

where  is the risk hazard associated with the likelihood of exceeding at least one design event over the infrastructure design life, which is defined by the event return period
  ,
,  is the annual exceedance probability of a design event. A risk value closer to 0 indicates lower risk of failure. We compared
  with and without including TCF for
  = 100 year. The difference in
  results from the difference in the flood frequency curve with and without including TCF.
3.4. Definition of hydrological drought
Common drought indices such as Palmer Drought Severity Index (PDSI; Palmer 1965) focus on droughts at the monthly or weekly timescales, which are not appropriate for capturing the event-scale TC effect on droughts. Similar to Kam et al (2013), here we classified droughts into six categories D1–D6 based on their duration and severity defined by streamflow conditions (table 2). Specifically, a drought is defined when streamflows are continuously below the low flow thresholds, i.e. extreme droughts if <10th percentile flow, severe droughts if <15th percentile flow, and moderate droughts if <20th percentile flow based on daily flow records over 69 water years. A long-term drought is defined if it lasts for over 90 continuous days, and a drought lasting for 30–90 continuous days is defined as a short-term drought. To characterize the impact of TCs on drought, we compared the differences of drought frequency and duration for each drought class based on (a) daily flow records including TCFs, and (b) daily flow records where TCFs were replaced by the average streamflow over the week prior to each TC event.
Table 2. Occurrences of hydrological drought events defined by six categories over 1950–2019.
| Delaware | Susquehanna | |||||||
|---|---|---|---|---|---|---|---|---|
| Drought category | min | mean | max | min | mean | max | ||
| Short 30–90 d | Moderate | D1 | 8 | 15 | 23 | 8 | 16 | 26 |
| Severe | D2 | 12 | 24 | 33 | 15 | 28 | 37 | |
| Extreme | D3 | 18 | 33 | 43 | 23 | 40 | 52 | |
| Long >90 d | Moderate | D4 | 0 | 1 | 3 | 0 | 1 | 4 |
| Severe | D5 | 0 | 2 | 4 | 0 | 3 | 8 | |
| Extreme | D6 | 0 | 3 | 7 | 1 | 5 | 12 | |
Note: moderate, severe, and extreme drought is defined by flows lower than the 20th, 15th, and 10th percentile flow, respectively.
4. Results
4.1. Summary of TCP
A total of 211 landfalling TC events occurred within the Mid-Atlantic region over 1950–2013. About 62% of these events lasted for up to 7 d, and about 30% lasted between 7 and 14 d. The most active hurricane season occurred in year 2004 with eight TCs (see figures S1–S3 (available online at stacks.iop.org/ERL/16/124009/mmedia)). The average TC contribution to the annual precipitation (i.e. TCP/P) ranged from 4.2% to 8.7% across the HUC8 subbasins (figure 2). However, there is a remarkable inter-annual variability. For example, the maximum single-year TCP/P ranged from 36.2% to 57.2%, which occurred in 2004 for the majority of SRB and the upper DRB. At the monthly scale, about 70.7%–84.5% of annual TCP occurred during August and September over the region. The mean monthly TCP/P ranges from 16.2% to 29.4% in August and 18.2%–38.4% in September. Within DRB, the annual TCP was relatively higher in the western portions of the basin (e.g. the East Branch Delaware River, Lackawaxen, Lehigh, and Schuylkill River). Within SRB, the annual TCP was relatively higher in the northern and western parts of the basin such as the West Branch Susquehanna River and Sinnemahoning River.

Figure 2. At the HUC8 level, (a) mean annual TC-related precipitation, or TCP, (b) mean annual TC contribution to precipitation (i.e. TCP/P), and (c) mean monthly TCP/P for September; (d) mean monthly TCP/P averaged for SRB and DRB. The mean values were calculated over 1950–2013.
Download figure:
Standard image High-resolution imageTrend analysis detected a statistically significant increasing trend in the annual precipitation in 15 (out of 32) HUC8 subbasins, and the increasing trend was most significant (>3 mm per year) in the northern areas of DRB and SRB (figure 3). However, no statistically significant trend was detected in the frequency, magnitude, or duration of TCP, or TCP/P.
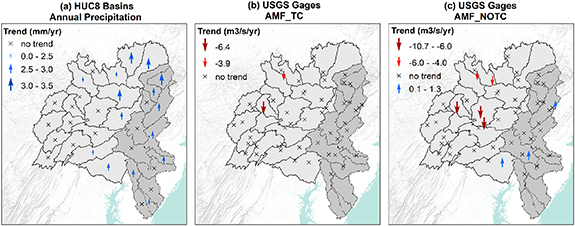
Figure 3. Mann–Kendall trends at the 5% significance level for (a) annual precipitation, (b) annual maximum flows including TC-related flows (AMF_TC), and (c) annual maximum flows excluding TC-related flows (AMF_NOTC). Insignificant trends are indicated by the symbol 'x'.
Download figure:
Standard image High-resolution image4.2. Impacts of TCs on flooding
4.2.1. Annual maximum flows (AMF)
Despite a significant increasing trend in annual precipitation in 15 (out of 32) HUC8 subbasins, the Mann–Kendall test suggested no trend in AMF_TC at most gages but a significant declining trend at two gages in SRB (figure 3(b)), where the Sen's slope was −3.9 m3 s−1 and −6.4 m3 s−1 per year, respectively. For non-TC driven AMF events (i.e. AMF_NOTC), five gages in SRB showed a significant declining trend (figure 3(c)), ranging from −10.7 m3 s−1 to −3.8 m3 s−1 per year, and three gages (one in SRB and two in DRB) showed a significant increasing trend ranging from 0.7 m3 s−1 to 1.3 m3 s−1 per year. Note that non-TC driven AMFs refers to AMF events dominated by physical mechanism not related to TCs, such as snowmelt and soil moisture excess.
Comparisons of flow magnitudes between AMF_TC and AMF_NOTC (figure 4(a)) suggested that TC was the driver of about 1.4%–15.9% of all AMF events over analyzed 69 water years across the region. For gage locations, the total number of TC-driven AMF events generally decreased as gage elevations increased with a Pearson's r of −0.7 (figure 4(b)). Despite limited contribution of TC to regional precipitation, TC was the dominant driver for extreme AMFs (top 3 AMF events) in the southern DRB (i.e. tributaries of the Christina River and Schuylkill River) and the southwestern portions of SRB (i.e. tributaries of the Lower Susquehanna and Junita River). TC also dominated extreme AMFs in the West Branch River that received the highest amount of TCP in SRB (figure 4(c)). Overall, TC caused at least 67% (2 out of 3) of extreme AMFs for over 50% of the SRB gages, and 25% of the DRB gages. In contrast, large AMFs (top 7 AMF events) were dominated more often by non-TC mechanisms than by TCs. No gage in SRB and only two gages in DRB had over 50% of their large AMFs caused by TC.

Figure 4. Over 69 water years, (a) the percent of AMF events driven by TC; (b) the percent of TC-driven AMFs grouped by gage elevations. In DRB, gage elevations are defined as: low = 3–58 m, med = 58–184 m, and high = 184–366 m; in SRB, low = 79–112 m, med = 112–205 m, and high = 205–371 m; (c) the percent of extreme AMFs (i.e. top 3 AMF events) driven by TC; (d) the percent of large AMFs (top 7 AMF events) driven by TC.
Download figure:
Standard image High-resolution image4.2.2. Design floods and associated design risk
The differences between flood frequency curves derived from AMF_TC and AMF_NOTC were used to quantify the impact of TC on design floods with varied returned periods (figure 5). At the basin level, the impact of TCs on extreme floods was higher in SRB relative to DRB based on the basin-wide average of the differences in design flood magnitudes. The basin-average TC-driven change of the 10-, 50- and 100-year flood was 8.4%, 12.4%, 14.3% in DRB, and was 10.1%, 19.1%, 22.8% for SRB, respectively. The impact of TC tends to increase for floods with a longer return period, which is consistent with the previous analysis showing TCs' dominant role in extreme AMFs. Analysis of TC impacts on the design risk suggested that not accounting for TC-driven floods could increase the basin-average 10-, 50- and 100-year design risk by 18.9%, 37.1%, and 48.0% in DRB, and 27.2%, 57.9%, and 57.6% in SRB, respectively.
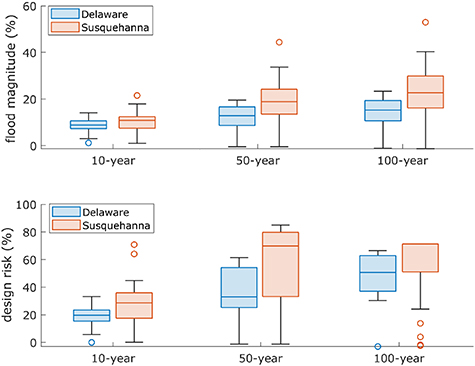
Figure 5. Impact of TC on the magnitude of design floods (upper) and associated design risk (lower). Each box shows 25%–75% quantiles, and the whiskers extend to the most extreme data points not including outliers. The outliers are plotted using the 'o' symbol.
Download figure:
Standard image High-resolution imageStrong spatial variability of TCs' impacts on extreme floods and design risk was observed within both basins. TC changed the magnitude of the 10-, 50- and 100-year flood by 1.2%–14.1%, −0.4%–19.6%, and −1.1%–23.3% across all DRB gage locations, and by 1.0%–21.5%, −0.4%–44.4%, and −1.2%–53.0% across SRB, respectively. Taking the 100-year flood as an example (figure 6(a)), greater TC impacts was found at the tributaries in the southern DRB and the southwestern portions of SRB. For the design risk, TC changed the 10-, 50- and 100-year design risk by 0%–33.2%, −1.2%–61.4%, and −3%–66.5% in DRB, and by 0%–70.9%, −1.2%–85.0%, and −2.4%–71.4% in SRB, respectively. Impacts of TCs on design risk were generally higher towards southern areas of the basin (figure 6(b)).While the TC-driven change in design risk was positively correlated with the change in design flood across all gages (Pearson's correlation coefficient >0.85), their relationship is nonlinear. As a result, for over half of the SRB gages and one DRB gage, TC imposed a higher design risk associated with the 50 year event comparing to the 100-year event.
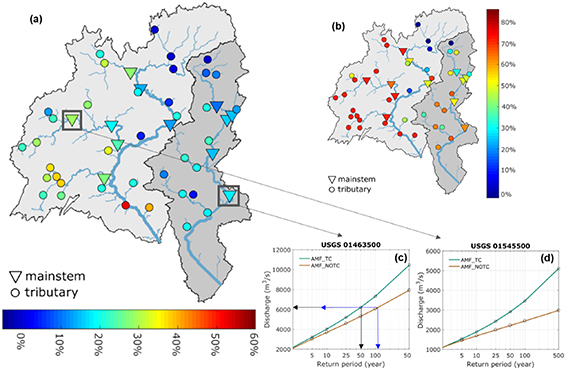
Figure 6. Maps showing the impact of TC on (a) the 100 year flood, (b) the 100 year design risk for the gage locations; (c) flood frequency curve of the most TC-impacted mainstem gage in DRB, USGS 01463500 at Trenton, NJ; the arrows demonstrate that for the same flood discharge, the return period is drastically different as estimated from two flood frequency curves; (d) flood frequency curve of the most TC-impacted mainstem gage in SRB, USGS 01545500 at Renovo, PA.
Download figure:
Standard image High-resolution imageAmong the mainstem gages in DRB, the greatest impact of TC on extreme floods and design risk was found at the most downstream gage (USGS 01463500 at Trenton, NJ), where TC increased 10 year, 50 year and 100 year floods (design risk) by 6.2% (19.6%), 10.4% (50.2%), and 12.2% (62.6%), respectively (figure 6(c)). For the mainstem gages in SRB, TC showed greatest impact on an upstream gage (USGS 01545500 at Renovo, PA), where TC increased 10-, 50- and 100-year floods (design risk) by 10.9% (35.9%), 23.9% (83.3%), and 29.4% (71.4%), respectively (figure 6(d)).
4.3. Impact of TC on hydrological drought
Analysis of drought frequency for each drought classification (table 2) over the analysis period showed that both DRB and SRB were prone to short-term droughts (D1–D3) lasting from 30 to 90 d, relative to long-term droughts with a duration over 90 d (D4–D6). Among all six drought categories, D3 (short-term extreme drought) was the dominant type of hydrological drought in both basins (figure 7). The following analysis focuses on the most frequent D3 and most extreme drought D6.
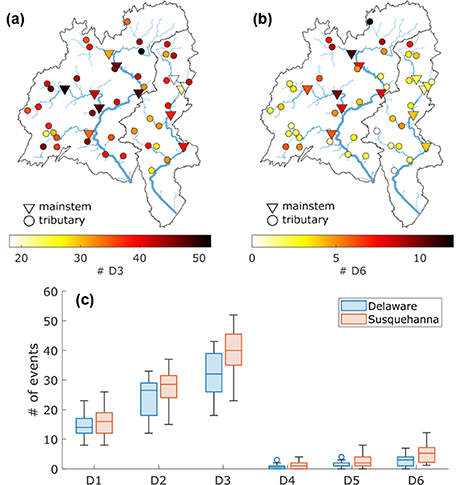
Figure 7. Total occurrences of (a) D3 drought events and (b) D6 drought events over 1950–2019, and (c) boxplot showing the total occurrences of D1–D6 droughts for gages grouped by basin. On each box, the central mark indicates the median. Each box shows 25%–75% quantiles, and the whiskers extend to the most extreme data points not including outliers. The outliers are plotted using the 'o' symbol.
Download figure:
Standard image High-resolution imageAt the basin level, D3 and D6 were more frequent and widespread in SRB compared to DRB. Over the analysis period, there were 18–43 D3 events across all gage locations in DRB and 23–52 D3 events in SRB. D6 occurred 0–7 times in DRB and 1–12 times in SRB. Spatially, the northern and middle SRB were most susceptible to D3, and D6 occurred most often in the northern SRB (figure 7). Evaluated by the spatial extent of drought, the water year 2002 featured the most widespread D3 drought that covered 90% of the gage locations over the Mid-Atlantic region, and the most widespread D6 drought occurred in the water year 1964 covering 74% of the region (see figures S5–S8). Seasonally, 56%–95% of D3 events occurred between June and September, and at least 50% of D6 events occurred during this period. Whereas the peak months of drought coincided with the hurricane season, they often occurred in different years based on historical records.
Comparisons of drought frequency with and without including the TC effect (figure 8) suggested that up to 23% of D3 droughts and up to 100% of D6 droughts were ended by TC over the Mid-Atlantic region. The total duration of D3 and D6 was reduced by TC by up to 25% (or 408 d) and 100% (or 310 d), respectively. TC impacts on drought exhibited marked spatial variability across the region. In general, the TC effect on alleviating D3 droughts was more pronounced in DRB relative to SRB. Specifically, TC reduced the D3 frequency by an average of 12% in DRB, compared to 7% in SRB; TC reduced the D3 duration in DRB by 11%, relative to 9% in SRB. Spatial analysis (figure 9) revealed that the locations showing greater TC impacts on D3 alleviation (e.g. the southern DRB and southwestern SRB) also had higher TC impacts on extreme floods (as shown in figure 6). For much of both basins, TC was able to alleviate or terminate some long-term drought events (D4–D6). For example, TC terminated the D6 drought that occurred in the water year 1964 for 33% of DRB and 13% of SRB locations, respectively. In some part of SRB such as the West Branch River, TC was able to terminate long-term droughts (D4–D6) months earlier, turning them into short-term droughts (D1–D3), as evidenced by the decreased frequency and duration of D4–D6 and slightly increased D1–D3 (figure 8).

Figure 8. Boxplots showing the changes in (upper) D1–D6 drought durations and (lower) D1–D6 drought frequency due to the influence of TCs over 1950–2019 in the Mid-Atlantic region.
Download figure:
Standard image High-resolution image
Figure 9. Changes in the duration of D3 (left) and D6 (right) droughts due to the influence of TCs over 1950–2019 in the Mid-Atlantic region.
Download figure:
Standard image High-resolution image5. Discussion
5.1. Spatially heterogenous and nonlinear hydrological responses to TCs
The Mid-Atlantic region is characterized by very complex topography and heterogenous land covers, which interact with TC storm characteristics (e.g. size, intensity, speed of movement), large-scale and regional climate, and local antecedent soil moisture to modulate local-scale hydrological responses to TCs (Konrad and Perry 2010, Barlow 2011, Sun and Barros 2012, Titley et al 2021). The relative importance of each control factor can be highly variable depending on the characteristics of storms and local conditions. For example, while slow-moving TCs are more likely to generate heavy rainfall than fast-moving TCs (Lai et al 2020), fast-moving TCs can lead to more severe flooding over saturated areas than slow-moving TCs over areas with dry antecedent soil moisture conditions (Titley et al 2021). Similarly, as demonstrated in this analysis, the TC effect on floods is not necessarily greater for locations receiving a higher amount of TCP, as nonlinear processes are integrated and propagated downstream in space and time. In the context of future climates, while existing projections converge on an increase in global average TC intensity, there is much less agreement on the magnitude of increase, which varies with the model resolution and hypotheses (Knutson et al 2010, 2020, Yoshida et al 2017, Zhang et al 2020). Substantial discrepancies also exist among model projection of regional variables such as the structure of SST and vertical shear, which are important for TC genesis and characteristics (Knutson et al 2020). Hence, regional TC projection as well as TCs' hydrologic impacts remain major modeling challenges, due to complex nonlinear process dynamics. In this regard, knowledge of local-scale climatological characteristics and hydrological impacts of TCs derived from observations is essential for evaluating models' ability to simulate realistic spatial patterns of variability across a hierarchy of scales and guiding future model development. For instance, simulations of process-based responses in Earth system models (ESMs) are very uncertain at fine spatial and temporal scales. The climatological analysis of TCs at the local scale can be used for evaluations of subgrid level improvements in ESMs through explicit representation of subgrid interactions and/or new parameterizations.
5.2. Seasonality of flooding
To understand the TC influence on flood generation relative to non-TC mechanisms, flood seasonality was analyzed as a surrogate for distinct flood driving mechanisms, given the seasonality of climate drivers that produce flood-generating precipitation (figure 10). For example, floods occurring between March and April were considered to be driven by snowmelt potentially accompanied by rain associated with extratropical systems, while June–August floods were driven by meso-scale convective systems. Result of flood seasonality (figure 10), as quantified by the circular statistics (described in SI), suggested poor flood seasonality (i.e. considerable inter-annual variability in the timing of flood occurrence) in the southern SRB and over the entire DRB. Strongest flood seasonality was found in the high-elevation northern SRB, where the mean date of floods fell mostly within March that are likely associated with large rain-on-snow events. When considering future flood potentials in the Mid-Atlantic region, flood generation mechanisms may change under changing climate conditions. In projected warmer conditions, floods historically driven by snowmelt or rain-on-snow could shift to rain dominated, implying a changing flood seasonality but not necessarily greater flood potential, as discussed above.

Figure 10. Seasonality index (SI) of AMFs including TC-related streamflows (AMF_TC). Two circular plots demonstrate the gages with strong versus poor AMF seasonality. In the circular plot, the red line indicates the mean date of AMF occurrence, and a longer line indicates stronger seasonality; the timing of AMFs is distributed into 12 monthly bins (where Jan indicates Jan 1st); the numbers indicate the number of AMF events falling into a given month.
Download figure:
Standard image High-resolution image
Lastly, uncertainties in the observational datasets used for this analysis warrant brief discussions: (a) due to typically lower density of COOP stations in complex terrain and no adjustment for undercatch of snowfall, precipitation underestimation is expected in snowy region (Maurer et al 2002, Livneh et al 2013, Sun et al 2019); (b) given the daily resolution of precipitation and USGS streamflow data, temporal variability within 24 h in TC-related precipitation or flood/drought responses is not captured, although the intraday variability in flood magnitude could be substantial for highly urbanized watersheds.
6. Conclusions
Here we performed a climatological analysis of TC impact on hydrological extremes over the Mid-Atlantic region based on spatially distributed observations of hurricane tracks, precipitation, and streamflow. The study emphasized on the spatial variability of TC impacts at local scales given the lack of related knowledge from existing research focused mostly on much coarser spatial scales or storm event scales. Our analysis indicated highly nonlinear and spatially heterogenous hydrological responses to TCs over the Mid-Atlantic region. The distribution of TCP and the TC effect on extreme floods exhibited distinctive spatial patterns—TCP was comparatively higher in the western portions of DRB and the northern parts of SRB, whereas a higher TC influence on extreme floods was found in the southern DRB and the southwestern portions of SRB. Considerable spatial variability was also found in the TC impact on design floods and droughts. For the 100 year flood, TC changed the flood magnitude by −1.1%–23.3% in DRB and −1.2%–53.0% in SRB. For the design risk associated with the 100 year flood, TC changed the risk by −3%–66.5% in DRB and −2.4%–71.4% in SRB. On the flip side, up to 23% of D3 and up to 100% of D6 were ended by TC, and the total duration of D3 and D6 was shortened by TC by up to 25% and 100%, respectively. Considerable heterogeneity was also found in flood seasonality in much of DRB and the southern SRB. The findings highlight the importance of prioritizing sites for coastal hazard risk management and adaptation.
Data availability statement
The data that support the findings of this study are openly available at the following URL/DOI: https://doi.org/10.5281/zenodo.5608806
Acknowledgments
This work was supported by the MultiSector Dynamics, Earth System Model Development and Regional and Global Modeling and Analysis program areas of the Biological and Environmental Research program as part of the multi-program, collaborative Integrated Coastal Modeling (ICoM) project. All model simulations were performed using resources available through Research Computing at Pacific Northwest National Laboratory.