

Abstract
Global food trade is crucial for food security and availability. Trade is typically optimized to promote efficiency, whereas resilience is increasingly being recognized as another important objective. However, it is not clear if prioritizing resilience comes at the expense of efficiency or if the two objectives can be promoted simultaneously. We develop a complex network framework to assess the relationship between efficiency and resilience of food trade for the last half century. There is a competitive relationship between efficiency and resilience when only network topology is considered. However, a cooperative relationship between efficiency and resilience exists when the intensity of trade connections is accounted for. Policy makers can use this framework to evaluate the relationship between efficiency and resilience in critical supply chains.
Export citation and abstract BibTeX RIS
1. Introduction
Global food trade is a critical part of our modern food system [1, 2]. Food trade enables nations around the world to specialize in producing agri-food commodities for which they have a comparative advantage [3] to meet the diverse demands of consumers in distant locations [4, 5]. Investments in transportation infrastructure and trade agreements have helped to increase the connectivity between nations over the last several decades [6] to promote efficiency [7]. However, it is not clear if the efficiency gains that have been obtained through increased connectivity of global trade enhance or detract from its resilience. Higher connectivity may enable consumers to access food from a variety of sources in the event that a major exporter is disrupted [8, 9]. Alternatively, connectivity may enable production shocks and export restrictions to be transmitted to importers [10]. Even though efficiency and resilience are two important objectives of any supply chain, we do not understand how these two goals interact with one another in food trade networks. This study seeks to determine if efficiency and resilience in food trade networks are competitive or cooperative goals.
Complex network methods can be used to understand resilience in an increasingly interconnected world facing growing threats from natural hazards, malevolent attacks, economic shocks and pandemics [11–13]. Previous studies of network efficiency and resilience have not accounted for the intensity of connections [14], which is an important aspect of food trade due to high heterogeneity in mass flux between nations [15, 16]. Additionally, it is important to determine resilience of food trade to two major threats: spreading risk and disruption to a major exporting nation. Most studies of the resilience of food trade consider a single threat [9, 10]. Here, we evaluate food trade resilience to both spreading risk (e.g. contamination among food commodities from a food-borne pathogen) and targeted node attack (e.g. the most important food exporter, both for connections and mass, is 'knocked out' of the trade system, such as from a malevolent cyber attack) [17–19].
The complete removal of the major exporter from the global food trade network is an extreme scenario, yet one that is increasingly necessary to consider. National defense agencies suggest that scenarios in which entire nations are knocked out of the trade system, due to malevolent cyber attacks, are within the realm of possibility [20]. These attacks could incapacitate machinery and computer systems involved in agricultural production, harvest, transport, food manufacturing, inventory control and market information. In 2011, extreme drought led Russia (the second-largest wheat exporter) to impose a complete export ban on wheat [21]. During the global COVID-19 pandemic, over 20 nations imposed border shutdowns and export bans on agri-food commodities [22], including Cambodia and Myanmar, who imposed a complete export ban on rice [23]. These examples highlight that the complete removal of a nation from global trade—although extreme—is plausible.
In this study, we consider efficiency and resilience from a complex network perspective and do not explicitly consider economic aspects. This means that our approach captures the physical network structure of food trade related to the logistics of producing, processing and transporting agri-food commodities around the globe. Previous studies have applied network analysis to food trade. However, studies of food trade networks to date either assess only resilience or efficiency, rather than the relationship between these two important objectives. Tu et al [24] studied the relationship between resilience, network connectedness and resource use. Distefano et al [25] analyzed resilience against export quantity drops in global staple trade. Fair et al [26] predicts the resilience of global wheat trade to targeted and random link removals. Gephart et al [27] studied resilience of fish trade against changes in supply levels. D'Odorico et al [28] analyzed the water use efficiency and connectivity of food trade. Ercsey-Ravasz et al [10] studied the risk of contamination among food commodities through international trade by node-level analysis, while we assess the effects of the complete network structure over spread risk.
We present a comprehensive statistical network framework to assess the trade-off between food trade efficiency and resilience. To our knowledge, this is the first study to quantify the relationship between food trade efficiency and resilience in a way that accounts for both the topological structure and the heterogeneous distribution of trade intensities (see table 6 in the supplementary information (SI), available online at stacks.iop.org/ERL/16/105003/mmedia; the SI provides an in-depth literature review and comparison with prior studies). The following questions guide this study: (a) Is there a trade-off between efficiency and resilience in topological food trade networks? (b) How does the efficiency and resilience trade-off in food trade networks compare with theoretical networks? (c) How does this relationship change when trade intensities are accounted for? (d) How does food trade efficiency and resilience change with time? To answer these questions, we use the COMTRADE database to evaluate real-world empirical networks of global food trade from 1965 to 2018 for the full spectrum of empirical food trade networks, from the trade of individual commodities to the entirety of agri-food. We also generate a suite of theoretical and null-model networks to compare against.
2. Methods
We develop a statistical complex network framework to assess the relationship between efficiency and resilience. We both adopt existing metrics from the literature and introduce novel ones. All of the metrics focus on the existing repeat movement (re-exports and re-imports of food flows) in the global food trade while measuring efficiency and resilience. We use the average shortest path length,  , for topological network efficiency and the epidemic threshold, τ, for topological resilience to contaminant spread among food commodities. We introduce the change in the dominant eigenvalue,
  , to evaluate the resilience of topological networks to targeted removal of the nation with the largest number of export connections. We present a new metric that captures the efficient usage of the trade connections in terms of mass transport. Specifically, we introduce
  to measure the inverse of the total weight [ton] being transmitted through the shortest paths. We introduce
  to quantify resilience to targeted removal of the major mass exporter.
  is defined to be the remaining portion of mass in the network after the mass of the largest exporter is removed. A summary table of all metrics used in this study is provided in table 1.
Table 1. Complex network framework for both topological (i.e. unweighted) and weighted efficiency and resilience. Bold 'X' indicates the novel metrics introduced in this study. Plain 'X' indicates the metrics integrated from the existing literature to create a comprehensive framework.
| Topological efficiency and resilience | |||||
|---|---|---|---|---|---|
| Symbol | Equation | Resilience | Efficiency | Measures | Definition |

|
| × | Average shortest path length of the network | Efficiency as the number of intermediate steps between any two trade partners | |

|

| X | Change in spectral radius of network | Resilience to targeted attack on the exporter with most trade partners | |
| τ |

| × | Epidemic threshold of network structure | Resilience against a food-borne disease contamination among commodities | |
| Weighted efficiency and resilience | |||||
| Symbol | Equation | Resilience | Efficiency | Measures | Definition |

|
| X | Average shortest path length per transported mass | Efficiency as the transportation of larger masses through shorter paths | |

|
| X | Change in mass supply of the trade network | Resilience to targeted attack on the major exporter with most mass supply | |
dij
: minimum number of hops (i.e. shortest path length) between nodes i and j in the unweighted trade network.
N: number of nodes in the trade networks.
λ1: dominant eigenvalue of the original unweighted trade network adjacency matrix.
 : dominant eigenvalue of the unweighted trade network adjacency matrix after the removal of exporter with most trade connections.
 : Supply amount (in tons) of node i in weighted trade network. max
 : largest supply amount (in tons) in the weighted trade network by a single node.
wij
: flow amount (in tons) on link between node i and j in the weighted trade network.
: largest supply amount (in tons) in the weighted trade network by a single node.
wij
: flow amount (in tons) on link between node i and j in the weighted trade network.
To build up our understanding of these metrics, we numerically generate a suite of well-studied theoretical networks (e.g. star, scale-free, random, ring topologies) with multiple weight distributions (unweighted, extreme, power-law, normal, uniform weight distributions). We then apply these metrics to trade data for a variety of agri-food commodities (e.g. grain, meat, vegetables and fruits, and representative individual commodities). Empirical data is collected from 1965 to 2018 for every year to evaluate how the network structure has changed with time. We also generate null-model statistical networks for realistic benchmarks. Table 2 lists all networks included in this study.
Table 2. Networks included in this study. Theoretical networks are numerically-generated based on the given node degree distributions obtained from the literature. Null-model networks are created by keeping the node degree distribution of each empirical food commodity trade network fixed. Empirical networks are created based on the global food trade data obtained from COMTRADE for each year.
| Theoretical networks | |||
|---|---|---|---|
| Topology | Degree distribution | Density | Weight distribution |
| Star | Extreme |
![$[0.02, 0.04, \ldots ,1]$](https://content.cld.iop.org/journals/1748-9326/16/10/105003/revision2/erlac1a9bieqn20.gif)
| Unweighted, Extreme, Power-law, Normal, Uniform |
| Scale-free | Power-law | ||
| Random | Normal | ||
| Ring | Uniform | ||
| Null-model networks | |||
| Commodity group | Single commodities | Years | Mass flux |
| Grain | Wheat, rice, corn, soy | 2018 | Unweighted |
| Meat | Beef, pork, chicken, fish | ||
| Vegetables and fruits | Potato, tomato, apple, banana | ||
| All agri-food | |||
| Empirical networks | |||
| Commodity group | Single commodities | Years | Mass flux |
| Grain | Wheat, rice, corn, soy | 1965–2018 | Unweighted, COMTRADE values |
| Meat | Beef, pork, chicken, fish | ||
| Vegetables and fruits | Potato, tomato, apple, banana | ||
| All agri-food | |||
∗ For the empirical food trade, all of the aggregated and single commodity networks are created individually for each study year, and all of them are analyzed through topological and weighted efficiency and resilience metrics. † The theoretical networks are numerically-generated for various densities for each topology individually. The generated network density values start from 0.02 and go to 1 by 0.02 increment. ◊ For topological efficiency and resilience analysis, unweighted case for both theoretical and empirical networks are considered. They are only studied through their 0-1 adjacency matrices. For the weighted efficiency and resilience analysis, all of the theoretical networks (i.e. for all density values and topology combinations) are assigned with four different weight distributions individually. In the empirical food trade networks, recorded trade amounts [in ton] in the original COMTRADE dataset are included to study the weighted efficiency and resilience. Δ For null-model networks, the node degree distribution of each individual and aggregated commodity trade is kept constant. Thousand simulations of each commodity for the year 2018 is generated.
2.1. Empirical trade data
The COMTRADE database provides information on the bilateral trade between nations for all agricultural and food commodities in units of mass and value [29]. The real-world food trade data from COMTRADE is used to construct the empirical networks in our analysis. We collect and analyze trade data for the following agri-food commodities: (a) aggregated food categories – 'grain', 'meat' and 'vegetables and fruits'; (b) major individual commodities—wheat, rice, maize and soy from 'grain'; beef, chicken, pork and fish from 'meat'; and tomato, potato, apple and banana from 'vegetables and fruits'; and (c) total agri-food—the sum of all agricultural and food commodities. Refer to table 9 in SI for the list of trade data considered. Figure 1(A) provides maps of all aggregated food commodity exports for each country in the year 2018 in units of tons. The United States exports the most 'grain', 'meat' and 'total agri-food' among all countries.

Figure 1. Graphs of COMTRADE food trade data used in this study. Map of mass export [ton] by country for total (A) agri-food, (C) meat, (E) vegetables and fruits, and (G) grain for the year 2018. The United States is the largest mass exporter of all agri-food and exports 2.34E+08 tons. The United States is the major exporter of meat with a total export of 8.73E+06 tons. Spain is the major mass exporter of vegetables and fruits with a total export of 1.44E+07 tons. The United States is the major mass exporter of grain with a total export of 1.52E+08 tons. Time series of total (B) agri-food, (D) meat, (F) vegetables and fruits, and (H) grain trade from 1965 to 2018. Trade by major food category is also provided.
Download figure:
Standard image High-resolution imageData is collected from 1965 to 2018 for each year. Figure 1(B) presents graphs of the total trade in all aggregated food commodities over the study time period broken down by major category. Grain is the largest traded category in terms of total mass. Commodities in the COMTRADE database are coded by the Standard International Trade Classification (SITC). More information on the raw and processed COMTRADE data is included in SI.
We represent the global food trade as a flow network where a node is assigned to each nation and a directed link is assigned to each trade relationship. We consider both exports and imports of commodities, and the direction of links is structured from exporter to importer. The directed network is non-symmetric. Data on re-exports and re-imports are also incorporated. For any re-export, we introduce (a) a directed link from the producer to intermediate stop and (b) another directed link from the intermediate stop to final customer. For example, if the producer nation 'A' first exports the goods to intermediate nation 'B' and then nation 'B' re-exports the same commodity to final consumer nation 'C', we introduce two links into the network. First directed link is from nation 'A' to 'B', and the second one is from nation 'B' to 'C'. By including the re-exports and re-imports, we capture intermediate movement of goods in the food trade network.
2.2. Topological efficiency and resilience metrics
The link-based average shortest path length of the network is used to quantify topological efficiency. This is a commonly preferred unitless network distance metric, as it enables the efficiency of network connections to be determined with only topological characteristics [30–32]. We use  to quantify topological efficiency:
where N is the number of nodes in the network and dij
is the link-based shortest path (i.e. smallest number of jumps) between nodes i and j computed by Dijkstra's algorithm [33]. Bigger  values represent more jumps between any two nodes in the network. As
  gets closer to 1, it represents a more efficient network since each node is connected to every other node with a direct link. From a supply chain perspective, lower
  means that there are lower number of intermediate stops in the flow of goods between any producer and end consumer [34].
Each link in the global food trade network indicates an additional transit through a foreign country. Each new border crossing represents additional time due to loading and unloading processes, as well as additional customs and border paperwork and fees. This would be particularly problematic for perishable goods, in which time delays could lead to food loss and waste, and any extra refrigeration required during transit represents additional energy requirements. So, additional border crossings indicate less efficiency in the network. Hence, having a lower average shortest path length, i.e. lower number of intermediate stops on average, would represent a more efficient flow network [34, 35]. Importantly, note that we focus on complex network efficiency rather than economic efficiency, which typically measures price, in which additional border crossings may or may not enable supply chains to achieve lower prices.
We evaluate the topological resilience of food trade networks to targeted node attack. Targeted node attack and complete removal is a common approach to evaluate supply chain resilience [36]. We consider targeted removal of the major exporter (i.e. the country with the most export links) in order to represent a supply disruption [37]. The definition that we use is agnostic as to the cause of the node-scale removal, but which could occur due to a large shock in that nation's climate or socio-political system, e.g. due to a stochastic weather event or malevolent attack by an adversary. In this way, we determine the dependence of the food trade system on the removal of the key exporter in the network.
To quantify resilience to targeted attack, we introduce a new resilience metric,  .
.  quantifies network reliance on the nation that has the largest number of export connections. Our approach incorporates eigenvalues of the adjacency matrix, which many prior studies have also used to assess resilience [38–43]. Our metric,
  , is distinct to prior resilience metrics, in that it best captures resilience to targeted attack in trade networks.
  computes the percentage change in the dominant eigenvalue of the directed network adjacency matrix when the node with highest out degree is removed from the graph:
where λ1 is the dominant eigenvalue of the square adjacency matrix of the original directed network (i.e. all nodes are included in the graph).  is the new dominant eigenvalue of the square adjacency matrix of the directed network after removing its highest out degree node, (both the corresponding row and column are removed from the adjacency matrix).
  is the percentage change in the dominant eigenvalue of the directed network after removal of the node with the highest out degree.
  can be implemented on both directed and undirected networks without loss of generality.
The dominant eigenvalue of the adjacency matrix represents the spectral radius of the network [44]. The spectral radius is correlated with node degree variations [45]. Network topologies with higher degree variations have higher dominant eigenvalues whereas topologies with lower degree variations have lower dominant eigenvalues. Core-periphery topologies have higher degree variations and lattice-like topologies have lower degree variations. Hence, under the same network size and density, core-periphery topologies have higher dominant eigenvalues whereas lattice-like topologies have lower dominant eigenvalues.
Importantly, repetitive flow transmissions between nodes is captured by the dominant eigenvalue of the adjacency matrix [46]. The dominant eigenvalue of the adjacency matrix is bounded by network connectivity (see SI for more detailed discussion). As network topologies that have higher connectivity would enable more frequent repeat movements, they will have higher dominant eigenvalues. As network topologies that have lower connectivity would enable less frequent repeat movements, they will have lower dominant eigenvalues [47]. Hence, dominant eigenvalue of the adjacency matrix represents the ability of repeat transmission in the network based on its topology [48], i.e. branching of the network structure [49].
A higher percentage change in the dominant eigenvalue indicates the network has a greater dependence on the removed node for the flow transmission. A lower  indicates networks that are more resilient to the threat of targeted node removal, as their flow propagation is less affected from the removal of the node with highest out degree.
For targeted node removal in unweighted networks, we consider the largest supplier of trade connections which stands for the node with highest out degree in the food trade network [50–53]. As degree is one of the most common node centrality measures [54, 55], this approach represents the worst-case scenario in terms of node removal which is a common supply chain network resilience assessment [34].
We also consider spreading risk of a food borne disease among food commodities. To assess the resilience of the network to spreading risk, we use the epidemic threshold metric, τ. τ is also based on the dominant eigenvalue of the unweighted network and provided in equation (3) as:
where λ1 is the dominant eigenvalue of the original directed adjacency matrix and τ is the epidemic threshold.
τ has been used as a measure of resilience against spreading risk in graph theory [56–58], such as virus spread in internet networks [59–61]. Similar to internet networks, food trade can also be characterized with repeat movements of flow between nodes. Hence, in food trade among the re-export and re-import processes, any food-borne disease that starts in one country can spread through trade. If the value of network dominant eigenvalue is small, then threshold for any disease to become an epidemic τ is higher. This is because the network connectivity and its ability to transmit flow is lower. So, the probability that the disease will die out before it contaminates the majority of the network is higher (i.e, likely will not turn into an epidemic). On the other hand, if the value of network dominant eigenvalue is large, then the threshold for observing an epidemic τ is low. This means that passing the epidemic threshold is easier and there is a higher chance for a disease to become an epidemic in the network, since network connectivity and its flow transmission ability is higher.
For example, core-periphery structures have higher connectivity than lattice-like structures. Therefore, (under the same network density) the dominant eigenvalue of the core-periphery topologies are higher than lattice-like topologies. This means that the epidemic threshold is lower for core-periphery structures than it is for lattice-like structures. Hence, the probability of a locally borne disease contaminating the network is higher in core-periphery structures. On the other hand, as the dominant eigenvalues of lattice-like topologies are lower, they have higher epidemic thresholds. Hence, the probability of a locally borne disease contaminating the network is lower in lattice-like structures [62].
2.3. Weighted efficiency and resilience metrics
Weighted efficiency and resilience metrics explicitly account for trade intensity of arcs (and not just topology). The weighted efficiency and resilience metrics directly build on the unweighted metrics but with explicit consideration of mass. We develop a new metric to quantify the weighted efficiency of trade networks. Our weighted efficiency metric,  , captures the efficient usage of the trade connections in terms of mass transport. This is distinct to other flow-based efficiency metrics in the literature [63, 64], which usually incorporate the cost or distance of transport as the link weights. However, existing metrics do not explicitly consider the efficient allocation of mass flux to shortest paths in the network. With this goal in mind, we build on
  by using link-based shortest paths, but now also consider the allocation of mass to paths.
Weighted efficiency,  , is formulated as:
where wij
is the total weight [ton] being transmitted through the link-based shortest path, dij
, from node i to j.  is an inversely weighted shortest path measure since mass is in the denominator and shortest path length is in the numerator. Network efficiency increases as the value of
  ) decreases. This is because
  ) becomes smaller as greater mass is transmitted through shortest paths. Conversely, as
  ) increases the efficiency of the network declines. This means that the shortest paths in trade networks should be allocated greater quantities of mass in order to achieve lower values of
  , i.e. higher efficiency. A simple representation of how
  works at both the link and network-level is illustrated in figure 10 in SI.
Our weighted resilience metric builds upon  , in that targeted removal of the most important exporter is again considered. Weighted resilience,
  , quantifies the reliance of the network on the largest mass supplier nation. Specifically,
  calculates the mass remaining in the trade system after the largest mass exporter is eliminated:
where  is the mass export of each nation i and max
 is the total quantity of mass exported by the largest mass exporter. Larger values of
  indicate that the mass of the food trade network is less reliant on the major mass exporter, which means the network has higher weighted resilience. Smaller values of
  indicate the food trade network has greater reliance on the major mass exporter for the mass available to the trade system, or that the network is less resilient to targeted removal of this node. Hence, the dependence of the food trade network on a single nation in terms of the supply amount [in tons] is quantified by
  . The countries that are removed to calculate
  in empirical networks are shown in figure 1 (e.g. the largest mass exporter by food category). Note that only resilience to mass flux disruption is considered, as spread risk is mainly based on topology.
2.4. Theoretical and null-model comparison networks
We construct theoretical and null-model networks to better understand the performance of the efficiency and resilience metrics. Using theoretical networks as reference points to the empirical network of study is a common approach in the literature [65, 66]. For example, Rodríguez-Iturbe and Rinaldo [67] considered star and ring topologies as a comparison point for the fractal structure of river basins. Tu et al [24] adopted the Erdös-Rényi model as a reference point for global food trade modularity and interconnectedness. Fair et al [26] analyzed scale-free network statistics as a comparison point for global wheat trade. Similarly, Popp et al [68] examined scale-free network clustering as a reference point for global honey trade.
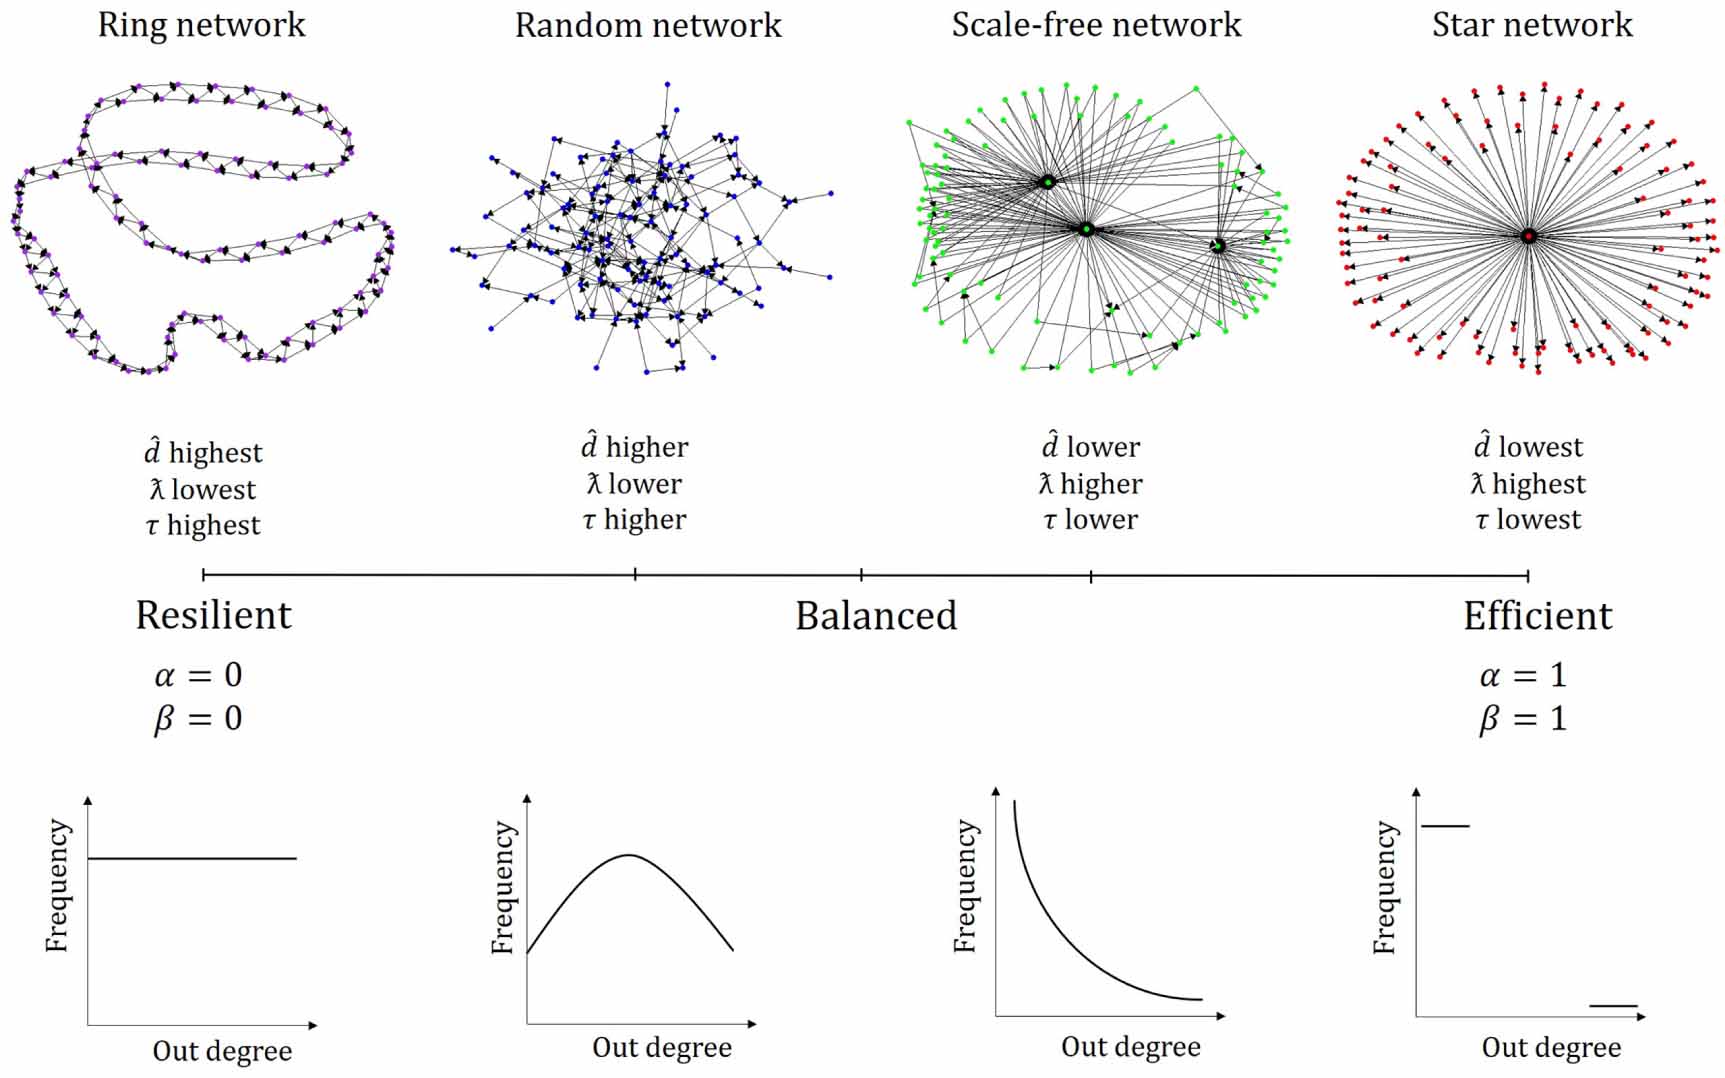
We generate two extreme theoretical networks (i.e. ring and star) and two more moderate networks (i.e. random and scale-free). Random networks are generated according to the Erdös-Rényi model; scale-free networks are generated based on the Barabási-Albert model. Core-periphery networks are known to prioritize efficiency, while lattice-like networks prioritize resilience [69] (see figure 2). For this reason, values of  ,
,  and τ in the ring and star networks provide the upper and lower bounds of the envelope for the empirical food trade results, since these theoretical networks represent extremes in terms of efficiency and resilience (see figure 3). The random and scale-free networks provide a more moderate reference point for values of
  ,
,  and τ.
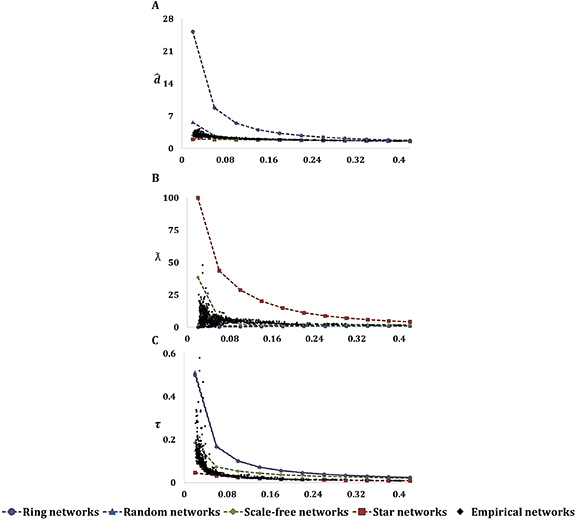
Figure 2. Topological efficiency and resilience metrics. (A) Efficiency is measured with average shortest path length,  . (B) Resilience to removal of the node with most export connections is measured with the change in the dominant eigenvalue,
  . (C) Resilience against spread risk is measured with the epidemic threshold, τ. The envelope of potential outcomes is shown by the area between ring and star networks. Lattice-like topologies (i.e. ring and random networks) have higher average shortest paths but lower change in dominant eigenvalues as well as higher epidemic thresholds. Core-periphery topologies (i.e. star and scale-free networks) have lower average shortest path values but higher change in dominant eigenvalues as well as lower epidemic thresholds. Numerical results are average of 1000 generated networks for each density and topology. Food trade data is shown with the black diamonds.
Download figure:
Standard image High-resolution image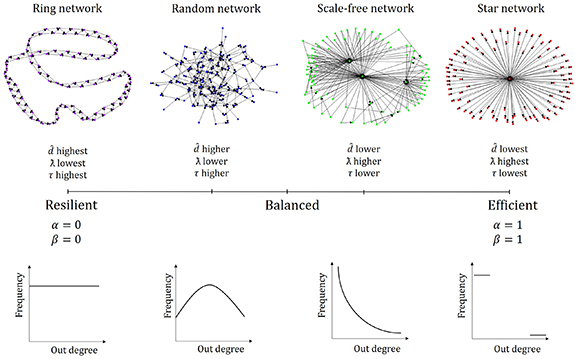
Figure 3. Schematic of topological efficiency and resilience by network type. Values of efficiency ( ), resilience to node removal (
 ), and resilience to spread risk (τ) are provided by network type. Competition parameters are presented to quantify the competition between efficiency and resilience. α captures the competition between
  and
and  ; values of α = 1 indicate an efficient network, values of α = 0 indicate a resilient network. β captures the competition between
  and τ; values of β = 1 indicate an efficient network, values of β = 0 indicate a resilient network.
Download figure:
Standard image High-resolution imageNull-models provide a more realistic benchmark for trade networks [70, 71]. One can generate the randomized version of the empirically-observed networks by keeping certain topological characteristics fixed with null-models [72]. The node degree distribution is one of the most critical topological characteristics as it is enough to predict other high-order network statistics [73]. Hence, we generate null-model networks for empirical food trade networks by keeping the node degree distributions fixed. For year 2018, we use null-model estimations to compare the observed topological efficiency and resilience of each food commodity. Table 2 provides a summary of the theoretical, null, and empirical networks considered.
3. Results
3.1. Topological network efficiency and resilience
Figure 2 provides  ,
,  and τ for both theoretical and empirical networks. Networks with a more defined core-periphery structure (i.e. star and scale-free networks) have greater efficiency (e.g. small
  ; see figure 2(A)), which is consistent with the literature [69]. However, the structure of these networks is dependent on core nodes, so their resilience against the removal of the core nodes is low (e.g. high
  ; see figure 2(B)). Also, these networks are vulnerable to spread risk since contamination in the core node could rapidly transmit an epidemic in the whole network (e.g. low τ; see figure 2(C)). Conversely, networks with a lattice-like structure (i.e. random and ring graphs) have high resilience due to the absence of a core node (e.g. low
  ; see figure 2(B)). Lattice-like networks have normal and uniform degree distributions (see figure 3), so there is no superspreader node to contaminate the whole network. However, the average shortest path lengths of lattice-like networks are relatively high, as multiple jumps are required to establish a connection between any two nodes (e.g. high
  ; see figure 2(A)). So, lattice-like network structures have low efficiency.
Numerical findings illustrate that there is a competitive relationship between efficiency ( ) and resilience (for both
  and τ) when density is held constant (see figures 11 and 12 in the SI). As density increases the numerical metrics converge, indicating that differences between types of networks fade as networks become dense (see figure 2). Network density is the fraction of existing links to the number of links that could exist in the graph (refer to equation (12) in the SI). Empirical networks (i.e. food trade networks created with data from COMTRADE) exist across the range of densities (see black points in figure 2). Empirical networks that have relatively high densities usually perform worse in
  ,
,  and τ when compared with the scale-free networks. In scale-free networks, multiple hubs exist that are connected to almost all the nodes in the periphery. However, empirical networks have a higher number of hubs which are not connected to all nodes in the periphery. This leads scale-free networks to be more efficient than empirical networks (i.e. smaller average shortest path,
  , in small-world networks). Also,
  is smaller in scale-free networks, as when one hub is removed the remaining (smaller) hubs connect the rest of the nodes in the network. Scale-free networks also have fewer potential disease superspreaders, so they perform better in τ than empirical networks.
Food trade network values fall within the range of null-model results in most cases (see figure 4). Values of  are generally on the upper-end of the range (see figure 4(A)) while
  values fall on the lower-end of the estimation range (see figure 4(B)). The range of expected values for each metric narrows with increased density. Individual food commodities are sparser and their null-model ranges show higher variation. This is because sparse networks are more sensitive to changes to a single connection. Null-model findings compliment theoretical results. Both theoretical and null-model comparisons highlight the important role of the degree distribution in shaping topological efficiency and resilience. Null-model results provide a more realistic benchmark to global trade, although the random rewiring may not share a resemblance with the real-world countries or trade links represented by the data. The theoretical networks provide insight into the performance of the metrics in unrealistic (in terms of trade) but well-studied networks. Null-model and theoretical network findings compliment each other and enhance our framework.

Figure 4. Graphs of null-model estimates for topological efficiency and resilience metrics. (A) Average shortest path length,  , (B) change in dominant eigenvalue,
  and (C) epidemic threshold, τ, as well as the competition parameters (D) α and (E) β estimates for all analyzed food commodities based on 2018 empirical networks. The null-model estimates provide the range of potential outcomes for each metric and the empirically-observed values are represented within this range for each commodity by black diamonds. Note that the empirically-observed values are located on the right of the null-model estimates for each commodity.
Download figure:
Standard image High-resolution image3.1.1. Competition parameters for unweighted networks
The competitive relationship between efficiency and resilience is a function of network density (see figure 5). The competition between efficiency and resilience to node removal becomes weaker as density increases. As more connections are made in the network the average shortest path length decreases (e.g.  gets smaller, efficiency increases). With greater density, the network relies less on a single node, as there are multiple nodes with high out-degree to maintain network structure. This means that both efficiency and resilience to node removal increase as the network becomes more connected. The ultimate case is for a complete network with density equal to one. For a complete network, both the efficiency and the resilience against node removal are optimized by the network. However, the competition between efficiency and resilience to spread risk grows stronger as the network density increases. This is because τ declines with density, which means the chance of a disease dying out decreases as all nodes are connected with one another. Here, a complete network would have the best efficiency but the lowest resilience against an epidemic, since every node is a candidate for spreading the disease throughout the network.
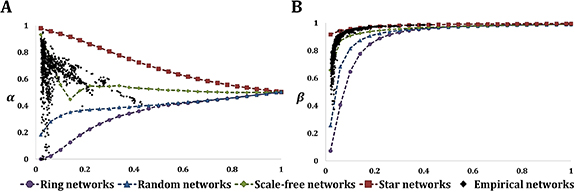
Figure 5. Topological efficiency and resilience competition parameters. (A) The competition parameter, α, between efficiency,  , and resilience to node removal,
  . (B) The competition parameter, β, between efficiency,
  , and resilience to spread risk, τ. Numerical values are average of 1000 networks for each density and topology. Food trade data is shown with the black diamonds.
Download figure:
Standard image High-resolution imageWe introduce a scheme to assess the competition between efficiency and resilience. Figure 3 presents the competition parameters for topological networks and how they relate to  ,
,  and τ. We formulate two competition parameters in equations (6) and (7), which can be used to locate networks on the competition scale.
The first competition parameter, α, is formulated in equation (6) to quantify the competition between topological efficiency and resilience in terms of the reliance on a single node to propagate flow. The second competition parameter, β, is formulated in equation (7) to quantify the competition between topological efficiency and resilience against food-borne disease spread in the network. Both competition parameters range from 0 to 1, with 0 indicating the most resilient network and 1 indicating the most efficient network.
In lattice-like topologies (i.e. random and ring networks) gains in efficiency overpower the gains in resilience against node removal as density increases (see figure 5(A)). Lattice-like values of α are smaller for low densities and increase to 0.5 with increased density. Conversely, the gains in resilience against node removal overpower the efficiency gains in core-periphery topologies (i.e. star and scale-free networks) as density increases. Core-periphery values of α start close to 1 and go down to 0.5 with increased density (i.e. α moves from efficient to balanced). This indicates that the competition between  and
and  softens with increased network density. As density increases, both lattice-like and core-periphery topologies become more efficient, yet more vulnerable (i.e. less resilient) to spread risk. Figure 5(B) plots the competition parameter, β, which increases towards 1 across all networks as density increases. Thus, β sharpens with density. As density increases, different network topologies become more similar, as do their efficiency and resilience values. Therefore, the range of the competition parameters α and β decreases with density (see figure 13 in SI).
Empirical food trade networks are similar to scale-free networks for α. At low densities, empirical values of α fall between random and scale-free networks. The low-density empirical food trade networks have multiple hubs but not as many as scale-free networks. As density increases, scale-free networks gain more hubs, so their gains in resilience exceeds the gains in resilience of empirical food trade networks. However, around a density of 0.1 no new hubs are introduced in scale-free networks, such that empirical food trade networks are more resilient at some higher densities (e.g. note the lower values of α in empirical food trade networks vs. scale-free at moderate densities in figure 5(A)). For β, low density empirical food trade networks are similar to scale-free. But as density increases, scale-free networks have less hubs than do empirical food trade networks, leading food trade data to have higher β values around density values of 0.1. Although the number of hubs is higher in dense empirical food networks, they are not as well-connected as scale-free hubs. Yet they still have the potential to be significant disease spreaders, leading empirical food trade networks to have less resilient values of β.
The empirically-observed competition parameters fall within the null-model range. Empirical α values are generally lower than null-model estimation means (see figure 4(D)). This indicates that food trade is less efficient and more resilient to targeted node removal than the null model mean would suggest. However, the empirically-observed β values are generally higher than estimation means since efficiency is lower but resilience against spread risk is roughly the same (see figure 4(E)).
3.2. Weighted network efficiency and resilience
Values of  and
and  are illustrated in figure 6 for combinations of network topologies and mass flux distributions (e.g. uniform, normal, power-law and extreme weight distribution; see figure 14 in SI). As density increases while the total network weight remains constant, the mass per link decreases. Yet, the length of the average shortest path also decreases as density increases, such that the weighted efficiency increases if the gains in shortest path lengths overpower the loss in mass per link. The weighted efficiency decreases if the loss in mass per link overpowers the gains in shortest path lengths (see figure 15 in SI). As the total network weight increases, the mass per link increases; hence, the weighted efficiency increases (see table 10 in SI). So, for a network to be more efficient it should transport more mass through the most used links. According to these numerical results, if the node weights have a uniform or normal distribution, then the lattice-like structures, i.e. ring or random network topologies, result in greater efficiency (see table 10 in SI). On the other hand, if the node weights follow a power-law or extreme distribution, then the core-periphery structures, i.e. scale-free or star network topologies, with correlated node degree and strength yield a better efficiency than do lattice-like structures (see figure 15 in SI).
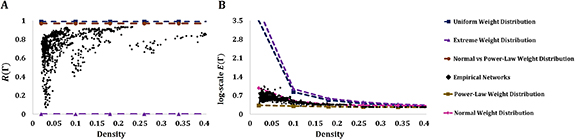
Figure 6. Efficiency and resilience metrics for weighted networks. (A) Resilience is measured with the remaining portion of total mass flux after the removal of the major exporter,  . The envelope of potential outcomes is shown by the area between uniform and extreme weight distributions. The break-point between normal and power-law weight distributions is provided as all empirical food trade data falls within the
  range of the power-law weight distribution. Higher
  values indicate higher values of resilience, in which a greater portion of the mass would remain in the network after the removal of the major exporter. (B) Efficiency is measured with the inversely weighted average shortest path to account for link-based distance per mass traded,
  . The boundaries are set by the maximum and minimum
  values obtained across the numerical experiment. Numerical results are average of 1000 generated networks for each density, weight distribution, total mass flux, and topology. Food trade data is shown with the black diamonds.
Download figure:
Standard image High-resolution imageThe value of  is constant with density across numerical weight distributions, since the weights assigned to each node and total network weights are constant (see figure 6(A)). In the numerical simulations, only the number of links connected to each node varies across network topologies as the node weight distribution and total mass are kept constant. Hence, the resilience metric does not depend on the topology but on the node weight distribution. Resilience values above the brown line in figure 6(A) have a normal weight distribution; values below the brown line have a power-law weight distribution. All empirical values are in the resilience range of the power-law weight distribution, but have a more homogeneous weight distribution as they move closer to the brown line. The empirical food network values move from more to less extreme heterogeneity with increasing density. In figure 6(B), aggregated food commodities have both the higher density and total mass. Their efficiency values are also higher. Again, empirical
  values are within the bounds of the power-law and normal weight distributions. Empirical values are close to the normal weight distribution for low densities and become more power-law as density increases. The empirical values that follow the power-law weight distribution are the aggregated food commodities.
Since resilience is constant by topology, network structures that perform better in efficiency under the same node weight distribution and same total network weight promotes weighted efficiency and resilience simultaneously. In an extreme weight distribution a star network topology promotes efficiency and resilience simultaneously; for a power-law weight distribution the scale-free network topology (where large mass exporters also have high node out-degrees), promotes both efficiency and resilience (see figure 15 and table 10 in SI). The random network topology in combination with the normal weight distribution promotes efficiency and resilience simultaneously. Ring network topology with a uniform weight distribution simultaneously promotes efficiency and resilience. In brief, if the node degree distribution correlates with the node strength distribution under the assumption of constant total weight, better efficiency and resilience is achieved (see figures 15 and 16 in SI for a summary).
3.2.1. Cooperation parameters for weighted networks
When trade intensity is taken into account efficiency and resilience can behave cooperatively. There are various topology and weight distribution combinations which achieve higher efficiency and resilience simultaneously. To assess the relative cooperation across networks, we introduce two cooperation parameters, ξ and ρ, to locate the networks on the graph provided in figure 7(A). The cooperation parameters, ξ and ρ, quantify the relationship between efficiency and resilience as:

More detailed information regarding the transition from  and
and  to
to  and
and  respectively, is provided in SI (also figures 17–19 in SI).

Figure 7. Cooperation in efficiency and resilience for weighted food trade networks. (A) Schematic of the cooperation scheme. Networks that prioritize resilience over efficiency could be located by points 1 and 2. Networks that emphasize efficiency more than resilience could be located in points 5 and 6. Networks that promote both efficiency and resilience simultaneously could be indicated by points 3 and 4. Points that are closer to the origin (points 1, 3, 5) have smaller efficiency and resilience and are considered less well-designed. Points that are further from the origin (points 2, 4, 6) have higher efficiency and resilience so they are more well-designed. (B) Empirical values averaged over 2008–2018 for aggregated and individual food commodities. (C) Change trend of the empirical value averages from 1965–1975 to 2008–2018 for both aggregated and individual commodities. Start point of the arrow is 1965–1975 average, end of the arrow is the 2008–2018 average.
Download figure:
Standard image High-resolution imageNote that  [0, 2] and ξ values of 0 indicate low values of both efficiency and resilience (i.e. less well-designed network). ξ values of 2 indicate relatively high values of both efficiency and resilience (i.e. more well-designed network). ρ captures if the network is emphasizing efficiency or resilience more, or if the two features are balanced. ρ values
  1 indicate the network is prioritizing efficiency; values
  1 indicate resilience is the priority. ρ values close to 1 indicate a balance between efficiency and resilience. The mean of
  and
and  from 2008 to 2018 for food trade are plotted in the cooperation scheme in figure 7(B). 'All agri-food' exhibits the highest levels of both efficiency and resilience (note black triangle in figure 7(B) have the highest x − y location). In figure 7(C), the time trend for each commodity is represented from the average of metrics from 1965–1975 to 2008–2018. In figure 7(C), through time almost all food commodity networks tend to prioritize resilience (see arrow as movement between 1965–1975 and 2008–2018 to more resilient region of the cooperation scheme). Please see table 3 for a summary of the competition and cooperation parameters.
Table 3. Trade-off parameters to assess the relationship between efficiency and resilience. A competitive relationship is uncovered between efficiency and resilience in topological networks, so a 'competition parameter' is presented for topological networks. A cooperative relationship is uncovered between efficiency and resilience in weighted networks, so a 'cooperation parameter' is presented for weighted network.
| Competition parameters for topological networks | ||
|---|---|---|
| Symbol | Equation | Definition |
| α |

| Competition between topological efficiency and resilience against targeted node removal |
| β |

| Competition between topological efficiency and resilience against contamination spread |
| Cooperation parameters for weighted networks | ||
| Symbol | Equation | Definition |
| ρ |

| Ratio between weighted efficiency and resilience |
| ξ |
 + +
| Sum of weighted efficiency and resilience |
 : average shortest path length, topological efficiency metric.
 : change in dominant eigenvalue, topological resilience metric for targeted node removal.
τ: epidemic threshold, topological resilience metric for contamination spread among food commodities.
: change in dominant eigenvalue, topological resilience metric for targeted node removal.
τ: epidemic threshold, topological resilience metric for contamination spread among food commodities.
 : inversely weighted average shortest path length (scaled), weighted efficiency metric.
 : remaining total mass percentage (scaled), weighted resilience metric for targeted node removal.
3.3. Competition and cooperation parameters over time
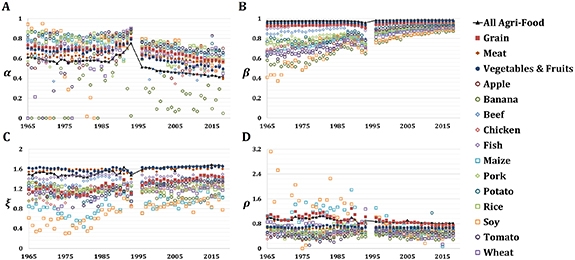
The number of countries participating in trade and the number of trade connections generally increased from 1965 to 2018 (see table 4). The number of links increased more than the number of trading countries, so the density of food trade increased over time. In general, as the density of food trade increases the topological efficiency and resilience to removal of the core node increases. However, food trade networks become more vulnerable to disease spread risk with increased density. Figures 8(A) and (B) presents α and β values through time. Values of α are more variable prior to 1990 (especially in individual food commodities), with a decreasing range after 1990 when trade becomes more dense. However, there exists a time period around 1990–1996 where the food trade networks get sparse. At the same time period, total trade amount also decreases for each food commodity (see figure 1). During this period, α values tend to increase which means that networks prioritize efficiency more than resilience. As the sparsity increases, reliance on the nation with the largest number of export connections seems to be increasing and networks get more vulnerable against targeted node attacks. However, after the food trade networks get denser, the criticality of a single nation tend to decrease whereas networks get more resilient against targeted node attack. As multiple nations become 'hubs', α values decrease and get closer to 0.5.
Figure 8. Time series of the trade-off parameters between efficiency and resilience. (A) Competition between efficiency and resilience to node removal in unweighted networks, α. (B) Competition between efficiency and resilience to disease spread in unweighted networks, β. (C) ξ measures cooperation through the sum of weighted efficiency and resilience. (D) ρ measures cooperation through the ratio between weighted efficiency and resilience.
Download figure:
Standard image High-resolution image
Table 4. Efficiency and resilience metrics for food trade networks from 1965 to 2018. The mean of each variable over the time period is provided, as is the % change from 1965 to 2018.
| Commodity | Density |

|

|

| τ |

|

|

|

|

|

|

|
|---|---|---|---|---|---|---|---|---|---|---|---|---|
| Apple | 0.039 | 124.56 | 8.11 | 53.53 | 0.085 | −77.17 | 2.87 | −24.17 | 0.80 | 20.91 | 0.64 | −15.78 |
| Banana | 0.035 | 108.87 | 1.96 | −40.26 | 0.151 | −81.79 | 3.08 | 9.48 | 0.76 | 1.69 | 0.71 | 70.49 |
| Beef | 0.053 | 9.88 | 5.64 | −310.26 | 0.053 | −83.99 | 2.59 | −2.84 | 0.84 | 4.20 | 0.61 | −3.10 |
| Chicken | 0.041 | 164.03 | 6.96 | −86.25 | 0.083 | −76.56 | 2.72 | −16.87 | 0.70 | 10.16 | 0.63 | −30.48 |
| Fish | 0.090 | 82.63 | 5.08 | −60.91 | 0.031 | −54.52 | 2.21 | −10.35 | 0.86 | −1.04 | 0.50 | −19.16 |
| Maize | 0.040 | 144.04 | 9.12 | −64.35 | 0.081 | −79.87 | 2.92 | −24.38 | 0.46 | 60.31 | 0.66 | 12.51 |
| Pork | 0.037 | 39.62 | 5.65 | −33.88 | 0.069 | −62.34 | 2.64 | −0.98 | 0.75 | 61.58 | 0.64 | −0.73 |
| Potato | 0.052 | 237.69 | 10.81 | −71.88 | 0.061 | −76.51 | 2.70 | −27.96 | 0.73 | 7.26 | 0.57 | −14.31 |
| Rice | 0.053 | 136.08 | 9.57 | −80.00 | 0.072 | −79.17 | 2.70 | −7.48 | 0.72 | 3.62 | 0.59 | 25.51 |
| Soy | 0.037 | 60.09 | 9.96 | −89.25 | 0.155 | −91.64 | 3.01 | 2.02 | 0.38 | 329.74 | 0.71 | 46.57 |
| Tomato | 0.046 | 223.10 | 7.20 | 110.60 | 0.092 | −86.25 | 2.81 | −16.04 | 0.76 | 11.66 | 0.66 | −5.91 |
| Wheat | 0.036 | 50.26 | 5.94 | −176.91 | 0.104 | −374.46 | 2.90 | −1.85 | 0.69 | 21.73 | 0.61 | 32.05 |
| Grain | 0.117 | 58.31 | 4.74 | −56.43 | 0.027 | −56.41 | 2.16 | −8.87 | 0.63 | 41.80 | 0.41 | −1.65 |
| Meat | 0.150 | 44.76 | 3.53 | −65.84 | 0.021 | −49.09 | 1.97 | −6.15 | 0.89 | 1.47 | 0.38 | −11.72 |
| Vegetables and fruits | 0.171 | 36.23 | 3.60 | −59.51 | 0.019 | −48.40 | 1.94 | −3.03 | 0.90 | 3.67 | 0.37 | 1.07 |
| All agri-food | 0.312 | 52.00 | 2.13 | −57.97 | 0.012 | −47.82 | 1.71 | −9.08 | 0.78 | 20.87 | 0.27 | −4.34 |
Food commodity groups balance efficiency and resilience to node removal better than individual food commodities. Individual food commodities are generally prioritizing efficiency over resilience (see table 5). This is reasonable as for a single commodity, only a few countries have comparative advantages. Hence, they mainly provide the export connections. So, network efficiency is prioritized over resilience (i.e. trade is from a few key nation to every other nation but the network is highly dependent on key nations to maintain the flow transmission). However, α values are moving further away from 1 over time, indicating the networks are starting to prioritize resilience more over time. 'All agri-food' is the most resilient to reliance on a single nation. This is sensible, since there are multiple trade hub nations when all agri-food commodities are considered. The 'Grain' network is the least resilient commodity group, with the largest α values throughout the study time period (see table 5). This lack of resilience in grain trade has been exhibited in recent years, such as during the 2007–08 world food crisis and in 2010–11 when several major producers imposed export restrictions [26, 74].
Table 5. Competition and cooperation parameters for food trade networks from 1965 to 2018. The mean of each variable over the time period is provided, as is the % change from 1965 to 2018.
| Commodity | α |

| β |

| ξ |

| ρ |

|
|---|---|---|---|---|---|---|---|---|
| Apple | 0.69 | 30.55 | 0.81 | 39.42 | 1.24 | 23.90 | 0.46 | 8.06 |
| Banana | 0.27 | −28.38 | 0.71 | 50.45 | 1.13 | −22.90 | 0.40 | −58.84 |
| Beef | 0.64 | −62.66 | 0.88 | 7.16 | 1.31 | 4.21 | 0.47 | −0.49 |
| Chicken | 0.66 | −49.36 | 0.82 | 34.06 | 1.14 | 32.37 | 0.54 | 87.26 |
| Fish | 0.68 | −23.62 | 0.94 | 6.65 | 1.45 | 6.54 | 0.58 | 22.92 |
| Maize | 0.74 | −19.11 | 0.81 | 44.76 | 0.86 | 21.10 | 0.87 | −47.68 |
| Pork | 0.65 | −17.58 | 0.85 | 14.86 | 1.19 | 36.84 | 0.49 | −37.40 |
| Potato | 0.77 | −21.03 | 0.86 | 23.58 | 1.23 | 11.15 | 0.59 | 10.59 |
| Rice | 0.75 | −32.67 | 0.84 | 25.56 | 1.20 | −7.73 | 0.57 | −26.75 |
| Soy | 0.66 | −39.19 | 0.71 | 117.75 | 0.72 | 26.16 | 1.26 | −87.59 |
| Tomato | 0.66 | 51.23 | 0.80 | 49.79 | 1.19 | 10.61 | 0.46 | −2.81 |
| Wheat | 0.61 | −53.40 | 0.78 | 26.58 | 1.15 | −2.37 | 0.60 | −51.25 |
| Grain | 0.68 | −22.55 | 0.95 | 4.69 | 1.27 | 21.06 | 0.93 | −28.72 |
| Meat | 0.63 | −38.44 | 0.96 | 3.00 | 1.58 | 3.86 | 0.67 | 5.98 |
| Vegetables and fruits | 0.63 | −29.54 | 0.96 | 2.33 | 1.61 | 1.95 | 0.68 | −4.05 |
| All agri-food | 0.54 | −31.12 | 0.98 | 1.46 | 1.57 | 11.37 | 0.90 | −16.00 |
Figure 8(B) plots the competition between efficiency and resilience to disease spread risk (β) over time. Food trade networks are becoming more efficient over time, at the expense of resilience to spread risk (e.g. note increasing β values). This is sensible as through time number of trade relations increase, as well as the network density and connectivity. However, higher connectivity increases the potential for a contamination to spread among traded food commodities. Similar to α, the range of β decreases with time, which is consistent with the understanding that as density increases β approaches 1. The least resilient network against disease spread risk is the fish trade (mean β = 0.94); the most resilient network is the banana trade (mean β = 0.71) as fish trade has the most dense whereas banana trade has the most sparse network (see table 5). It is reasonable that the fish trade is the most vulnerable to food-borne disease spread, as disease risks associated with international trade of aquaculture have been shown to be high [75].
Figure 8(C) plots ξ over time. For single food commodities, the fish trade is the most well-designed through time (i.e. highest ξ value). The fish trade has the highest density of all individual food commodities, as well as the highest 1- and
and  values (see table 4). This is because fish trade also has the largest total mass flux and more of a correlated power-law like node degree and weight distribution among its exporter nations. The least well-designed food commodity trade is soy, which has the lowest values of 1-
 and
and  . Soy has the lowest network density and its low total mass flux punishes its efficiency, whereas having almost an extreme weight distribution among its exporter nations punishes its resilience values. Mean ξ of fish trade is 1.45, while it is 0.72 for the soy trade (see table 5). 'All agri-food', 'meat' and 'vegetables and fruits' commodity groups exhibit the highest ξ values over time, indicating that these networks have the highest levels of both efficiency and resilience to mass flux disruption. These groups of food commodities have high densities, and achieve relatively high 1-
 and
and  values with high total network mass fluxes. More importantly, the power-law like node degree and strength distributions of the exporter nations highly correlate in these commodity trades. Again, 'Grain' stands out as the least well-designed network, compared with other aggregated food commodities. The grain trade has the highest reliance on a single exporter and has the lowest efficiency in its trade connections in terms of distance per mass transported. This is mainly driven by low density and high heterogeneity in weight distribution of exporters.
For the ρ parameter, values closer to 1 indicate networks that are promoting efficiency and resilience simultaneously. ρ values that are larger than 1 represent networks that are prioritizing efficiency more; ρ values smaller than 1 represent networks that are prioritizing resilience more. Figure 8(D) shows ρ over time. Prior to 1990, the soy and maize trade ρ values fluctuated substantially. Yet, single food commodities have become more similar in recent decades, with values smaller than, but close to 1. This indicates that individual commodity networks have been prioritizing resilience more in recent decades (see figure 8(D)). This means that multiple nations start to participate in the mass supply in individual food commodities rather than a single major mass supplier. However, as both density and total mass flux increases through time, the efficiency (i.e. link-based shortest distance per mass trade) does not change a lot. The range of ρ parameter values is smaller for food commodity groups over time. This is because aggregated food commodities have similar weighted efficiency and resilience values. 'Grain' and 'all agri-food' have improved their resilience over efficiency with time (ρ moving from 1 to 0.8; see figure 8(D)). The trade of 'vegetables and fruit' and 'meat' also tended to improve resilience over efficiency with time (ρ moves towards 0.6 from 0.8). This could be explained by that multiple nations participate in mass supply through time. However, the link-based shortest distance per mass does not change a lot in these commodity groups either, as total mass flux increases are complimented by density increases. In recent decades, gains in network density and total mass flux have led aggregated food commodity groups to become more similar in terms of their efficiency and resilience.
Almost all food commodities tend to become more resilient through time. This trend is observable in figure 7(C) where the movement of  and
and  averages from 1965–1975 to 2008–2018 is plotted for each commodity. As in figures 8(C) and (D), ρ values seem to generally decrease from 1965 to 2018. At the same time, ξ values tend to increase. These simultaneous trends in the cooperation parameters are the result of food trade networks prioritizing resilience more (recall that
  is in the denominator of ρ and summed in ξ).
3.4. Comparison between unweighted and weighted networks
Here, we perform additional analysis to confirm that differences in our results between unweighted and weighted analysis are not driven by changing the efficiency and resilience metrics. Specifically, we compute the weighted network efficiency  and resilience
  metrics on the same adjacency matrices used in the unweighted analysis. The adjacency matrices are binary, e.g. they include entries of only 0 and 1, indicating whether a trade relationship exists between two nations or not. This means that node out strength (i.e. mass export for nations) becomes node degree (i.e. number of export connections of nations).
Now, the weighted efficiency metric  collapses to the topological efficiency metric,
  . The weighted resilience metric
  , when applied to the adjacency matrices, determines the portion of connections remain after the elimination of the nation with highest number of export connections.
  and
and  for unweighted networks are formulated in equations (10) and (11) respectively, where
  stands for the out degree of node i.
According to the unweighted version of  , networks that have a more homogeneous distribution of export connections would be classified as more resilient. If the majority of export connections is not under the responsibility of a single nation, the food trade network would have multiple major exporters. In case of a local disruption in one of the major exporter nation, the system would still be able to maintain its structure and the majority of its connections. In this case, higher
  values would be computed, indicating higher network resilience.
As it is seen in figure 20(A) in SI, unweighted  values for numerically-generated theoretical and empirical food trade networks increase as density increases. As networks have more connections, multiple nations get more export relations therefore, the portion of all export links on a single major exporter become relatively less important. Therefore, networks get more resilient as they become less dependent on a single major exporter to maintain the structure. However, as in figure 20(B), unweighted
  values decrease as density increases. As density increases, number of connections in the network increases. Hence, average link-based shortest path of the network gets smaller. This means that networks become more efficient, since more direct connections form between any two nation. From (A) and (B) in figure 20, we observe that core-periphery structures have lower
  and lower
  values. Hence, star and scale-free networks are less resilient but more efficient. On the contrary, lattice-like structures have higher
  and higher
  values. So ring and random networks are more resilient but less efficient.
More precisely, we have plotted  vs
vs  for unweighted networks in various densities. As density kept constant, the competition between efficiency and resilience metrics becomes more clear. In figures 20(C), (E) and (G), theoretical and empirical networks with density 0.02, 0.14 and 0.26 are compared respectively. In all density values, star networks have the lowest resilience against the elimination of the major exporter nation. Then, the ascending resilience order follows as scale-free, random and ring networks since higher
  stands for higher resilience. However, the complete opposite ordering is observed when the efficiency metric
  is considered. For all densities, ring networks have the lowest connection efficiency. Then, the ascending efficiency order follows as random, scale-free and star networks since lower
  stands for higher efficiency.
Lastly, we compared unweighted  and
and  metrics to compute the consistency between these two metrics. In figures 20(D), (F) and (H), for network densities of 0.02, 0.14 and 0.26 both the numerically-generated and empirical networks (with close density values) are plotted. Due to the formulation of
  and
and  , higher
  stands for higher resilience while lower
  means higher resilience (see section 2). Therefore, in all figures, both metrics classify lattice-like topologies as more resilient and core-periphery topologies as less resilient. More specifically, ring networks have the highest
  and lowest
  values. Then, it is followed by random, scale-free and star networks where star networks has the lowest
  and highest
  values.
Thus, we conclude that (a) the change in the nature of relationship between resilience and efficiency between unweighted and weighted analyses is not driven by differences in the metrics. By implementing the weighted resilience,  , and efficiency,
  , metrics in unweighted networks, we prove that the competitive relationship still exists. Cooperation is observed when heterogeneous weight distributions are included. This means that our findings are driven by the heterogeneous intensities of food trade, rather than the definitions that we employ to quantify efficiency and resilience in our comprehensive framework. Secondly, we conclude that (b) both resilience metrics
  and
and  gives a consistent understanding for all density values and for all unweighted network topologies. Both metrics assess network resilience in terms of reliance on a single nation for maintaining the network structure, but with different formulations. Both formulations enable us to confirm that lattice-like topologies are more resilient than core-periphery structures against this specific threat. Therefore, the comparison between weighted and unweighted network efficiency and resilience is consistent throughout our study.
4. Concluding remarks
This study presented a comprehensive network framework to evaluate the relationship between efficiency and resilience in global food trade networks. To our knowledge, this is the first integrated assessment of the trade-off between efficiency and resilience that accounts for both topological structure and trade intensities. We include resilience to both spreading risk and targeted node attack in the framework. We provide the potential range of outcomes from numerically-generated theoretical networks to better understand the empirical results. Additionally, we generate null-model statistical networks to benchmark the empirical results.
Increased connectivity of global food trade increases its efficiency at the expense of its resilience to spreading risk, corroborating the findings of Ercsey-Ravasz et al [10]. Yet, we also find that our understanding of the relationship between efficiency and resilience changes depending on the risk considered and when the intensity of trade relationships are explicitly taken into account. Networks can simultaneously promote efficiency and resilience under correlated node degree and weight distribution combinations. Indeed, we find that food trade networks, particularly those of aggregated commodities, promote both efficiency and resilience to the targeted removal of the most important mass exporter nation. This finding is distinct to previous research which suggests that increased connectivity and efficiency necessarily reduces resilience in global food trade networks [24, 76].
This study highlights the importance of explicitly including weights in network analyses of global food trade. Future research could build on this study by developing an economics framework to analyze the relationship between efficiency and resilience in food trade networks. Additionally, the physical travel distances and related costs could be incorporated to enhance realism in the definition of network efficiency. Additional scenarios of production and trade shocks could be explored to determine resilience outcomes. For example, more conservative scenarios could be evaluated, where a fraction of links are removed, rather than the targeted attack and subsequent removal of the major exporter nation. Our statistical approach could be compared with scenarios to determine where they are similar and different. Importantly, a dynamic model with behavioral changes following a disturbance, such as redistribution of trade links, would improve our ability to capture the adaptive responses that may impact resilience.
Acknowledgments
This material is based upon work supported by the National Science Foundation Grant No. ACI-1639529 ('INFEWS/T1: Mesoscale Data Fusion to Map and Model the U.S. Food, Energy, and Water (FEW) System'), EAR-1534544 ('Hazards SEES: Understanding Cross-Scale Interactions of Trade and Food Policy to Improve Resilience to Drought Risk'), and CBET-1844773 ('CAREER: a National Strategy for a Resilient Food Supply Chain'). Any opinions, findings, and conclusions or recommendations expressed in this material are those of the author(s) and do not necessarily reflect the views of the National Science Foundation.
Data availability statement
All data sources are listed in the methods section of the paper and are freely available online in UNCOMTRADE official website, https://comtrade.un.org/data.
Code availability
Code for theoretical networks and metrics generated in this study will be made available upon reasonable request from the corresponding author.