

Abstract
Peatland pole forest is the most carbon-dense ecosystem in Amazonia, but its spatial distribution and species composition are poorly known. To address this knowledge gap, we quantified variation in the floristic composition, peat thickness, and the amount of carbon stored above and below ground of 102 forest plots and 53 transects in northern Peruvian Amazonia. This large dataset includes 571 ground reference points of peat thickness measurements across six ecosystem types. These field data were also used to generate a new land-cover classification based on multiple satellite products using a random forest classification. Peatland pole forests are floristically distinctive and dominated by thin-stemmed woody species such as Pachira nitida (Malvaceae), Platycarpum loretense (Rubiaceae), and Hevea guianensis (Euphorbiaceae). In contrast, palm swamps and open peatlands are dominated by Mauritia flexuosa (Arecaceae). Peatland pole forests have high peat thickness (274 ± 22 cm, mean ± 95% CI, n = 184) similar to open peatlands (282 ± 46 cm, n = 46), but greater than palm swamps (161 ± 17 cm, n = 220) and seasonally-flooded forest, terra firme, and white-sand forest where peat is rare or absent. As a result, peatland pole forest has exceptional carbon density (1,133 ± 93 Mg C ha−1). The new sites expand the known distribution of peatland pole forest by 61% within the Pastaza-Marañón Foreland basin, mainly alongside the Tigre river, to cover a total of 7540 km2 in northern Peruvian Amazonia. However, only 15% of the pole forest area is within a protected area, whilst an additional 26% lies within indigenous territories. The current low levels of protection and forest degradation but high threat from road paving projects makes the Tigre river basin a priority for conservation. The long-term conservation of peatland pole forests has the potential to make a large contribution towards international commitments to mitigate climate change.
Export citation and abstract BibTeX RIS

Original content from this work may be used under the terms of the Creative Commons Attribution 4.0 license. Any further distribution of this work must maintain attribution to the author(s) and the title of the work, journal citation and DOI.
1. Introduction
Peatland pole forest is found on nutrient-poor, ombrotrophic peat domes in Amazonia where it hosts the thickest and oldest known deposits of peat, reaching up to 7.45 m thick and 8900 years old at Aucayacu in the Pastaza-Marañón Foreland basin (PMFB) in the northern Peruvian Amazonia [1]. These thick peat deposits make peatland pole forest the most carbon-dense ecosystem in Amazonia. Only recently described in scientific terms [2, 3], these peatland pole forests have remarkably low tree species diversity, but their distinctive composition makes a significant contribution to the regional floristic diversity [3]. Despite their importance, relatively few data on the carbon density and floristic composition exist for peatland pole forests [1, 2, 4]. Information from just nine forest plots and 32 peat thickness measurements were used with remote sensing data to create the first published map of peatland pole forest in the PMFB [2]. This lack of field sampling generates uncertainty in estimates of the density of carbon stored below ground, the identity of the dominant species and, even more importantly, the geographical extent of the thickest peatlands within the Amazon basin.
Understanding the extent and nature of peatland pole forests is important for designing effective conservation strategies and carbon projects in this region. Beyond their globally-significant role in carbon storage [4], the peatlands of the PMFB in northern Peruvian Amazonia provide natural and cultural resources for local inhabitants and regional urban centres and are therefore of great social and economic importance [5, 6]. The most abundant palm species in Amazonian peatlands, Mauritia flexuosa (locally known as aguaje) also occurs in pole forests; its fruits are the most important non-timber forest product derived from these ecosystems [5]. In terms of biodiversity, peatland pole forest contains species of plants (e.g. Bocageopsis canescens, Platycarpum loretensis) and birds (e.g. Notharchus ordii, Zimmerius villarejoi) that were previously only known from white-sand forest, which is another ecologically distinctive forest type of high conservation value [3, 7]. Peatland pole forests therefore expand the known distribution of rare Amazonian species adapted to low-fertility soil conditions.
Increasing regional and international demand for Mauritia flexuosa fruits is the leading cause of selective harvesting of female fruit-bearing M. flexuosa palm trees. This has adverse impacts on ecosystem integrity and leads to peatland degradation in the PMFB [8–10]. For more than 40 years, these peatlands have been also threatened by oil exploitation, with oil spills directly affecting indigenous and riverine communities [11] by contaminating water and soils [12–14]. In addition, the peatlands in northern Peruvian Amazonia now face new threats due to proposed infrastructure development, which are primarily linked to building new transportation routes including highways, waterways, and an electricity transmission line [15–17]. The potential for significant environmental impacts from these planned projects is high, threatening the integrity and continuity of Amazonia's most carbon-dense ecosystems [15–17].
Although large areas of peatlands in the PMFB are recognized as the internationally important Abanico del Pastaza and Pacaya Samiria Ramsar sites, this designation in itself is insufficient to protect these areas. Rather, supporting the traditional and cultural practices of indigenous communities and the network of protected areas (e.g. Pacaya Samiria national reserve) are viewed as the most effective pathways to protect these forests from deforestation [18, 19]. For example, a carbon-based conservation project in the Datem del Marañón province is supporting sustainable bio-businesses run by indigenous communities and aims to protect the above- and below-ground carbon stores and thus guarantee the contribution of the region to climate change mitigation [15, 16]. More recently, new initiatives by private companies, such as the beverage companies AJE and RAFSAC, are generating increased income for rural communities by promoting sustainable harvest practices for aguaje fruits inside protected areas and selling products made using these resources at a premium price [16]. The hope is that these types of initiatives can prevent land use change in these peatlands, conserve regional carbon stocks and prevent significant releases of green-house gases from conversion and forest degradation [20].
To facilitate and prioritise these efforts, there is a need to improve the knowledge base about the location and extent of the most carbon-dense peatlands across this large region of the PMFB, i.e. the peatland pole forest. Therefore, the aims of our study were to use extensive field sampling to (a) estimate the extent and distribution of pole forests and (b) compare their floristic composition, peat thickness, and carbon density with other forest ecosystem types in northern Peruvian Amazonia. The new insights that emerge can help to preserve the regional carbon stocks and improve the livelihoods of rural communities in the PMFB.
2. Methods
2.1. Study area and field data
The study was carried out across 80 sites of the PMFB, located in the region of Loreto, in northern Peruvian Amazonia (figure 1). Three categories of field data were used (See supplementary material, table S1 (available online at stacks.iop.org/ERL/16/074048/mmedia)): (a) 571 ground reference points for remote sensing classification; (b) 102 forest plots for floristic analysis and biomass estimation; and (c) 217 measurements of carbon content and dry bulk density to quantify soil organic carbon stocks. For all ground reference points, the ecosystem type (OP: open savanna-like peatland, PF: pole forest, PS: palm swamp, SF: seasonally flooded forest, TF: terra firme, and WS: white-sand forest) was assessed following the criteria described in table S2 and peat thickness was measured following the methodology described below. The datasets included 47 sites from previous studies of [1, 2, 4, 21] and 33 new sampling sites from this study established by the MonANPeru network and the Tropical Wetlands Consortium.

Figure 1. Location of the 80 sites (including 33 new sites) studied in the region of Loreto, north-eastern Peru. Sampling sites provided 571 ground reference points of peat thickness and ecosystem types in the Amazon (including Napo, Nanay), Marañón (including Samiria, Huallaga), Tigre (including Corrientes), and Ucayali (including Tapiche) river basins. Circle size represents the number of reference points at each site. Points previously sampled by [1, 2, 4, 21] are shown in dark grey and new reference points collected for this study are shown in red. The Pastaza-Marañón Foreland Basin contains the Abanico del Pastaza and Pacaya Samiria Ramsar sites.
Download figure:
Standard image High-resolution image2.2. Remote sensing imagery
A stack of 11 remote sensing layers was used in the landcover classification model. A cloud free Sentinel 2 (S2) mosaic containing all surface reflectance bands was produced in Google Earth Engine (GEE). Band 11 (swir1) and four indices calculated from the S2 mosaic (normalized difference vegetation index [NDVI], normalized difference water index, red-Edge NDVI, and enhanced vegetation index) were retained in the final version of the model. L-band SAR annual mosaics from the ALOS-PALSAR and ALOS-PALSAR2 sensors for the years 2007–2010 and 2014–2018 (bands HH, HV and HH/HV), and SRTM 30 m digital elevation were directly imported from the GEE repository. Additionally, two satellite-derived products were used: the national map of Peruvian ecosystems [22] and a maximum inundation extent derived from the map of wetland extent at highwater [23]. Further details on the processing of the stack can be found in the supplementary information.
2.3. Landcover classification
A supervised random forest (RF) classification (300 trees, three variables per split) of the Loreto region was undertaken in GEE. We estimated the distribution of eight landcover classes including six ecosystem types (OP, PF, PS, SF, TF, WS), open water (WA), and urban areas/river beaches (UB). For model training and validation, we created a total of 420 polygons based on the 571 ground reference points, as well as additional published polygons [2] and data [24, 25], and unpublished data of known ecosystem types (figure S1). To estimate model accuracy, 50% of the polygons were used to train the RF algorithm while the remaining half were used to validate the model predictions. In the production of the final map and the resulting total areas of each landcover class (figure 2), we used 100% of the ground data for model training. This was done due to the relatively small number of ground reference points. See supplementary information for more details.

Figure 2. Distribution of the classified landcover classes in the region of Loreto, Peru at a resolution of 50 m. Images of peat-forming ecosystems are also included (top left: open peatland, top right: pole forest, bottom: palm swamp).
Download figure:
Standard image High-resolution imageWe estimated the area of each ecosystem type within the protected area network managed by the National Protected Areas Authority (SERNANP) by overlaying the landcover classes with the maps of national, regional and private protected areas and reserved zones [26], as well as with indigenous communities' territories [27].
2.4. Floristic composition and biomass
We assessed the floristic composition and biomass of all individuals with diameter at breast height (dbh at 1.3 m height) ⩾10 cm in the 102 forest plots. Plot size varies from 0.1 to 1 ha (mean = 0.48 ha) with 36 small circular plots (0.1 and 0.2 ha) established on low diversity ecosystem types while rectangular (50 × 100 m) and square (100 × 100 m) plots were preferred in more diverse ecosystems (table S1). Plot establishment and tree measurement followed the standard methods described in the RAINFOR protocol (www.forestplots.net/es/in-the-field) and the data are managed at ForestPlots.net [28], except for 12 forest plots established by [21]. Arborescent palm species were identified in the field and a photograph was taken for species confirmation. Botanical samples of trees were collected for each species and deposited at the Herbarium Herrerense (HH) in Iquitos. All herbarium vouchers were standardised across all forest plots. The dataset included 30 484 individuals of which 3.7% were not collected in the field and were excluded from analyses of floristic composition.
To compare the floristic composition among plots and ecosystem types identified in the field, a floristic distance matrix was constructed using the Bray–Curtis distance for relative abundance data using the 'vegan' package [29] in R [30]. This matrix was used to create non-metric multidimensional scaling (NMDS) ordinations optimized for three axes to visualise floristic dissimilarity among ecosystem types. A non-parametric permutational multivariate analysis of variance (PERMANOVA) was conducted using the Bray–Curtis distance matrix as the response variable to test the significance of the variation in species composition among the six ecosystem types and the four river basins [31]. Dominant species were identified based on their relative abundance and frequency in each vegetation type. For this, the sum of all individuals per species and their frequency of occurrence, i.e. the number of plots that the species occurs in each vegetation type, were calculated and expressed as percentage values.
Above-ground biomass and below-ground biomass of roots were estimated using published allometric equations for trees and palms (table 1) and the measurements of diameter and total height taken in the forest plots. The diameter of all stems was measured using a diameter tape and the total height of palms was measured using a clinometer. In the case of trees, total height was measured to a sample of 2174 stems: ∼50 stems randomly sampled by diameter class in each 0.5 ha and 1 ha plot and the three tallest trees in each 0.1 ha plot (figure S2) and these data were used to develop an equation specific to each ecosystem type in order to estimate the height of all stems (table 1). Tree wood density was obtained from [32, 33] and the dry mass fraction of palms was obtained from [34]. Biomass values expressed as dry weight were converted into megagram per hectare (Mg ha−1) and then to carbon content (Mg C ha−1) using the fraction of 0.47 as the average carbon content of wood in angiosperms [35].
Table 1. Allometric models to estimate total height of trees (H in m) from diameter at breast height (dbh1 in mm) by ecosystem type, and above-ground biomass (AGB in Kg) and below-ground biomass (BGB in Kg) from diameter at breast height (dbh in cm), wood density (ρ in gr cm−3), dry mass fraction (dmf), and total height (H in m) for trees and palms. Reference: Ts, this study.
| Description | Allometric models | No. of stems | R2 | Reference |
|---|---|---|---|---|
| Tree Height a | ||||
| Pole forest | H = 8.19 × ln(dbh1) – 23.20 | 327 | 0.61 | Ts |
| Palm swamp | H = 10.79 × ln(dbh1) – 38.70 | 470 | 0.60 | Ts |
| Seasonally flooded | H = 11.30 × ln(dbh1) – 42.37 | 335 | 0.53 | Ts |
| Terra firme | H = 10.32 × ln(dbh1) – 35.43 | 735 | 0.57 | Ts |
| White sand forest | H = 9.86 × ln(dbh1) – 32.61 | 307 | 0.55 | Ts |
| Tree Biomass (all ecosystems) | ||||
| AGB | AGB = 0.0673 × (ρ × dbh2 × H)0.976 | [51] | ||
| BGB | BGB = 0.489 × AGB0.89 | [52] | ||
| Palm Biomass (all ecosystems) | ||||
| AGB (including H) | ln (AGB) = –3.0883 + 1.0311 × ln(dmf × dbh2 × H) | 105 | 0.88 | [34] |
| AGB (excluding H) | ln (AGB) = –2.0752 + 2.6401 × ln(dbh) + 0.8426 × ln(dmf) | 95 | 0.82 | [34] |
| BGB | BGB = 0.3818 × AGB0.9991 | 34 b | 0.93 | [53] |
a total height of stems was measured using a clinometer (98% of stems) or a laser hypsometer. b includes stems of Mauritia flexuosa as representative of a large palm species (n = 16) and Mauritiella armata as representative of a slender palm species (n = 18).
2.5. Peat sampling
Peat thickness was measured in all 571 reference points using a Russian-type coring device [36] by sampling inside the 102 forest plots and every 200–500 m along 53 1–5 km-long transects (table S1): 206 measurements were previously taken by [1, 4], 107 measurements by [2], 12 by [21], and 246 new measurements were taken as part of this study (figure 1). At each sampling point, the ecosystem type was registered and the coordinates were recorded with a handheld GPS. The base of the peat was identified visually using the Troels-Smith protocol [37]. Peat was identified as partially decomposed, wet, dark brown substrate in a layer at least 30 cm thick. Peat thickness was measured from the surface to the point of the transition between peat and underlying inorganic sediment (pale grey sandy to silty clay), including only pure peat and clayey peat.
Peat cores, taken in 50 cm sections along the peat profile, were analysed for total carbon content and dry bulk density, resulting in 217 measurements (table S1) taken at 13 sites by [1, 4] and ten additional sites by this study in the Tigre river basin using the same method. Laboratory protocols and conditions varied among studies. In this study, the 56 new peat samples were analysed at the University of St Andrews; protocols are provided in the supplementary material (tables S3 and S4).
2.6. Soil organic carbon (SOC)
SOC (Mg C ha−1) was estimated for all 571 measurement points using equations that predict SOC at different peat thickness. The equations were developed using a linear model of the 217 SOC measurements based on dry bulk density and carbon content measured along the profile of the peat cores described above (figure S3). Due to the many zeros recorded in peat thickness for non-peat forming ecosystems, SOC was estimated to a depth of 2 m, by multiplying the above-ground carbon densities of the SF, TF and WS forest plots by 0.824 [38].
3. Results
3.1. Landcover classification
Across Loreto, we estimated a total peatland pole forest area of 7540 km2 and a total potential peat-forming vegetation (i.e. OP, PF, and PS) area of 55 766 km2 (figure 2). The landcover classification produces an overall model accuracy (the sum of correctly classified pixels divided by the total number of pixels across all classes) of 96% and a kappa coefficient (coefficient of agreement accounting for agreement occurring by chance) of 0.95 when tested against an independent dataset. Both producer's and user's accuracy are highly variable across classes, ranging from 63% to 100% and 39% to 100% respectively (table 2). We estimated that 24% of the area of the six ecosystem types is contained in protected areas managed by SERNANP, and an additional 16% is in titled land owned by indigenous communities (table 3). Peatland pole forest is mainly located in land titled to indigenous communities of the Tigre river (e.g. Nueva York, Piura).
Table 2. Random forest (300 trees) classification accuracy matrix (pixels) including producer's (PA) and user's accuracy (UA) at 50 m resolution for the classes: open peatland (OP), pole forest (PF), palm swamp (PS), seasonally flooded (SF), terra firme (TF), white-sand forest (WS), open water (WA), and urban areas/river beaches (UB).
| Reference data | UA (%) | ||||||||||
|---|---|---|---|---|---|---|---|---|---|---|---|
| OP | PF | PS | SF | TF | WS | WA | UB | Total | |||
| Classified data | OP | 1377 | 36 | 5 | 0 | 0 | 0 | 0 | 9 | 1427 | 96.5 |
| PF | 0 | 443 | 40 | 4 | 0 | 0 | 0 | 0 | 487 | 91.0 | |
| PS | 187 | 175 | 812 | 32 | 3 | 1 | 0 | 0 | 1210 | 67.1 | |
| SF | 0 | 47 | 75 | 2305 | 0 | 0 | 0 | 3 | 2430 | 94.9 | |
| TF | 0 | 0 | 1 | 10 | 4716 | 1 | 0 | 5 | 4733 | 99.6 | |
| WS | 0 | 3 | 0 | 37 | 17 | 36 | 0 | 0 | 93 | 38.7 | |
| WA | 0 | 0 | 0 | 14 | 0 | 0 | 4176 | 2 | 4192 | 99.6 | |
| UB | 0 | 0 | 0 | 73 | 1 | 0 | 4 | 6940 | 7018 | 98.9 | |
| Total | 1564 | 704 | 933 | 2475 | 4737 | 38 | 4180 | 6959 | |||
| PA (%) | 88.0 | 62.9 | 87.0 | 93.1 | 99.6 | 94.7 | 99.9 | 99.7 | |||
| Overall accuracy (%): 96.4. Kappa coefficient: 0.95. | |||||||||||
Table 3. Forest structure (dbh, diameter; H, height), abundance (stem density), carbon stored above and below ground, and peat thickness in six ecosystem types of the Loreto region, Peru. Mean values (± 95% CI) are provided for the abundance of stems, above-ground carbon (AGC), below-ground carbon (BGC) and soil organic carbon (SOC) based on 102 forest plots and 571 measurements of peat thickness. The percentage of area within indigenous communities' territories (CCNN) and within the protected area network managed by SERNANP (ANP, national protected areas; ACR, regional protected areas; ACP, private protected areas; ZR, reserved zones).
| Ecosystem | Mean dbh (cm) | Mean H (m) | Abundance (stems ha−1) | AGC (Mg C ha−1) | BGC (Mg C ha−1) | SOC (Mg C ha−1) | Peat thickness (cm) | Area (km2) | CCNN (%) | SERNANP (%) | |||
|---|---|---|---|---|---|---|---|---|---|---|---|---|---|
| ANP | ACR | ACP | ZR | ||||||||||
| Open peatland | 25 ± 4 | NA | 237 ± 119 | 41.26 ± 22.71 | 15.59 ± 8.72 | 628.27 ± 131.85 | 282 ± 46 | 4,888 | 15.7 | 15.8 | 0.2 | 0.0 | 0.0 |
| (n = 3) | (n = 0) | (n = 3) | (n = 3) | (n = 3) | (n = 46) | (n = 46) | |||||||
| Pole forest | 17 ± 1 | 19 ± 3 | 825 ± 128 | 78.24 ± 13.17 | 21.18 ± 3.08 | 1,033.75 ± 91.57 | 274 ± 22 | 7,540 | 26.2 | 13.6 | 1.8 | 0.0 | 0.0 |
| (n = 31) | (n = 23) | (n = 31) | (n = 31) | (n = 31) | (n = 184) | (n = 184) | |||||||
| Palm swamp | 22 ± 1 | 21 ± 2 | 522 ± 53 | 75.61 ± 8.44 | 22.50 ± 2.41 | 647.76 ± 80.37 | 161 ± 17 | 43 338 | 20.1 | 13.7 | 0.3 | 0.0 | 0.1 |
| (n = 34) | (n = 31) | (n = 34) | (n = 34) | (n = 34) | (n = 220) | (n = 220) | |||||||
| Seasonally flooded | 21 ± 1 | 16 ± 0 | 511 ± 58 | 107.84 ± 15.11 | 24.45 ± 2.94 | 192.62 ± 176.76 | 24 ± 13 | 78 933 | 22.8 | 17.7 | 1.6 | 0.0 | 0.4 |
| (n = 17) | (n = 17) | (n = 17) | (n = 17) | (n = 17) | (n = 17) | (n = 103) | |||||||
| Terra firme | 23 ± 3 | 19 ± 1 | 570 ± 34 | 123.52 ± 10.91 | 27.04 ± 3.00 | 101.83 ± 8.99 | 0 | 230 221 | 13.0 | 18.0 | 8.9 | 0.0 | 1.4 |
| (n = 13) | (n = 13) | (n = 13) | (n = 13) | (n = 13) | (n = 13) | (n = 13) | |||||||
| White-sand forest | 18 ± 2 | 18 ± 1 | 783 ± 264 | 111.08 ± 16.90 | 27.14 ± 4.32 | 91.57 ± 13.93 | 0 | 541 | 11.7 | 22.7 | 19.3 | 0.1 | 0.0 |
| (n = 4) | (n = 4) | (n = 4) | (n = 4) | (n = 4) | (n = 4) | (n = 5) | |||||||
| TOTAL | (102 plots) | (88 plots) | (102 plots) | (102 plots) | (102 plots) | (571 points) | 365 461 | 16.2 | 17.3 | 6.1 | 0.0 | 1.0 | |
3.2. Floristic composition and biomass
Overall, the floristic dataset contained 1632 species and morphospecies, of which 460 species were found in peat-forming ecosystems. The floristic composition showed significant variation among ecosystem types (PERMANOVA, p < 0.001; figure 3). Peatland pole forests were dominated, in terms of relative abundance and frequency, by tree species such as Pachira nitida (Malvaceae), Platycarpum loretense (Rubiaceae), and Hevea guianensis (Euphorbiaceae), while the palm species Mauritia flexuosa (Arecaceae) was the most dominant species in palm swamps and open peatlands (figure 4). A more diverse set of species dominated non-peatland ecosystem types.

Figure 3. NMDS ordination plots of the floristic similarity of all 102 forest plots based on tree species abundance data (Bray–Curtis distance) showing (a) axes 1 and 2, and (b) axes 1 and 3.
Download figure:
Standard image High-resolution image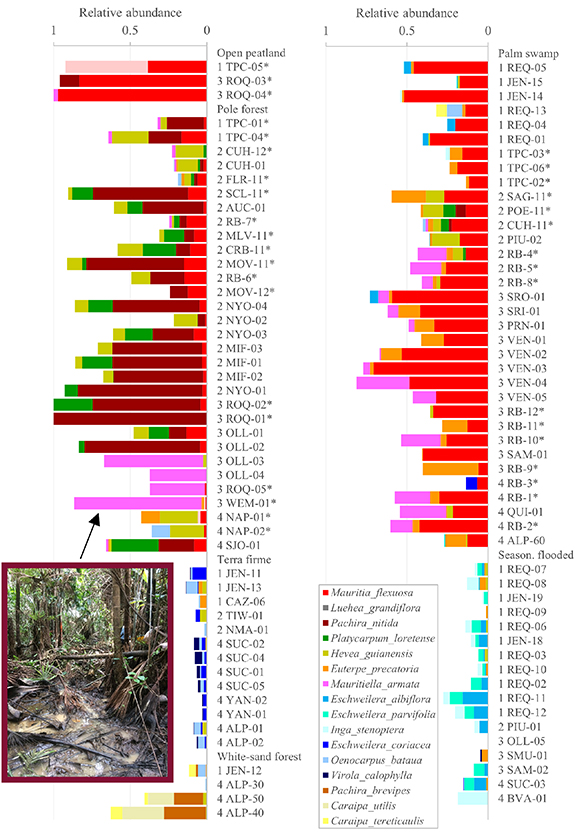
Figure 4. Relative abundance of the most dominant species identified in each ecosystem type for all 102 forest plots. Each plot code (e.g. TPC-05) shows a prefix number for the river basin (1: Ucayali, 2: Tigre, 3: Marañón, 4: Amazon). See tables 4 and S1 in the supplementary material for further information of the plots. 0.1 ha and 0.2 ha plots are indicated with an asterisk.
Download figure:
Standard image High-resolution imagePeatland pole forests were characterized by the high abundance of trees but low abundance of palms, with trees contributing more than palms to above-ground biomass. Trees were also abundant in seasonally flooded forest, terra firme and white-sand forest and made the greatest contribution to above-ground biomass in these three ecosystem types. Palms were more abundant and made the largest contribution to above-ground biomass in open peatlands and palm swamps compared to the other ecosystem types (figure 5). Thin stems were abundant in pole forest and white-sand forest, which both had smaller mean diameter per plot (17–18 cm) than the other ecosystem types (21–25 cm), while mean total height per plot was not different among ecosystem types (table 3).
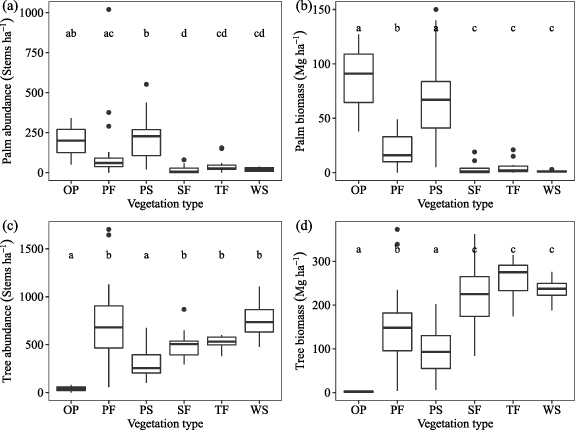
Figure 5. Abundance and above-ground biomass of palms (a), (b) and trees (c), (d) of all 102 forest plots. Ecosystem types: open peatland (OP, n = 3), pole forest (PF, n= 31), palm swamp (PS, n = 34), seasonally flooded forest (SF, n = 17), terra firme (TF, n = 13), white-sand forest (WS, n = 4). To test for significant difference in the abundance and above-ground biomass of trees and palms among ecosystem types, we used Dunn's test of multiple comparisons following a significant Kruskal–Wallis test (all p < 0.001). Non-parametric tests were selected because most datasets were not normally distributed (Shapiro test: most p < 0.001, except for tree biomass p = 0.09).
Download figure:
Standard image High-resolution image3.3. Peat thickness and carbon density
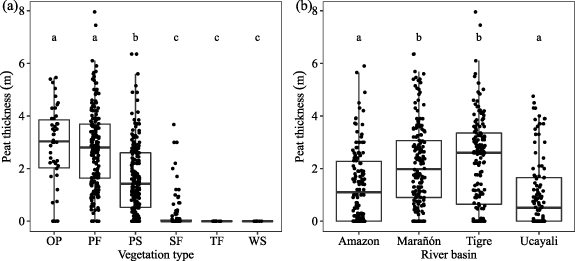
Peatland pole forests have high mean peat thickness (with a mean value ± 95% CI of 274 ± 22 cm) similar to open peatlands (282 ± 46 cm), but higher than palm swamps (161 ± 17 cm) and seasonally flooded forests (24 ± 13 cm). Peat was absent from terra firme and white-sand forests (table 3 and figure 6(a)). Sites in the Marañón and Tigre river basins had significantly greater peat thickness than sites in the Amazon and Ucayali river basins (Kruskal–Wallis, X2 = 54.5, df = 3, p < 0.001; figure 6(b)).Carbon content and bulk density were negatively correlated (Pearson's r = − 0.76, t = −6.71, df = 33, p < 0.001) and showed a high level of variation within each ecosystem type (figure S3).
Figure 6. Peat thickness based on all 571 measurements taken at 102 forest plots and 53 transects grouped by (a) ecosystem type and (b) river basin. Ecosystem type: open peatland (OP, n = 46), pole forest (PF, n = 184), palm swamp (PS, n = 220), seasonally flooded forest (SF, n = 103), terra firme (TF, n = 13), white-sand forest (WS, n = 5). River basin: Amazon (n = 134), Marañón (n = 170), Tigre (n = 156), Ucayali (n = 111). To test for significant difference in the peat thickness among ecosystem types and river basins, we used Dunn's test of multiple comparisons following a significant Kruskal–Wallis test (both p < 0.001).
Download figure:
Standard image High-resolution image
Peatland pole forest stores the greatest total carbon density among the six ecosystem types, with 78.24 ± 13.17 Mg C ha−1 above ground, 21.18 ± 3.08 Mg C ha−1 in roots of living trees and 1033.75 ± 91.57 Mg C ha−1 in the peat (table 3). Average above-ground carbon was found to vary from 41.26 ± 22.71 Mg C ha−1 in open peatlands to 123.52 ± 10.91 in terra firme forest. Peat-forming ecosystem types store on average 80%–95% of the total carbon density below ground, mainly in the peat, while the other ecosystem types store 51%–56% below ground, mainly in the soil.
4. Discussion
4.1. Expanding the distribution of pole forests
Our results suggest that the geographical range of pole forest is substantially greater than previously estimated [2], with a wider distribution along the Tigre river (figure S4) and new scattered areas along the Napo and Tapiche rivers. Across the PMFB, we estimate a total pole forest area of 5942 km2 (table S5), which represents a 61% increase on the 3686 km2 previously estimated [2]. Furthermore, our estimate of total carbon density in peatland pole forest (1133.17 ± 92.56 Mg C ha−1) was the highest among the six ecosystem types of this study.
Peatland pole forest has been poorly classified and mapped in previous studies for two reasons. Firstly, the lack of field data has meant that there has been substantial confusion over the name and nature of this ecosystem type. The term peatland pole forest was introduced in English in 2014 [2, 3] and translated in Spanish as varillal hidromórfico [15, 16]. Other studies referred to this ecosystem type by various names in both English and Spanish, such as forested peatlands [1, 4], varillal de turbera or stunted peatland forest [39], or bosque húmedo de varillal [40]. At a national level, pole forest or varillal hidromórfico was ignored in the 2019 ecosystem map of Peru [22].
Secondly, mapping the distribution of peatland pole forest in satellite imagery is a significant challenge. Our model still had some difficulty in discriminating between pole forest and palm swamp (table 2), which could be caused by a variety of reasons. One likely cause is that most new data used in model training and testing were collected across transects with the aim of crossing various vegetation types. For this reason, we sampled transitional areas located in between two ecosystem types. This highlights an inherent limitation in classifying landcover types which vary continuously along a spectrum, into distinct categories. Both ecosystem types had relatively low accuracy values in our map (table 2), which is likely to be at least in part, due to our limited ground data for these classes (PF: 972 pixels; PS: 1730 pixels) compared to most other ecosystem types (>3000 pixels, except for WS forest with 152 pixels). Additionally, the small stature of the dominant tree species may make pole forests appear similar to white-sand forests in structurally sensitive data (e.g. ALOS PALSAR). However, we observed very few pixels of pole forest misclassified as white-sand forest in the model, and despite relatively few ground data and a low user's accuracy, the distribution of white-sand forests is visually very similar to the distribution observed in the field in previous studies [24, 25, 39]. The lower extent of peatland pole forest estimated by [2] can be at least partially attributed to the lack of ground reference data (17 polygons compared with 52 here). In a preliminary study using PALSAR, Landsat 7 and STRM data, more extensive areas of peatland pole forest were predicted across the PMFB (e.g. ∼16 000 km2; [41]), though it should be noted that this study was based on a more limited set of field data. Additional remote sensing products may offer further improvements in our ability to discriminate pole forests from other ecosystem types. For example, high-resolution satellite imagery such as RapidEye with a resolution of 5 m have been used to successfully discriminate the stunted structure of pole forests at small scales [42].
4.2. Unique floristic composition
Our floristic analysis shows that pole forest sites are floristically distinct from palm swamps and all other ecosystem types of Loreto, consistent with the findings of [3]. Pole forests were usually dominated by thin-stemmed trees of Pachira nitida (Malvaceae), Platycarpum loretense (Rubiaceae), and Hevea guianensis (Euphorbiaceae) in the four river basins. While these three most dominant species occurred in most pole forest plots (figure 4), we observed that other tree species could also be the most abundant species at individual pole forest sites, such as Ilex laureola (Aquifoliaceae) in CUH-12 (22% of stems) and CUH-01 (15%), Iryanthera paradoxa (Myristicaceae) in FLR-11 (19%), Virola duckei (Myristicaceae) in RB-7 (23%) and MLV-11 (18%), Qualea acuminata (Vochysiaceae) in MOV-12 (45%), Sagotia racemosa (Euphorbiaceae) in NYO-02 (18%), Macrolobium GFL5604 (Fabaceae) in OLL-01 (19%). Pole forest plots are found mainly in the Tigre basin and variation in composition may reflect the existence of a diversity of successional pathways that are strongly influenced by priority effects [43]: species that happen to disperse to and establish in the ombrotrophic conditions created by the accumulation of peat during the natural dynamics of these ecosystems may achieve high local abundance. Further studies in the Tigre basin may enable us to understand whether, and to what extent this variation in floristic composition corresponds to changes from/to minerotrophic (river, run-off and ground water fed) to/from ombrotrophic (rain fed) conditions (e.g. [44]).
Pole forest plots had low species diversity as previously reported by [2, 3] and this ecosystem type includes tree species that remain undescribed. For example, a three-foliolate species of the genus Macrolobium (Leguminosae; GFL5604) was surprisingly abundant in the plots and determined as likely new to science. We also corrected the identification of the most abundant species, Pachira nitida, which was previously wrongly identified as Pachira brevipes [3]. Pachira brevipes was only present in white-sand forest plots in this study. Interestingly, palms did not contribute substantially to the abundance of individuals or biomass of pole forests, except for four plots in the Marañón basin (OLL-03, OLL-04, ROQ-05, and WEM-01) where the slender, cespitose palm Mauritiella armata was the most abundant species (figure 4). Mauritiella armata was highly abundant also in one of five swamps studied in Ecuador [45] and common in our plots in palm swamp sites. Due to the absence or rare occurrence of Mauritia flexuosa in these plots, the vegetation classification of these four forest plots remains uncertain.
Previous studies have suggested that some of the pole forest sites in the Tigre basin may be degraded palm swamps, rather than distinctive natural ecosystems [21, 46]. Here, we found no evidence that these peatland pole forests are degraded based on the similar gender ratio of populations of Mauritia flexuosa between peatland pole forests and palm swamps. The gender ratio of M. flexuosa populations is a direct measure of degradation of these ecosystems as cutting female stems of this dioecious palm for fruit harvesting leads to strongly male-skewed populations [8, 10]. The dataset from the Tigre basin (table 4) shows that the mean male to female ratio of M. flexuosa adult individuals in pole forests (mean ± 95% CI: 1.9 ± 0.5; n = 13 sites) is not significantly higher than palm swamps (4.4 ± 3.5; n = 6 sites). Indeed, the highest levels of degradation (indicated by a male:female sex ratio >10) caused by the cutting of female palms during fruit harvesting were recorded in palm swamps in Monteverde and Nueva York in the Tigre basin, rather than the pole forest sites (table 4).Visible hunting trails inside the pole forest plots, rather than cut stems, suggest that hunting is the principal use of these ecosystems. This finding is consistent with a palaeoecological study of the vegetation dynamics in peatlands where the floristic composition of the pole forest represents a natural, late successional stage of a swamp [44]. In this example, pole forest developed around 200 years ago after a 1700 year history as a palm swamp with no indicators of human activity throughout this period. In summary, our results present evidence that peatland pole forests have not been subject to degradation through fruit harvesting. Therefore, studies that label these intact ecosystems as degraded forests are erroneously downplaying their conservation value.
Table 4. Location, characteristics and uses of the 27 forest plots sampled in the Tigre river basin. Forest degradation was estimated as the sex ratio (male/female) of Mauritia flexuosa (Ma.fle) adult individuals sampled at each site. Forest use includes (a) hunting, (b) harvesting of non-timber forest products, (c) trails, and (d) timber extraction. Ts refers to the dataset taken in this study. See table S1 for location of other plots.
| Site | Plot code | Ecosystem | Lat. | Long. | Area (ha) | No. of stems | No. of species | Species b and relative abundance in % | Forest use | Degradation (No. of stems) | Ref. | ||
|---|---|---|---|---|---|---|---|---|---|---|---|---|---|
| Male | Female | Ratio | |||||||||||
| Sanango | SAG-11 | Palm swamp | −3.64 | −74.64 | 0.1 | 52 | 16 | Ma.fle 26.9, Eu.pre 21.2, He.gui 11.5 | 1,3 | 109 | 101 | 1.1 | Ts |
| Puerto Oriente | POE-11 | Palm swamp | −3.74 | −74.65 | 0.1 | 65 | 16 | Ma.flex 13.8, He.gui 12.3, Vi.pav 12.3 | 1,2,3,4 | 132 | 78 | 1.7 | Ts |
| Tiwinza | TIW-01 | Terra firme | −3.74 | −74.43 | 1.0a | 137 | 68 | Po.JRH 5.2, Ps.lae 5.2, Qu.JRH 5.2 | 1,2,3,4 | — | — | — | Ts |
| Cuchara 2 | CUH-01 | Pole forest | −3.77 | −74.80 | 0.5 | 363 | 38 | Il.lau 14.6, He.gui 13.0, Ma.spr 10.2 | 1,3 | 105 | 102 | 1.0 | Ts |
| Florida | FLR-11 | Pole forest | −3.78 | −74.52 | 0.1 | 48 | 22 | Ir.par 18.8, Mi.min 12.5, Vi.duc 8.3 | 1,3 | 109 | 101 | 1.1 | Ts |
| San Carlos | SCL-11 | Pole forest | −3.79 | −74.60 | 0.1 | 75 | 8 | Pa.nit 62.2, Pl.lor 13.5, Ma.fle 12.2 | 1,3 | 112 | 98 | 1.1 | Ts |
| Cuchara 1 | CUH-11 | Palm swamp | −3.81 | −74.81 | 0.1 | 63 | 22 | Ma.fle 22.6, Ma.ang 21.0, Vi.pav 6.5 | 1,3 | 94 | 116 | 0.8 | Ts |
| N. Manchuria | NMA-01 | Terra firme | −3.83 | −74.31 | 1.0 a | 133 | 64 | Es.ova 12.3, Po.gui 9.2, Es.IHC 6.2 | 1,2,3 | — | — | — | Ts |
| Aucayacu | AUC-01 | Pole forest | −3.94 | −74.38 | 0.5 | 431 | 34 | Pa.nit 39.7, Pl.lor 10.0, Fe.chl 8.8 | 1,3 | 74 | 26 | 2.8 | Ts |
| Chanchari | RB-7 | Pole forest | −4.01 | −74.37 | 0.2 | 62 | 23 | Vi.duc 22.3, Ma.fle 13.1, Il.lau 11.5 | — | 2 | 2? | 1.0 | [21] |
| Cristo Rey-Bellavista | CRB-11 | Pole forest | −4.05 | −74.33 | 0.1 | 56 | 11 | Pl.lor 21.8, He.gui 16.4, Vi.duc 16.4 | 1,3 | 130 | 80 | 1.6 | Ts |
| Malvinas | MLV-11 | Pole forest | −4.05 | −74.42 | 0.1 | 61 | 20 | Vi.duc 18.0, Pl.lor 13.1, Ir.par 9.8 | 1,2,3,4 | 167 | 43 | 3.9 | Ts |
| Piura 2 | PIU-02 | Palm swamp | −4.07 | −74.42 | 0.5 | 403 | 61 | Ma.fle 17.5, He.gui 17.0, Vi.pav 12.8 | 4 | 73 | 29 | 2.5 | Ts |
| Piura 1 | PIU-01 | Seasonally flooded | −4.09 | −74.41 | 1.0 | 511 | 102 | Ta.acr 9.4, Ox.rie 6.4, Al.GFL 6.2 | 1,3 | — | — | — | Ts |
| Monteverde 1 | MOV-11 | Pole forest | −4.13 | −74.44 | 0.1 | 80 | 10 | Pa.nit 63.8, Ma.fle 15.0, He.gui 10.0 | 1,2,3 | 129 | 81 | 1.6 | Ts |
| Llanque | RB-4 | Palm swamp | −4.16 | −74.44 | 0.2 | 132 | 26 | Ir.par 20.2, Ma.arm 17.8, Ma.flex 14.0 | — | — | — | — | [21] |
| Monteverde | RB-5 | Palm swamp | −4.17 | −74.42 | 0.2 | 117 | 30 | Ma.fle 26.0, Ma.arm 19.2, Va.gui 10.6 | — | 25 | 0 | >10 | [21] |
| Avispa Cocha | RB-6 | Pole forest | −4.19 | −74.36 | 0.2 | 131 | 14 | Pa.nit 22.3, Ma.fle 14.6, Qu.acu 14.6 | — | 13 | 6 | 2.2 | [21] |
| Monteverde 2 | MOV-12 | Pole forest | −4.19 | −74.36 | 0.1 | 71 | 17 | Qu.acu 45.1, Ma.fle 12.7, Pa.nit 11.3 | 1,2,3 | 102 | 108 | 0.9 | Ts |
| Nueva York | NYO-04 | Pole forest | −4.30 | −74.41 | 0.5 | 864 | 26 | Pa.nit 56.6, Pl.lor 15.8, He.gui 8.8 | 2,3 | 16 | 9 | 1.8 | Ts |
| Nueva York | RB-8 | Palm swamp | −4.35 | −74.29 | 0.2 | 60 | 20 | Ma.fle 29.5, Ma.tam 9.1, Ma.arm 6.8 | — | 9 | 0 | >10 | [21] |
| Nueva York | NYO-02 | Pole forest | −4.39 | −74.27 | 0.5 | 570 | 33 | Sa.rac 18.1, He.gui 15.4, Pa.gui 13.0 | — | — | — | — | [2] |
| Nueva York | NYO-03 | Pole forest | −4.40 | −74.27 | 0.5 | 446 | 30 | Pa.nit 26.7, Pl.lor 17.9, Xy.GFL 13.2 | 2 | 27 | 8 | 3.4 | Ts |
| Miraflores | MIF-01 | Pole forest | −4.41 | −74.06 | 0.5 | 459 | 17 | Pa.nit 58.4, Pl.lor 19.6, Il.lau 5.3 | — | — | — | — | [2] |
| Miraflores | MIF-03 | Pole forest | −4.41 | −74.06 | 0.5 | 537 | 25 | Pa.nit 58.5, He.gui 9.3, Ma.arc 8.6 | 2,3 | 10 | 4 | 2.5 | Ts |
| Miraflores | MIF-02 | Pole forest | −4.41 | −74.07 | 0.5 | 521 | 29 | Pa.nit 58.4, He.gui 6.6, Ma.ang 5.6 | — | — | — | — | [2] |
| Nueva York | NYO-01 | Pole forest | −4.42 | −74.28 | 0.5 | 876 | 15 | Pa.nit 81.3, Pl.lor 8.6, Vo.ven 6.0 | — | — | — | — | [2] |
a Nested plots, dbh ⩾ 30 cm in 1 ha and dbh 10–29.9 cm in 0.1 ha. b Species: (Al.GFL) Alibertia GFL1876, (Es.IHC) Eschweilera IHC5278, (Es.ova) Eschweilera ovalifolia, (Eu.pre) Euterpe precatoria, (Fe.chl) Ferdinandusa chlorantha, (He.gui) Hevea guianensis, (Il.lau) Ilex laureola, (Ir.par) Iryanthera paradoxa, (Ma.spr) Macoubea sprucei, (Ma.ang) Macrolobium angustifolium, (Ma.arc) Macrolobium archeri, (Ma.tam) Malouetia tamaquarina, (Ma.fle) Mauritia flexuosa, (Ma.arm) Mauritiella armata, (Mi.min) Micrandra minor, (Ox.rie) Oxandra riedeliana, (Pa.nit) Pachira nitida, (Pa.gui) Pagamea guianensis, (Pl.lor) Platycarpum loretense, (Po.gui) Pouteria guianensis, (Po.JRH) Pouteria JRH1441, (Ps.lae) Pseudolmedia laevigata, (Qu.acu) Qualea acuminata, (Qu.JRH) Qualea JRH1427, (Sa.rac) Sagotia racemosa, (Ta.acr) Tapura acreana, (Vat.gui) Vatairea guianensis, (Vi.duc) Virola duckei, (Vi.pav) Virola pavonis, (Vo.ven) Vochysia venulosa, (Xy.GFL) Xylopia GFL1848.
4.3. Opportunities for conservation and climate change mitigation projects
The current low level of protection of peatland pole forests—only 15% of pole forest area is within a protected area—represents an opportunity for conservation. In particular, our results demonstrate that the Tigre river basin is a priority for protection due to the presence of extensive pole forests, with low levels of degradation, that store large amounts of carbon. The need to develop effective conservation strategies in the Tigre basin has recently been highlighted by the threats to this region from planned road paving projects to connect Iquitos to the national road network [15–17, 47]. Implementing conservation and sustainable management projects (e.g. M. flexuosa fruit harvesting with the use of climbing equipment to prevent cutting of female palms [48, 49], handicrafts, ecotourism, sustainable fisheries) with the Kichwa indigenous and riverine communities in the Tigre basin is one route for conservation. Such projects should also reinforce the cultural values, knowledge, and traditions of indigenous communities [6, 11]. Promoting sustainable management of resources and avoiding extensive agriculture or ill-planned infrastructure in peatlands is also important for preventing the emission of greenhouse gases from forest degradation and deforestation [16, 20, 50]. All these efforts would contribute to reducing national carbon emissions and could be proposed as activities that will fulfil nationally determined contributions and international commitments to mitigate climate change (e.g. [50]).
5. Conclusion
This study used the largest dataset yet compiled of the floristic composition, carbon density and peat thickness of peatland and associated ecosystem types in the Loreto region of Peru and highlighted the unique floristic composition and thick peat deposits found in peatland pole forests. Our new landcover classification suggests that previous remote sensing studies have significantly underestimated the distribution of the most carbon dense Amazonian ecosystem. The Tigre basin contains large areas of peatland pole forest, and due to current threats, this region should be a priority for conservation. The identification and mapping of this ecosystem type creates opportunities to increase conservation efforts and use traditional indigenous knowledge and national protected areas to protect this important ecosystem.
Acknowledgments
This work was funded by the Wildlife Conservation Society, Gordon and Betty Moore Foundation (Grant #5439, MonANPeru network), NERC (Grant ref. NE/R000751/1), Concytec/British Council/Embajada Británica Lima/Newton Fund (Grant ref. 220-2018), Concytec/NERC/Embajada Británica Lima/Newton Fund (Grant ref. 001-2019), Leverhulme Trust (Grant ref. RPG-2018-306), Scottish Funding Council, and USAID/SWAMP program. We thank SERNANP, SERFOR and GERFOR for providing research permits, and the different indigenous and local communities, research stations and tourist companies for giving consent and allowing access to the forests. We also thank researchers for making available permanent plots for long-term monitoring in Loreto including Roosevelt Garcia, Jim Vega, Massiel Corrales, Darcy Galiano, and acknowledge the invaluable support of technicians (Julio Irarica, Hugo Vasquez, Julio Sanchez, Rider Flores, William Hiles) and field assistants who participated as part of the MonANPeru network and the Tropical Wetlands Consortium.
Data availability
All data that support the findings of this study are included within the article (and any supplementary files). Forest plot dataset was requested through www.forestplots.net [54].