

Abstract
As storm-driven coastal flooding increases under climate change, wetlands such as saltmarshes are held as a nature-based solution. Yet evidence supporting wetlands' storm protection role in estuaries—where both waves and upstream surge drive coastal flooding—remains scarce. Here we address this gap using numerical hydrodynamic models within eight contextually diverse estuaries, simulating storms of varying intensity and coupling flood predictions to damage valuation. Saltmarshes reduced flooding across all studied estuaries and particularly for the largest—100 year—storms, for which they mitigated average flood extents by 35% and damages by 37% ($8.4 M). Across all storm scenarios, wetlands delivered mean annual damage savings of $2.7 M per estuary, exceeding annualised values of better studied wetland services such as carbon storage. Spatial decomposition of processes revealed flood mitigation arose from both localised wave attenuation and estuary-scale surge attenuation, with the latter process dominating: mean flood reductions were 17% in the sheltered top third of estuaries, compared to 8% near wave-exposed estuary mouths. Saltmarshes therefore play a generalised role in mitigating storm flooding and associated costs in estuaries via multi-scale processes. Ecosystem service modelling must integrate processes operating across scales or risk grossly underestimating the value of nature-based solutions to the growing threat of storm-driven coastal flooding.
Export citation and abstract BibTeX RIS

Original content from this work may be used under the terms of the Creative Commons Attribution 4.0 license. Any further distribution of this work must maintain attribution to the author(s) and the title of the work, journal citation and DOI.
1. Introduction
Coastal communities are increasingly vulnerable to flooding [1–4] owing to on-going development in flood risk areas [5–7] and anthropogenic climate change leading to sea level rise and intensifying storms [8–11]. Large storms can raise coastal water levels by more than 5 m above astronomic tidal levels [12], causing extensive coastal flooding [13–15], as exemplified by the devastating impacts of Hurricane Harvey in the USA and Caribbean [14, 16] in 2017, Super Typhoon Haiyan in the Philippines in 2013 [17], and the 2013–14 winter storms in the UK and Europe [18, 19]. Current predictions suggest that by 2100, annual coastal flooding will directly affect up to 5% of the world's population and cost up to 20% of global gross domestic product per year [4, 20]. Although flood risks have traditionally been managed by building seawalls and other hardened defence structures [21–23], the emerging paradigm of nature-based coastal protection holds that resilient, wave- and surge-absorbing wetlands such as saltmarshes and mangroves should be integrated into coastal planning and management to more sustainably and effectively mitigate flood risk and impacts [24–27]. However, quantifying and valuing the contribution of ecosystems to flood mitigation is fraught with uncertainty due to multi-scale interactions between ecological features and hydrodynamic processes [28–31]. In particular, understanding how ecosystems influence flood risk in estuaries—physically complex environments of high socioeconomic significance—remains a pressing and challenging question.
Unlocking our understanding of nature-based coastal protection within estuaries is vital because these environments are particularly at risk of increased storm-driven surge and wave flooding; estuaries often have low-lying adjacent land [7, 32–35], act as an interface between flood waters from coastal surge and riverine flooding [29, 36, 37], and form natural tidal and storm funnels which magnify and transfer surge effects up-stream [36, 38], threatening inland human settlements and infrastructure [39, 40]. Yet despite the enhanced flooding risk in estuaries, natural coastal protection features—such as extensive saltmarshes which typify many estuaries worldwide—can moderate the effects of coastal storms on flooding [25, 30] and potentially offer significant nature based coastal protection services [26, 41]. However, there is a growing urgency to understand how estuarine marshes contribute to coastal flood mitigation, as the combined effects of human-induced pollution, increasing urbanisation and climate change are driving net global losses of these protective coastal wetlands [42–45], and could undermine their ability to perform storm defence functions [46].
Previous studies on open, exposed sections of coastline e.g. [47–49] have shown that saltmarsh vegetation increases hydrodynamic drag [31, 50, 51], locally attenuating waves [47, 48] and surges [49, 52] travelling over marshes towards the shoreline. Yet, in estuaries, upstream surge mitigation—whereby marshes cumulatively attenuate surge over large distances along confined estuary channels—is also likely to act in unison with local processes, mitigating impacts in vulnerable upstream regions [53–55]. Despite evidence of both localised and upstream, estuary-scale, dampening of waves and surge in isolation, there remains a lack of knowledge on how these multi-scale processes interact to holistically reduce flood risk and impacts throughout estuaries (supplementary table S1 (available online at stacks.iop.org/ERL/16/074034/mmedia)) (figure 1). Accordingly, the contributions of saltmarshes to storm flood mitigation may be grossly underestimated and economically undervalued [56, 57].
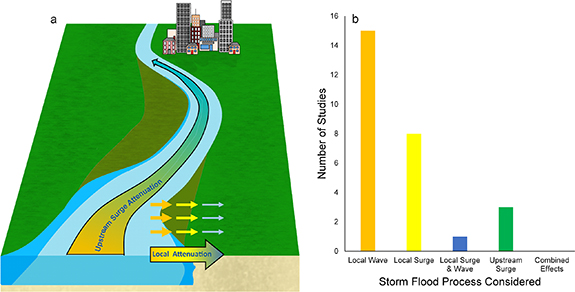
Figure 1. The undervalued role of localised and estuary-scale storm attenuation processes for enhancing storm flood mitigation in estuaries. (a) Marshes provide localised wave and surge attenuation, and estuary-scale cumulative drag as surge moves upstream in estuaries, reducing upstream surge risk. Warmer colours represent higher surge and wave heights, and cooler colours represent lower wave and surge heights. (b) The number of existing studies examining the role of vegetation in reducing flood risk through processes operating at different scales (supplementary table S1). Note the absence of previous studies investigating combined effects (local surge/wave and upstream surge).
Download figure:
Standard image High-resolution imageHere we address the current uncertainty in the role of coastal wetlands in flood mitigation within estuaries by integrating both localised attenuation and estuary-scale processes. Specifically, we investigated the role of marsh vegetation in reducing flooding and flood impacts—at both local and estuary scales—across a range of estuaries which varied in size, morphology, tidal properties, marsh characteristics, and storm exposures, spanning a wide cross-section of comparable global estuary morphologies and environmental contexts [34, 58–60]. We used high-resolution hydrodynamic simulations across eight estuaries, examining how vegetation state and storm intensity affects the degree of protection—both from flooding and resulting economic damages—offered by marshes. Our results demonstrate that saltmarshes play a substantial role in mitigating the effects of storm-driven flooding in estuaries through a combination of localised wave attenuation near estuary mouths, and whole-estuary scale reductions in upstream surge.
2. Results
2.1. Estuary-scale flood mitigation
We first examined the overall role of vegetated saltmarshes in mitigating coastal flooding at the estuary-scale across storm scenarios. Vegetated saltmarshes reduced both the extent and depth of flooding for all estuaries and storm scenarios considered within our study. Ungrazed, vegetated marshes reduced mean terrestrial flood extent by 34.5% (SD ± 24.1), and grazed marshes by 29.1% (SD ± 20.6), compared with unvegetated mudflats (figure 2(a), supplementary table S2). While the mean relative contribution of marshes to flood reduction slightly decreased with increasing storm intensity (supplementary table S2, figure 2(a)), variability between estuaries decreased markedly. Flood water levels were also considerably reduced by vegetated marshes (figure 2(b)), with mean reductions across the storm scenarios of 43.6% (SD ± 23.9) for fully vegetated marshes, and 35.7% (SD ± 22.3) for grazed marshes, compared to unvegetated scenarios. Within estuaries, the proportion of marshes, as well as the vegetation state (vegetated, grazed, unvegetated), played a crucial role in reducing flooding, with estuaries that have a proportionally higher cover of vegetated saltmarsh mitigating both flooding extent and water depth (figure 2(d), supplementary tables S3 and S4).

Figure 2. Vegetated saltmarshes mitigated flooding and economic costs across storm scenarios. The panels show relative flooded area ((a); n = 72), relative flood depth ((b); n = 72) and relative damage cost ((c); n = 72) across storm scenarios where marshes are vegetated (green), grazed (blue) or unvegetated (red). Bars with asterisks denote the unvegetated scenarios for the 1 in 100 year storms which were always proportionally the largest. Central boxplot line represents the mean, boxes the 25th–75th percentile, whiskers the minimum and maximum, and dots represent raw data points. (d) Coefficient plot of drivers of estuary level flood mitigation for flood extents (orange) and flood depth (blue) by (top to bottom): Marsh area percentage (of total estuary area), Marsh vegetation height (grazed or ungrazed), Sinuosity of estuary channel, and Estuary Tidal prism. Points represent estimates, and outer bars a two-standard deviation CI (95%). Negative estimate values represent net benefits, i.e. flood mitigation.
Download figure:
Standard image High-resolution imageAccompanying the reduction in flood extents and depths, vegetated marshes reduced the relative economic costs from damage to residential and commercial properties, infrastructure, and agricultural land, compared with the unvegetated scenarios across all storm events (figure 2(c), table S5). However, unlike the depth and relative flood extents, vegetated marshes drove substantially greater savings in relative flood cost as storm magnitude increased. Under the 100 year return level storm events, where the potential for catastrophic flooding was higher, vegetated marshes reduced flood water depth at the terrestrial boundary leading to fewer banks and defences overtopping, mitigating resulting flooding and economic costs. Notwithstanding the general economic savings observed across estuaries, vegetation drove an increase in flood damage in a single estuary, where vegetation slowed the upstream passage of surge (supplementary figure S1) during a large (100 year) storm, enhancing localised flooding in particularly low-lying land near the estuary mouth.
Savings of damage costs driven by vegetation equated to an average saving per estuary of 37.1% ($8.4 M, SE ± $4.6 M) for single 100 year return level storms, compared to 31.6% ($3.3 M, SE ± $1.9 M) and 20.5% ($1.36 M, SE ± $0.7 M) for single 10 year and annual return-level storms respectively (supplementary table S5). Across all storm scenarios, this equated to mean annualised cost reduction of 37.8% ($2.7 M, SE ± $0.4 M) per estuary (supplementary table S6), and a mean flood protection value of $4772 (SE ± $1285) per hectare, per year. Despite inter-estuary differences in marsh value for flood mitigation, mean reductions in flooding cost compared favourably to other valuable ecosystem services (supplementary table S7).
2.2. Upstream surge mitigation
To investigate the mechanisms underpinning marsh mitigation of coastal flooding, we first examined how marshes modify indicators of upstream storm surge propagation within sequential 1 km estuary sections. Modelled differences in channel current and water levels between the vegetated and unvegetated scenarios showed a clear pattern of greater divergence with increasing distance upstream. Cumulative drag from fringing vegetation weakened upstream surge through net reductions of surge-driven flood currents (figures 3(a)–(c), 4(c) and (d), supplementary table S8), limiting propagation of surge to inner-estuary areas. Accordingly, vegetated marshes also led to faster attenuation of storm-surge water levels with increasing proportional distance upstream (figures 3(d)–(f), supplementary table S9, illustrated in figures 4(a) and (b)). At the same time vegetated marshes amplified surge level close to the estuary mouths, as surge was less able to dissipate by moving upstream. Both phenomena—water level suppression upstream and surge amplification towards the mouth—increased with storm intensity, indicating that the relative contribution of marshes to surge mitigation upstream increases with increasing storm magnitude. In line with the reduction in surge current and water levels, vegetated marshes ultimately more strongly reduced flooding with increasing distance upstream: vegetation drove mean reductions in flood extent by 16.7% in the inner estuary areas, compared to 8% in the outer-estuary areas for large storms (figures 3(g)–(i), supplementary table S10). Grazing of the marshes appeared to have very little effect on storm surge attenuation as indicated by both water level and currents.
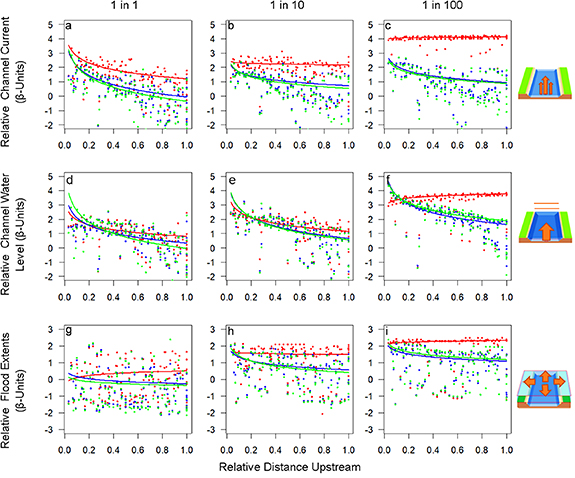
Figure 3. Vegetated saltmarshes reduced current velocities, water level and flood extents, particularly for large storms. Top: mean estuary section flood current relative to the maximum estuary section flood current by the proportional distance upstream for (a) 1 in 1 year storm intensity (n = 404), (b) 1 in 10 year storm intensity (n = 397) and (c) 1 in 100 year storm intensity (n = 404). Centre: mean estuary channel water level relative to the maximum observed, by the proportional distance up-river for (d) 1 in 1 year storm intensity (n = 404), (e) 1 in 10 year storm intensity (n = 397) and (f) 1 in 100 year storm intensity (n = 404). Bottom: flooded area extents relative to the maximum observed, by the proportional distance up-river for (g) 1 in 1 year storm intensity (n = 404), (h), 1 in 10 year storm intensity (n = 397) and (i) 1 in 100 year storm intensity (n = 404). Points represent flood area, water level and velocity model estimates, given in beta-regression standardised values (β-units), and lines represent model fits for vegetated (green) grazed (blue) marshes, as well as where marshes were absent (red).
Download figure:
Standard image High-resolution image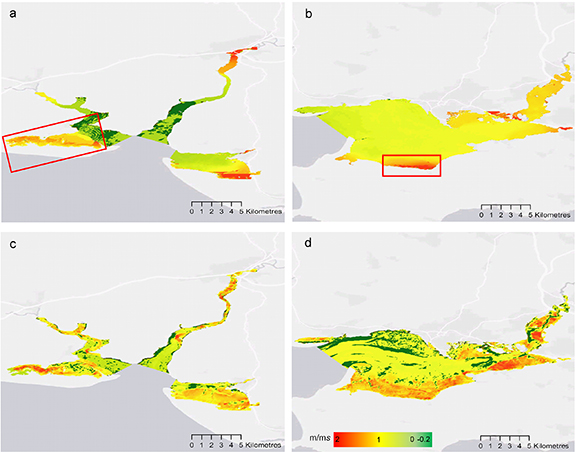
Figure 4. Vegetated saltmarsh reduced water level and flood current velocities in studied estuaries, illustrated with two examples from 1 in 100 year storms. Differences in water level (top) and flood current velocities (bottom) for vegetated marshes in the Three Rivers estuary complex (Taf, Towy, Gwendraeth; (a) and (c)) and Loughor Estuary (b) and (d) compared to where marsh vegetation is absent. Positive values indicate where vegetation reduced water level or current velocity, whereas negative values represent increases in water level or velocity. Red boxes over the water level figures (top) highlight localised flood events driven by wave overtopping, with water level differences represented in meters. For the currents (bottom), localised increases in current velocity in main channels when marsh vegetation is present are represented (dark green), while most of the estuary areas saw velocities slightly decrease (yellow), and over-marsh areas showed larger reductions, up to 1.8 m s−1 (red).
Download figure:
Standard image High-resolution imageWe also noted that the effect of vegetation on surge propagation to up-stream areas responded to estuary size, with marsh vegetation reducing mean relative channel water levels at the limit of tidal intrusion (LTI) more in smaller estuaries (figure 5, supplementary table S11). These scale effects suggest that small estuaries benefit more from surge reduction due to the presence of marsh vegetation than larger estuaries. This effect was independent of the proportion of marsh area within estuaries, and effects on upstream surge water levels were observed for all storm scenarios.
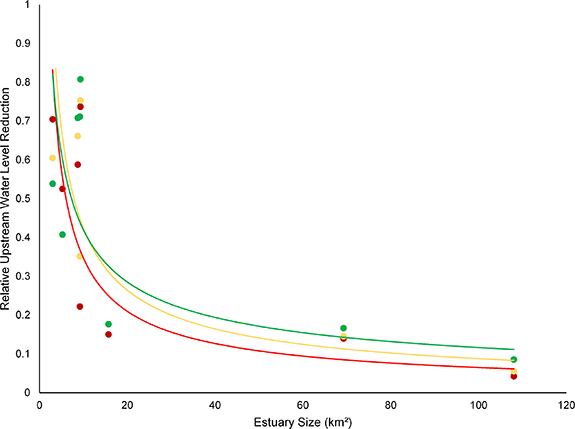
Figure 5. Upstream reduction in surge propagation by vegetated saltmarshes appear to become less important with increasing estuary size, independently of marsh area extent. Proportional reductions in mean storm water levels between the fully vegetated and unvegetated scenarios compared with estuary size (km2) (n = 24). Lines represent model fits for 1 (green points and line), 10 (yellow points and line) and 100 year (red points and line) storm events.
Download figure:
Standard image High-resolution image2.3. Wave and localised surge transformation
In addition to the estuary-scale surge attenuation, we observed vegetated marshes also drove localised decreases in flooding extent and depth, with effects particularly pronounced in wave-exposed outer-estuary areas (see figure 4 for illustration) suggesting an important dual role of wave attenuation. To begin further investigating the mechanisms of storm wave attenuation in our study estuaries, we examined how saltmarshes influence wave heights in the estuary channel. Our focal metric was wave height relative to the maximum observed within an estuary sector to control for differences in absolute wave height across estuaries and with distance upstream (see section 4).
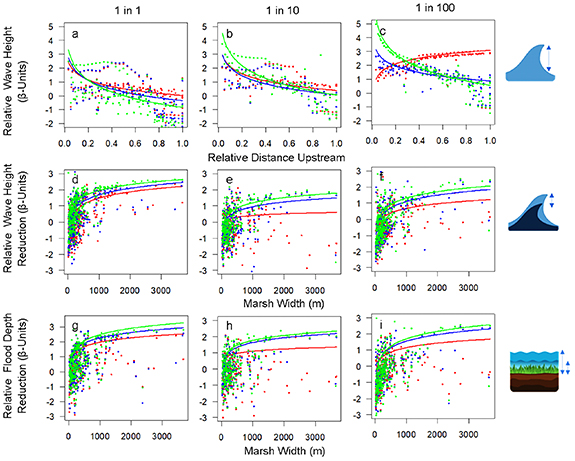
Differences in wave heights as a function of vegetation state increased with proportional up-stream distance and storm intensity, with the effect of vegetation far stronger and more consistent for the 1 in 100 year storm scenario than either 1 in 1 or 1 in 10 year scenarios (figures 6(a)–(c), supplementary table S12). These results indicate that, compared with unvegetated scenarios, vegetated saltmarsh reduced up-stream propagation of waves through estuary channels, particularly under the largest storms. However, vegetated marshes also tended to amplify wave heights in channels towards the estuary mouths for all storm scenarios, increasing water depth over shallow estuary mouth structures and in turn allowing higher energy waves to propagate into estuaries [61, 62]. Yet, at these outer-estuary locations, the aforementioned increases in surge height (figures 3(d)–(f)), as well as these now described amplified wave heights, generally did not translate into increases in terrestrial flooding (figures 3(g)–(i)). Instead, marsh vegetation offset increases in surge and wave height within estuary channels via localised transformation of waves and surge travelling landward over the marshes, ultimately decreasing flooding.
Figure 6. Vegetated saltmarshes reduced wave heights and flood depths at marsh edges, particularly for large storms. Top: wave heights relative to the maximum observed, by the proportional distance upstream for (a) 1 in 1 year storm intensity (n = 404), (b) 1 in 10 year storm intensity (n = 397) and (c) 1 in 100 year storm intensity (n = 404). Centre: relative wave reduction from marsh edge to terrestrial boundary by vegetation across transects for different marsh widths during (d) 1 in 1 year storm intensity (n = 997), (e) 1 in 10 year storm intensity (n = 836) and (f) 1 in 100 year storm intensity (n = 1022). Bottom: relative flood depth reduction at the terrestrial boundary relative to the maximum observed depth, for different marsh widths during (g) 1 in 1 year storm intensity (n = 997), (h) 1 in 10 year storm intensity (n = 836) and (i) 1 in 100 year storm intensity (n = 1022). Points represent area, depth and velocity partial estimates, given in beta-regression standardised values (β-units), and line represent model fits for vegetated (green) and grazed (blue) marshes, and where marsh vegetation is absent (red).
Download figure:
Standard image High-resolution image
Indeed, examination of wave and surge transformation along transects perpendicular to the shoreline revealed vegetated marshes—particularly wide marshes characteristic of the lower-reaches of estuaries—reduced relative wave height and flood depth at the terrestrial boundary and these benefits increased with marsh width (figures 6(d)–(f)). Smaller, narrower marshes also provided local flood reduction benefits through direct attenuation of landward wave and surge but these benefits were more variable, depending on the hydrodynamic and topographical context of their location. Unlike the estuary-scale effects of vegetation on water level and currents, grazing consistently and negatively impacted on marsh ability to attenuate incoming waves (figures 6(d)–(f)) leading to greater flooding adjacent to the marshes, particularly for wide marshes. The relative impact of grazing on wave-attenuation appeared to be most pronounced for smaller storms but was also evident for the larger storms.
3. Discussion
The utility of nature-based coastal flood protection strategies has been extensively supported along open coastlines but remains uncertain within estuarine systems due to the complex, multiscale interactions at play in these socially and economically vital environments. Using high resolution modelling across a set of eight diverse estuaries we reveal the general importance of vegetated saltmarshes—regardless of grazing management—in mitigating flooding and associated economic costs across a range of storm scenarios. Crucially, while our models confirm the local scale wave attenuating effects of saltmarshes, they also reveal a far less quantified or appreciated effect of large-scale flood mitigation via surge attenuation, with benefits magnifying up-stream, under more extreme storm scenarios, and with greater proportion of marsh area within an estuary. Furthermore, beneficial effects of marshes appear strongest within the smallest estuaries. Collectively, our results demonstrate that the role of marsh vegetation is more critical for reducing flood impacts—particularly in small estuaries—than previously assumed.
Our results show that local-scale surge and wave attenuation work together with larger-scale upstream surge attenuation to deliver substantial mitigation of coastal flooding, and subsequent flood damages, under a range of storm scenarios and estuary contexts. We found that, by attenuating waves and surge travelling perpendicular to the shoreline, marshes have the strongest localised dampening effects close to the estuary mouths where marsh widths and wave energy are highest, in-line with previous results from exposed coastlines [48, 52, 63]. However, larger, and more consistent flood extent and water level reductions were observed at wave-sheltered upstream locations. Observed strong and progressive divergence between vegetated and unvegetated scenarios with distance upstream clearly indicates that upstream flood reduction is driven by cumulative estuary-scale surge attenuation, suggesting that vulnerable up-stream human settlements rely heavily on downstream marshes in mitigating surge-driven flooding. Furthermore, the greatest reductions in localised wave attenuation occur across wide marshes, while the strongest large-scale surge attenuation occurs in estuaries with extensive marsh areas, indicating that greater relative marsh area has both local and large-scale flood mitigation benefits. Within estuaries, this interplay between the role of long-distance surge mitigation, and limited local wave and surge reduction in our study adds to previous work emphasising direct local wave- and surge- attenuation along exposed coastlines e.g. [53, 64, 65], to reveal the under-appreciated role of marshes within typically wave-sheltered small estuaries. Furthermore, within the size ranges of estuaries (3–108 km2) in our study, the role of marsh vegetation in attenuating upstream surge was stronger in the smallest estuaries, consistent with previous evidence of scale-dependence of surge mitigation along creeks [54], as well as theoretical work on the morphology and configuration of estuary channels [66–68], and is supported by smaller surge reductions observed in the much larger Scheldt estuary [69](∼370 km2). The extension of the coastal protection paradigm to estuaries, and the suggestion these services may be even stronger in the smallest estuaries, is globally significant because small to medium sized estuaries are most common across many countries [34, 58–60, 70] while also being particularly vulnerable to amplification of surges driven by sea level rise [38, 71].
Marsh mitigation of storm flooding has accompanying economic benefits, reducing flood damage costs by an average of 37% for large storms across the estuaries within our study. Savings from ungrazed and grazed marsh vegetation scaled exponentially with storm intensity, with the relative marsh-driven cost savings considerably higher than the 1%–16% savings previously predicted for similar significant tropical storms along open coastlines dominated by extensive fringing or back-barrier marshes [41, 57, 72]. The estimated absolute per-hectare flood damage savings within estuaries are similar to those previously estimated for hurricane-exposed US coastlines [73, 74] despite typically lower asset flood exposure in our study area, and were considerably greater than the value of other saltmarsh services such as carbon storage [75, 76] or livestock grazing [77, 78]. Indeed, in our study average flood mitigation from marshes—per hectare per year—was valued at between 22 and 75 times that of carbon storage, and 117 times that of grazing (supplementary table S7). Furthermore, these high flood mitigation service values were consistently observed across seven of the eight estuary case studies, despite inter-estuary variability. Accordingly, our new estimates serve as a tool to generate greater public and policy-maker recognition of the nature-based flood mitigation services in these deceptively sheltered environments, and substantially enhances the economic case for saltmarsh conservation and restoration. Even so, as our reported estimates relate exclusively to flood mitigation, they will underestimate the total value of marshes for coastal protection, including the role of vegetation in reducing shoreline erosion [79, 80], and maintaining wave and surge attenuating raised marsh platforms [26]. In our study, flood-mitigation economic benefits of marshes can be considered general, with vegetation driven reductions in flood cost occurring in seven of the eight estuaries, but not universal: in one heavily modified estuary, extensive high-crested channelisation prevented flooding upstream while vegetation enhanced surge water levels in downstream, densely populated areas, leading to a modest increase in flood damages when vegetation was present. Yet despite this inevitable context dependency, arising from interactions between physical, ecological and anthropogenic features, we find strong evidence for general patterns of marsh-driven reductions in economic costs from storm flood events.
Our results have important implications for marsh management for ecosystem services. Previous valuation and ecosystem service mapping approaches have considered the more direct effects of marshes on coastal protection—emphasising marshes in wave-exposed locations and fronting valuable infrastructure [56, 81, 82]. Clearly, it is vital that tools used for valuation of coastal protection services evolve to include the dominant process of long-distance surge mitigation, in addition to the better integrated direct contributions of marshes and other coastal systems to flood mitigation. Accordingly, marsh conservation and restoration must be treated at the whole estuary scale, with an understanding that marshes in highly wave-sheltered locations, or fronting areas with low flood vulnerability, may still be providing essential flood mitigation services further upstream. Our findings, from a diverse set of environmental and estuarine contexts, suggest that these estuary-scale effects are broadly applicable, although further studies may be needed to support our conclusions in less common estuary types which we did not examine in our study: particularly in large delta, coastal plain, or back-barrier estuaries, alter the contributions of marsh vegetation to flood mitigation. Importantly, our results suggest that marshes can be managed for multiple benefits, with grazing generally having only small influences on wave attenuation and surge mitigation—indicating that maintaining or enhancing marsh extent, rather than grazing pressure, should be a priority for flood mitigation management. Looking ahead, as climate change is predicted to bring increasing frequencies [3], and magnitudes [10, 14, 83] of large storms, with current 1 in 100 year storm water level events expected annually by 2100 [84], our results indicate that appropriate valuation and effective management of marshes is paramount to mitigate rising risks of flooding and its social and economic impacts.
In conclusion, our study demonstrates that coastal wetlands strongly reduce storm flooding and its economic consequences through both local and estuary-scale processes. Our research demonstrates that current valuation tools based on local-scale interactions oversimplify and underestimate contributions by coastal marshes to flood mitigation in estuaries where storm flooding threatens homes, industry, and infrastructure. Furthermore, we show that marshes mitigate flooding across a range of estuarine and environmental contexts, suggesting that our results will also apply to many other estuaries worldwide. Ecosystem service modelling and decision making in estuarine socio-ecological systems must now move towards integrating multi-scale processes or risk underestimating the value of wetlands and their conservation for protecting communities in the face of rising flood risk.
4. Methods
4.1. Site characteristics
To investigate the role of saltmarsh vegetation in reducing storm flood risk we examine eight case study estuaries along the coast of Wales, UK (supplementary figure S5) which explicitly differed in their size, morphology, marsh extents and exposure to storm events, reflecting the inherent morphological and environmental variability of estuaries [34, 58–60, 70, 85]. The selected estuaries represented a broad range of characteristics to examine the generality of vegetation effects within estuaries: across large tidal range gradients (from mesotidal estuaries with ranges of ∼3 m, up to large macrotidal >10 m ranges), wave exposure driven by wind fetch (<100 km to >1000 km), and estuary sizes (3 km2 to >100 km2) and types. While not exhaustive, the environmental and topographical variation across our case-study estuaries broadly represent the properties of many common small-to medium sized estuaries which are described in the literature [59, 60, 86]. These differences, and differences in prevailing conditions, allowed us to explore the role marshes play irrespective of environmental context, and investigate potential interactions between marsh vegetation and estuary characteristics in moderating flooding. The properties of each estuary are summarised in table 1.
Table 1. Summary of the properties of estuaries used in this study.
| Estuary | Estuary area | Estuary tidal prism (m3) a | Tidal range (m) b | Estuary type c | Estuary orientation d | Estuary sinuosity e | Saltmarsh % f | |
|---|---|---|---|---|---|---|---|---|
| 1 | Neath | 3.00 km2 | 15 050 000 | 10.3 | Ria | 45° | 1.264 | 30.3% |
| 2 | Loughor | 69.25 km2 | 244 879 000 | 9.7 | Coastal Plain | 47° | 1.506 | 31.6% |
| 3 | Gwendraeth | 8.71 km2 | 14 874 000 | 8.9 | Bar built | 98° | 1.288 | 69.0% |
| 4 | Towy | 9.33 km2 | 23 378 000 | 8.9 | Coastal Plain | 9° | 1.325 | 26.3% |
| 5 | Taf | 9.20 km2 | 14 840 000 | 8.9 | Coastal Plain | 308° | 1.444 | 36.5% |
| 6 | Mawddach | 5.22 km2 | 10 707 000 | 5.8 | Bar Built | 60° | 1.361 | 41.0% |
| 7 | Glaslyn | 15.70 km2 | 37 554 000 | 5.3 | Bar Built | 39° | 1.343 | 22.2% |
| 8 | Dee | 108.21 km2 | 576 536 000 | 3.5 | Coastal Plain | 136° | 1.158 | 19.5% |
a Tidal prism measured from hydrodynamic tidal models as the difference in water volume between MHWS and MLWS within estuary boundaries. b Tidal range data from UK Hydrographic Office (UKHO). c Estuary type data from enhanced FutureCoast project (UK Department for Environment, Food and Rural Affairs [DEFRA]) data [86]. d Measured orientation of estuary mouths, from Google Earth tools. e Estuary sinuosity measured using QGIS after the methodology of Schumm [87]. f Saltmarsh area calculated from data from Natural Resources Wales, under Open Government licence—Available at http://lle.gov.wales/catalogue/item/SaltmarshExtents.
4.2. Experimental design
For each of the case-study estuaries we used high-resolution hydrodynamic models to investigate how marsh vegetation state changes estuary hydrodynamics and resulting simulated flooding. We created online coupled Delft3D FLOW and WAVE (SWAN Cycle III 41.31) models [88], incorporating the effect of vegetation using a ridged cylinders approach [89] (Delft/SWAN-VEG) on both waves and flow. This approach has been successfully applied in recent numerical modelling studies which include vegetation [90, 91], and has been found to be more consistent across contexts than fixed Manning's n friction approaches [92]. The hydrodynamic processes within Delft3D were calculated using a 2-dimensional depth-averaged form of the unsteady shallow water equations [93] which has been extensively utilised and validated across a variety of applications and timescales [94–96], including for investigating the role of saltmarsh systems [90, 91].
Models were run on high resolution structured grids. Offshore areas were typically represented as 150 × 50 m grids, and grid sizes became progressively smaller towards the estuary mouth and the upstream areas. Grids within estuary boundaries were high resolution and uniform, with 10 × 10 m cell sizes giving good resolution to resolve hydrodynamics in up-stream river channels and marsh creeks. The model domain extended into the terrestrial zone to 3 m elevation above the height of the terrestrial-estuary boundary to characterise terrestrial flood extents and depths. Models were validated using a combination of tidal gauge (British Oceanographic Data Centre) and HOBO Depth logger (U20L) data deployed in each estuary group, and performed well against observed water levels in estuaries (see supplementary validation section—3.2.4—for additional information).
We used three different vegetation states: an unvegetated reference state, an undisturbed fully vegetated state where marsh platforms were fully populated with climax marsh communities, and a Grazed state where vegetation height was reduced to a uniform 8 cm in line with field observations. Marsh vegetation properties were specified using community weighted means of plant trait data from vegetation surveys carried out as part of the CoastWEB project [31, 90] (supplementary table S15).
We also investigated how storm magnitude may change the relationship between vegetation and flood mitigation, as previous studies have indicated that vegetation may become less effective at attenuating energy with increased water levels from surge during larger storms [47], and larger storms are more frequently associated with significant flood events [23, 97, 98]. We used three storm events with increasing magnitudes; an annually expected 1 in 1 year storm event, a 1 in 10 year storm event, and a 1 in 100 year event. These storm events were constructed and calibrated by fitting observed surge [99], wave (Centre for Environment Fisheries & Aquaculture Science), United Kingdom wave hindcast dataset), wind (Met Office, UK) and river flow data (Natural Resources Wales) using a generalised pareto distribution [100] to determine significant storm conditions corresponding to each of the return periods.
To understand the roles and potential interactions of vegetation and storms, we used a fully crossed factorial design, co-varying the vegetation state and storm magnitude over the 8 estuaries, creating 72 individual scenarios. We suspected that in estuaries, flood risk would be dictated by different processes operating at different spatial scales, and so we analysed depths, flood extents, current velocities and significant wave heights for each estuary and scenario at three different spatial grains; local (transect level), segment (1 km segments) and whole estuary levels.
Previous studies have indicated that over-marsh transformation of waves and surge is the most important pathway for reducing flooding in open-coastline systems [26, 49, 63]. To assess whether this also applies in estuarine environments we employed transect sampling to look at wave and surge transformation across individual marshes to examine the importance of marsh vegetation for preventing flooding from local wave and surge overtopping of banks and defences. Transects were created in QGIS and were mapped onto model output data at 250 m intervals, and sampling points were equally spaced at 10 m intervals from the marsh/channel edge until the terrestrial boundary. At each transect point we measured maximum water level, significant wave height and current velocity. From this data, we then examined the total reduction and proportional reduction in water level and wave height driven by the vegetation from the channel to terrestrial boundary as an indicator of the effectiveness of marshes in reducing local storm flooding.
We also suspected that vegetation may play a wider role in estuaries, creating a cumulative drag effect at the estuary scale which could reduce flood extents further upstream [69]. To investigate whether cumulative drag had a strong effect on flood potential, we decomposed the model outputs into 1 km sections along main estuary channels, and measured averaged peak current velocity, averaged peak water level, and averaged peak significant wave height within the estuary area sections, and flood extents and depths in adjacent terrestrial areas using zonal statistics. These 1 km sections extended from the estuary/coastal boundary, up until the LTI. Because of the high degree of variability in absolute area and topography within estuaries, we calculated flood extents, water levels and depth within each block as a proportion of the maximum observed flood extent, levels or depth respectively within each estuary to look at the relative role of marsh vegetation independent of estuary context. We also applied this to the distance of sections upstream, as the estuaries varied considerably in length, with distance being represented as a proportion of distance of each section upstream from the estuary mouth (0) to the LTI (1). At the whole estuary level, we quantified average peak water level, mean peak current velocity (flood and ebb) and mean peak significant wave height using zonal statistics within the boundaries of the whole estuary. Additional information on model specification is available in the supplementary materials (sections 3.1–3.2).
4.3. Economic analysis
In addition to examining the hydrodynamic consequences of vegetation, we assessed the economic costs associated with flood events based on the extents and depths of flood waters from the hydrodynamic models. We compared the flood damages experienced in each estuary when marshes have no vegetation to those with full or grazed vegetation, and for different storm return levels (1 in 1, 1 in 10, 1 in 100 year). Our calculations aggregated flood damage estimates for residential, commercial, industrial and agricultural properties, as well as to public buildings and water and electricity utility installations using flood cost estimates for saltwater inundation damages (to building fabric, household inventory and domestic clean-up) from cost tables in the 2018 update of the multi-coloured manual (MCM) [101]. Properties in at-risk areas were identified using OS Mastermap layers [102], assigned a building type (e.g. terraced, detached, retail properties etc) and property age using a systematic visual assessment in Google StreetView©, and segmented by neighbourhood for socioeconomic status (UK Census Data [103]) to calculate economic cost values (in GBP(£)).
We also accounted for losses in agricultural output on flooded farmland, flosses from disruption to travel arising from flooded roads, and from restrictions in outdoor recreation activity resulting from the flooding of parks and countryside paths. Roads were identified using the Ordinance Survey Integrated Transport Network [104] data layer, and assigned a value for the average number of vehicles using them per hour from Department for Transport road traffic statistics data (DfT, 2020 [105]). To calculate economic costs from flooding we applied a 'diversion-value method' [101], whereby vehicles were assumed to have to divert to avoid flooding. For the sake of simplicity, we assumed that diversion to extend the journey by a distance equal to the length of road made impassable by the flood water for a period of 12 h. Travel disruption costs were then calculated by multiplying the costs per kilometre of additional travel—provided in the MCM cost tables [101]—by the number of vehicles affected during the flooding event. Estimates of flood losses arising in agriculture and outdoor recreation activity were also calculated, following established repair and disruption values in the Green Book (Central government guidance on appraisal and evaluation) [106].
We calculated absolute flood damage costs for single storms for each return-level event, as well as an annualised cost based on the net present value [101], and these values (in £GBP) were subsequently converted into $USD (at exchange rate of USD$1.36 to GBP£1; 20 December 2020). As the exposure of assets varied between estuaries, we also recalculated these absolute values as proportional reductions, comparing the cost for each scenario with the maximum observed flood cost for each estuary. This allowed us to compare the relative flood protection value of marshes across estuaries, independently of population density and asset exposure. Further details on the economic analysis are available in the supplementary materials (section 3.3)
4.4. Statistical analysis
Analysis of model outputs was conducted in the R statistical computing environment [107]. To analyse relative extent, water level and wave reduction (relative flood effects) data (proportional data) we employed mixed effects beta regression models using the glmmTMB package [108] with the estuary as a random factor to account for unquantified environmental differences in prevailing conditions between estuaries. We assessed effects of a range of different predictors on flood effects at three different scales: transect level (within marshes), up-stream zone, and whole estuary level. The proportional upstream distance and marsh width predictors were log10 transformed—at the estuary scale and marsh transect levels respectively—to account for non-linearity, and model diagnostics performed to ensure adequate model fit. Results were then visualised using the GGplot2 [109], Coefplot [110] and Visreg [111] packages.
Acknowledgments
The authors would like to thank the members of the CoastWEB team for their support and feedback, Davide de Battisti and Thomas J van Veelen for their valuable field assistance, as well as the anonymous reviewers that helped improve this manuscript. This research formed part of the Valuing Nature Programme (valuing-nature.net) which is funded by the Natural Environment Research Council, the Economic and Social Research Council, the Biotechnology and Biological Sciences Research Council, the Arts and Humanities Research Council and the Department of the Environment, Food and Rural Affairs. This research was supported by the UK Research Councils under Natural Environment Research Council award NE/N013573/1, Title CoastWEB: Valuing the contribution which COASTal habitats make to human health and WEllBeing, with a focus on the alleviation of natural hazards.
Data availability statement
The data that support the findings of this study are openly available at the following URL/DOI:https://doi.org/10.6084/m9.figshare.c.5461350.
Conflict of interest
The authors declare that they have no known competing financial interests or personal relationships that could have appeared to influence the work reported in this paper.
Author contributions
TF and JG conceptualised the study, with input from HK, WB, NB, IM, MS, BD and GS. Experimental design was led by TF, with input from JG, HK, and WB, and hydrodynamic modelling was undertaken by TF with the assistance of WB. Analysis of model outputs was led by TF, with input from JG. TF undertook field sampling for vegetation and validation data. Economic modelling was led by BD and GS, with input from TF and JG. TF and JG led the writing of the manuscript, with input from all co-authors.