

Abstract
Extreme precipitation and winds can have a severe impact on society, particularly when they occur at the same place and time. In this study the Met Office's Global Seasonal forecast system version 5 (GloSea5) model ensembles are evaluated against the reanalysis dataset ERA5, to find out how well they represent three hourly extreme precipitation, extreme wind and extreme co-occurring events over Europe. Although substantial differences in magnitude are found between precipitation and wind extremes between the datasets, the conditional probability of exceedance above the 99th percentile, which measures the co-occurrence between the two extremes, compares well spatially over Europe. However, significant differences in frequency are found around and over some areas of high topography. Generally GloSea5 underestimates this co-occurrence over sea. The model's co-occurring events at individual locations investigated occur with very similar synoptic patterns to ERA5, indicating that the compound extremes are produced for the correct reasons.
Export citation and abstract BibTeX RIS

Original content from this work may be used under the terms of the Creative Commons Attribution 4.0 license. Any further distribution of this work must maintain attribution to the author(s) and the title of the work, journal citation and DOI.
1. Introduction
Extreme precipitation and winds can have a severe impact on society and the co-occurrence between the two extremes is important when assessing risk, since together they can cause even greater damage than separately (Raveh-Rubin and Wernli 2015, Martius et al 2016). The co-occurrence of precipitation and wind extremes has been studied over Europe at varying temporal scales using observational data (Martius et al 2016, Ridder et al 2020, Vignotto et al 2021). The spatial pattern of co-occurrence frequency is complex but is consistent between studies, with high co-occurrence found over Europe's western coasts, the north eastern coast of the Mediterranean and south of the Alps. Co-occurring extreme precipitation and wind events are linked to locations with a high frequency of atmospheric rivers and extratropical cyclones (Pfahl 2014, Raveh-Rubin and Wernli 2015, 2016, De Luca et al 2017, 2020, Owen et al 2020, Catto and Dowdy 2021, Hénin et al 2021), and the probability of getting such events is much higher when cyclones and fronts are present (Catto and Dowdy 2021). These results indicate that these weather systems are the common drivers of the two extremes.
Given the high impact of co-occurring extreme events, it is vital that climate models, including seasonal forecasting models, can represent extreme precipitation and wind. Such models are an important tool in understanding future changes in high impact weather and climate events. Studies have evaluated extreme wind and precipitation separately in models (Kumar et al 2015, Wehner et al 2021), and have also evaluated model ability to represent extratropical cyclones and fronts (Catto et al 2010, Zappa et al 2013, Priestley et al 2020). These results typically find that higher resolution models represent the structure and intensity of extratropical cyclones better.
Few studies have evaluated compound events in climate models. Recently Ridder et al (2021) found that some of the sixth phase of the Coupled Model Intercomparison Project (CMIP6) models capture the return periods of both co-occurring daily precipitation and wind extremes as well as heat waves and meteorological drought well over North America, Europe and Eurasia but perform less well over Australia. The models considered had horizontal resolution of typically coarser than ∼100 km. Considering much higher resolution simulations, Zscheischler et al (2021) found that simulations from the Weather Research and Forecasting (WRF) model, run at 2 km resolution, captured daily precipitation and wind extremes well over a region in central Europe around the Alps.
Another use for models that can represent rare but high impact events, is to better understand the present day risk of such events. Due to the rarity of co-occurring extremes, observational estimates of the frequency of very extreme events can be uncertain. Additionally, it is very difficult for estimates based on observations alone to help us understand the risk of future rare or unprecedented events. However, using the UNSEEN method (unprecedented simulated extremes using ensembles) this risk can be estimated from large ensembles of climate simulations. The Met Office's Hadley Centre Global Environment Model (HadGEM3-GC2) has been evaluated and used to investigate unprecedented events (Kent et al 2017, 2019, Thompson et al 2017, 2019). Precipitation and temperature in HadGEM3-GC2 were found to be statistically indistinguishable from observational datasets in Kent et al (2019) and Thompson et al (2017, 2019). The results from these demonstrate the potential of the UNSEEN methodology to quantify the chance of unprecedented events and understand their causes. However, to date the model has not been evaluated for its ability to represent co-occurring extremes and the dynamical drivers of these events, such as extratropical cyclones.
The aim of this study is to find out how well the Met Office's Global Seasonal forecast system version 5 (GloSea5) model ensembles, which are based on HadGEM3-GC2, represent three hourly co-occurring extreme precipitation and wind events and the synoptic situations leading to them by comparing the model ensembles with the reanalysis dataset, ERA5. This is a very stringent test of the model as the correct representation depends on how well it represents synoptic scale dynamical features that drive the extremes, as well as the subgrid-scale features such as extreme precipitation. In contrast to previous studies we investigate a larger region over Europe with a higher horizontal (25 km) and temporal (three hourly) resolution (Ridder et al 2021, Zscheischler et al 2021). Additionally GloSea5 has not been evaluated in such a way before and is needed before the model can be used to calculate unprecedented events using the UNSEEN method. The following questions are addressed:
- (a)How well does GloSea5 represent the spatial pattern and magnitude of three hourly extreme wind and precipitation?
- (b)How well does GloSea5 represent the spatial pattern and frequency of three hourly co-occurring extreme wind and precipitation?
- (c)Can GloSea5 represent the correct synoptic situations leading to three hourly co-occurring extreme events?
2. Data and methodology
2.1. Data
The GloSea5 from the UK Met Office is an 'experimental' high resolution version of the climate model HadGEM3, with a resolution of 25 km. For details of the model setup we refer the reader to MacLachlan et al (2015). Note that here we use the high horizontal resolution version of GloSea5 for details of this we refer the reader to Scaife et al (2019). We use the three hourly total precipitation and 10 m mean wind speed for the extreme events, and three hourly mean sea level pressure (MSLP) for investigating the synoptic patterns. GloSea5 is an ensemble forecast system with three start dates per season (25 October, 1 and 11 November) and eight ensemble members per start date. Each ensemble member runs for 210 days for 24 seasons. We generate 24 timeseries for 1993–2016 by drawing from each of the ensemble members. We also generate 100 timeseries from a random selection of ensemble members using a bootstrapping method which are used in figure 4.
The observationally constrained data against which we evaluate the model is three hourly total precipitation accumulation, 10 m mean wind speed and MSLP from the European Centre for Medium-range Weather Forecasts ERA5 reanalysis dataset (Hersbach et al 2020). ERA5 is a global dataset with spatial resolution of 31 km and is taken as a good representation of 'real life'. Owen et al (2020) checked the robustness of ERA5 against observational datasets and found it compared well spatially and represented the timings of daily extreme co-occurring events well. Although ERA5 did overestimate the frequency of co-occurrence over high topography .
We focus on the winter season, December to February (DJF), of 1993–2016 and the region of 20∘ W–40∘ E and 30∘ S–75∘ N to investigate Europe. GloSea5 is regridded to a spatial resolution of 31 km to match ERA5, using first order conservative mapping.
We use three hourly data because this is the highest temporal resolution from GloSea5 and hourly extremes are of most interest when investigating the impact of wind speed. Given that we are considering such a special case of three hourly extremes with no relaxation, this is a very stringent test of the model. Furthermore Owen et al (2020) found that a 24 hour lag and lead causes no/very little change in co-occurring precipitation and wind extremes for most of Europe. Additionally, we investigated the longer timescale of 24 hourly extremes where a compound event is found if the daily mean wind speed mean and the daily precipitation accumulation are both extreme, similar to Martius et al (2016), Ridder et al (2020, 2021). The results of these are mentioned but not shown.
2.2. Definition of extremes
Precipitation and wind speed above the 99th percentile for each gridpoint, for DJF, are taken as extreme. All events have been included in our dataset including zero precipitation events. The 99th percentile has often been used to define extreme precipitation (Pfahl and Wernli 2012, Catto and Pfahl 2013) and wind (Pfahl 2014), and is used throughout this study. Other thresholds are also investigated for locations of interest (sections 3.1.1 and 3.2.1).
The GloSea5 mean 99th percentiles of wind speed and precipitation are created by taking the mean of the 99th percentiles from each of the 24 GloSea5 model timeseries (section 3.1). The mean is taken from the 24 timeseries rather than pooling all the data together due to efficiency. Although analysis using the pooled method was done for multiple gridpoints and results were indistinguishable.
2.3. Definition of extreme co-occurrence
A co-occurrence is recorded if the precipitation and the maximum wind speed occur at the same three hourly timestep, at the same gridpoint and are each above the 99th percentile. To quantify the co-occurrence we use the conditional probability measure, χ, which was first introduced by Coles et al (1999), and has also been used in Owen et al (2020). It is the probability of one variable being extreme given that the other is extreme. At each gridbox

where Y is precipitation, X is wind speed and yp and xp are the pth quantiles of Y and X with threshold probability p ∈ [0, 1], χ(p) becomes the measure of extremal dependence in the limit as p tends to 1.
In this paper χ is the probability of a precipitation (or wind) extreme occurring given a wind (or precipitation) extreme and is calculated by
where n is the total number of timesteps, na
are the number of co-occurring events and for the majority of this study p = 0.99. At every gridpoint  is calculated for each of the 24 GloSea5 timeseries, the mean at each gridpoint is then calculated from all 24 to create the GloSea5 mean
  (section 3.2).
3. Results
3.1. Wind and precipitation extremes
The mean 99th percentiles of wind speed from GloSea5 compare well with ERA5 spatially over Europe (figures 1(a)–(c)). However, the model mean overestimates wind speed by up to 9  over areas of high topography, particularly over the Scandinavian mountain ranges and the Alps. Over most of Europe the model overestimates wind speed by less than 3
  , although there are small scattered regions with underestimations of up to 5
  .
.

Figure 1. 99th percentile three hourly 10 m wind speed values ( ) for (a) ERA5 and (b) GloSea5 mean and (c) the absolute difference (
 ). Figures (d)–(f) are the same but for precipitation accumulation values (mm). Scale limits have been calculated using 2 × standard deviation of the differences.
Download figure:
Standard image High-resolution imageThe mean 99th percentiles of precipitation from GloSea5 also have a similar spatial pattern to ERA5 (figures 1(d)–(f)). However, GloSea5 underestimates extreme precipitation in the south of the Mediterranean, over Norway and Sweden and in a few small regions over Europe by up to 3 mm (although most of these regions are only underestimated by up to 2 mm). GloSea5 overestimates extreme precipitation around the north eastern coasts of the Mediterranean and western tip of Norway by up to 12 mm. Over most of Europe 99th percentile precipitation is overestimated by less than 2 mm.
Very similar results were found for daily 99th wind speed and precipitation percentiles (not shown).
3.1.1. Evaluation of the distributions
Quantile–quantile plots and histograms are made for three locations of interest: London, England; Madrid, Spain; and Stockholm, Sweden, to compare the distributions between GloSea5 and ERA5 (figure 2). These locations have been picked due to their large population sizes and therefore high risk (meaning they are of interest to the (re)insurance industry), as well as their spread over Europe. The Quantile–quantile plots show how well the quantiles of the events match between datasets. The histograms show the distributions of the co-occurring wind and precipitation events larger than the 99th percentiles.
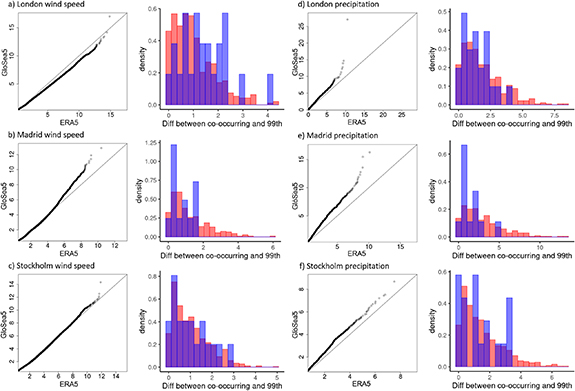
Figure 2. Quantile–quantile plots for wind speed and histograms of the difference between co-occurring extreme wind events and the 99th percentile for London (a), Madrid (b) and Stockholm (c). ERA5 are the blue bars, GloSea5 orange and purple where the datasets overlap. Figures (d)–(f) are the same but for precipitation. Note that due to the smaller observational sample, a ERA5 single co-occurring extreme bar appears taller than a single model extreme.
Download figure:
Standard image High-resolution imageGloSea5 underestimates wind speeds at London, except at the very extremes where wind speed is overestimated (figure 2(a)). GloSea5 co-occurring wind events larger than the 99th percentile are smaller than the observations, suggesting GloSea5 may not be producing extreme enough co-occurring wind events. For Madrid, GloSea5 overestimates wind speed at the upper tail (figure 2(b)). The distributions of the co-occurring wind events larger than the 99th percentile are similar between the model and observations. For Stockholm, GloSea5 estimates wind speed well, except at the very extremes where wind speed is overestimated (figure 2(c)).The distributions of the co-occurring wind events larger than the 99th percentile are very similar between the model and observations.
GloSea5 overestimates all quantiles of precipitation for all locations, with overestimation increasing largely in the upper tails (figures 2(d)–(f)). Co-occurring precipitation events above the 99th percentile are more extreme in the model, although this may be due to sampling, where there are no ERA5 events at the highest tails because our sample size is so small.
GloSea5 co-occurring events above the 99th percentile have a larger range with more events at the upper tail of the distributions than ERA5 for all of the locations, suggesting that the model can give us insight to unprecedented extreme compound events. It is worth noting that the scarcity of the extreme co-occurring events in the observations results in noisy distributions whereas the model provides a smoother distribution.
3.2. Co-occurring wind and precipitation extremes
Although substantial differences in magnitude are found between the model and ERA5 with the 99th wind and precipitation percentiles, the spatial pattern and frequency of the co-occurrence of precipitation and wind compare well between the GloSea5 mean and ERA5 (figures 3(a)–(c)). Although differences in frequency are found around and over some areas of high topography. Over the Scandinavian mountain ranges GloSea5 both under and over estimates  in distinct bands with significant differences of up to −0.33 and +0.27, indicating a shift in the location of the extreme co-occurring events from Sweden in ERA5 to Norway in the model (figures 3(c) and (f)). A similar pattern of differences between ERA5 and the model mean is also seen in Ridder et al (2021). Over the Norwegian Sea GloSea5 significantly underestimates
  by up to −0.1. Along the north eastern coasts in the Mediterranean GloSea5 overestimates
  with differences of up to +0.27. Generally most places experience differences of less than ±0.08, which in many regions are not significantly different. Details on how significance is assessed can be found in the supplementary (available online at stacks.iop.org/ERL/16/074019/mmedia).

Figure 3. Extremal dependency,  , maps for the 99th percentile three hourly extremes from (a) ERA5 and (b) the GloSea5 mean. Note in the independent case
  . (c) The absolute difference (
 ) between GloSea5 and ERA5
  . Scale limits have been calculated using 2 × standard deviation of the difference.
  values for ERA5 and GloSea5 mean for gridpoints (d) over land and (e) over sea, with corresponding correlation coefficients, r. (f) Regions where ERA5 and GloSea5 are significantly different at the 5% level (greyed areas). Circles are London, Madrid and Stockholm.
Download figure:
Standard image High-resolution imageThese results are generally quite similar to previous studies (Ridder et al 2021). Similar patterns of model mean overestimation over Scotland and underestimation over England are found, along with similar patterns of differences over the Iberian Peninsula. Although the GloSea5 model mean mainly underestimates compound precipitation and wind over central Europe whereas the model in Ridder et al (2021) overestimates.
The values of  between the model mean and ERA5 have a correlation coefficient of 0.665 over land and 0.649 over sea (figures 3(d) and (e)). Over land the scatter is large with GloSea5 both under and overestimating
  . Over sea GloSea5 tends to underestimate
  .
.
Very similar results are found for the spatial pattern of co-occurrence between daily extremes (not shown). Although the difference between the datasets has a slightly larger range (most of Europe ±25% difference) and the correlation coefficients were lower (0.522 over land and 0.485 over sea).
3.2.1. Co-occurrence and threshold
We investigate how  varies with extremal threshold (from the 90th to 99.9th percentiles) between the datasets at the three locations of interest (figure 4). See supplementary for how the confidence intervals in figure 4 are calculated.
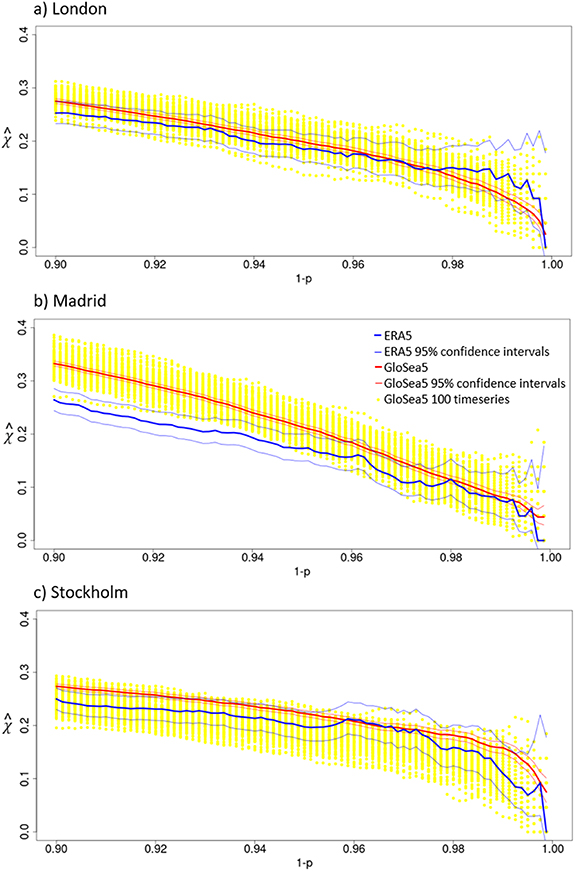
Figure 4. Threshold vs  for London (a), Madrid (b) and Stockholm (c). The blue lines represent ERA5
  and corresponding 95% confidence intervals, the red lines represent GloSea5
  and corresponding 95% confidence intervals and the yellow dots are 100 timeseries from the GloSea5 ensembles.
Download figure:
Standard image High-resolution imageFor London and Stockholm the model represents the frequency of all extreme co-occurring events well. The GloSea5  follows the ERA5
  closely for almost all thresholds, where almost all GloSea5
  values are within the ERA5 95% confidence intervals (figures 4(a) and (c)). For Madrid, the Glosea5
  is larger than the ERA5
  and outside the 95% confidence intervals between 0.9 and 0.975 (figure 4(b)). However beyond 0.975 the model and observations match well, meaning that the model is representing the frequency of the most extreme co-occurring events well for Madrid.
All three locations show tail independence ( goes to 0 as the threshold tends to 1), meaning the largest extremes of wind and precipitation do not co-occur. The rate of convergence is different for each location. For Stockholm
  converges very suddenly whereas at London and Madrid
  converges more slowly.
Even at the largest threshold, some of the GloSea5 100 timeseries give very large values of  (
( 0.2) (yellow dots on figure 4). The model is producing
  values that are unprecedented in the observations suggesting that it is possible to have a series of years that give very large
  values at the upper thresholds and hence consist of a large number of very extreme co-occurring events.
The slope of GloSea5 is a smooth slope down to the highest thresholds, whereas ERA5 is variable due to the smaller sample size. Therefore GloSea5 can be used quantify the frequency of extreme co-occurring events in the very high thresholds better than the observations can.
3.3. Synoptic patterns
To evaluate the synoptic patterns between ERA5 and GloSea5, MSLP anomaly composites for three hourly co-occurring extreme events are made for the three locations of interest (figure 5). This anomaly is the difference from the DJF 24 year mean. For all three locations GloSea5 MSLP winter anomaly matches well to ERA5, suggesting that the extreme co-occurring events found in the model have been caused for the correct synoptic reasons.
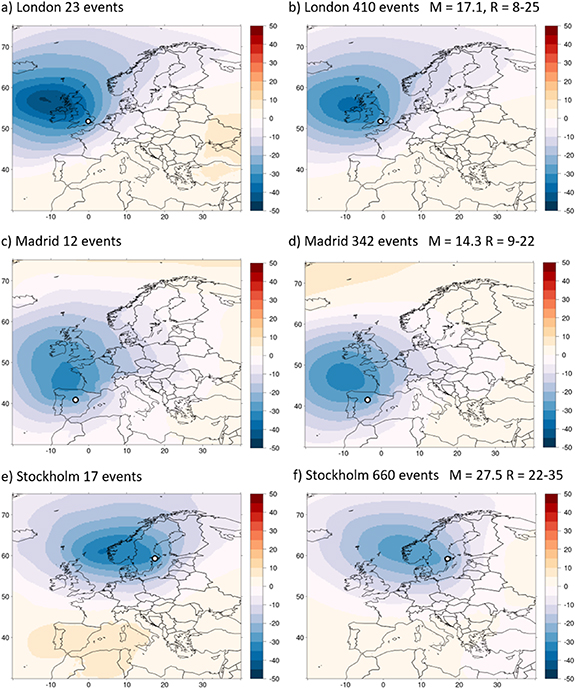
Figure 5. Mean MSLP DJF anomaly (hPa) when three hourly extreme co-occurring events occur at London, Madrid and Stockholm from ERA5 (a)–(c) and GloSea5 (d)–(f). The total number of extreme co-occurring events from ERA5 (left) and all 24 GloSea5 timeseries and the corresponding mean (M) and range (R) from the 24 timeseries (right) are written above each plot.
Download figure:
Standard image High-resolution imageWhen extreme co-occurring events occur in London, there is a large negative MSLP anomaly of 45 hPa over the North Atlantic north west of the UK (figure 5(a)). This indicates strong south-westerly flow over the English Channel in a region of the cyclone that is likely associated with frontal precipitation. GloSea5 shows a similar anomaly pattern with the largest magnitude negative anomaly of 36 hPa (figure 5(d)).
For extreme co-occurring events in Madrid, the negative MSLP anomaly is situated to the north of Spain, indicating westerly flow over the Iberian Peninsula. The anomaly is weaker than for the London case, at 32 hPa (figure 5(b)). The model shows a very similar pattern with the largest anomaly shifted slightly west with a smoother pattern due to the larger number of events (figure 5(e)). These patterns are consistent with Catto et al (2010) where composites of strong cyclones showed the strongest winds occur to the south east of the cyclone where the warm conveyor belt is found.
For the Stockholm cases, the lowest MSLP is found directly to the west indicating winds that are more southerly with a MSLP anomaly of 25 hPa (figure 5(c)). This location is also likely associated with frontal zones and the different position relative to the cyclone centre associated with the time in the cyclone lifecycle and the poleward movement of the cyclones. GloSea5 shows a similar pattern with the largest magnitude negative anomaly of 28 hPa (figure 5(f)).
4. Discussion and conclusions
This study has investigated how well the Met Office's GloSea5 seasonal forecast model ensembles represent extreme precipitation, extreme winds, and their co-occurrence and the synoptic situations leading to them by comparing them with ERA5. This is a difficult test for a model due to the number of factors that play a role. The main conclusions are given below in reference to the questions posed in the introduction, along with the main discussion points.
- (a)How well does GloSea5 represent the spatial pattern and magnitude of three hourly extreme wind and precipitation?The 99th percentiles of three hourly 10 m wind speed and precipitation accumulation have been compared between ERA5 and GloSea5. The spatial pattern of these both compare well over Europe. However, for most of Europe the model overestimates extreme wind speed. This is particularly true over areas of high topography. Histograms and quantile-quantile plots for London, Madrid and Stockholm show that the model under and over estimates extreme wind and the number of extreme co-occurring wind events depending on location. At the most extreme thresholds these are always larger in GloSea5. For most of Europe the model overestimates extreme precipitation, which is true for London, Madrid and Stockholm. From quantile–quantile plots it is seen that extreme precipitation is particularly overestimated.
- (b)How well does GloSea5 represent the spatial pattern and frequency of three hourly co-occurring extreme wind and precipitation?The GloSea5 conditional probability of exceedance above the 99th percentile compares well spatially against ERA5 over Europe. And for most places the frequency of the events matches very well. Nevertheless, significant differences in frequency are found around and over some areas of high topography, particularly over Scandinavia, and the Norwegian Sea. For London, Madrid and Stockholm the model
 values are larger for almost all thresholds (0.9–0.999), although for much of these the model is still within the ERA5 95% confidence intervals.
 - (c)Can GloSea5 represent the correct synoptic situations leading to three hourly co-occurring extreme events?MSLP winter anomaly composites for extreme co-occurring events have been made for London, Madrid and Stockholm using ERA5 and GloSea5. The GloSea5 model creates the correct synoptic situations leading to extreme co-occurring events at all three of these locations. This is seen in the spatial pattern of the MSLP anomaly as well as the magnitude. The model could be particularly useful to look at weather systems associated with co-occurring extremes since the corresponding synoptic situations were found to be so similar to ERA5.

Although the 99th percentiles of precipitation and wind are generally overestimated in the model,  is underestimated over regions of western Europe, the Mediterranean and the Norwegian Sea. This means the model has more extreme wind (or precipitation) events that co-occur with non extreme precipitation (or wind) events in these regions. We investigated whether the model has a lag, where precipitation and wind values are out of phase with each other but found this is not the case for most locations (not shown).
Another reason  could differ from the observations may be due to a spatial offset in GloSea5, particularly within the cyclones causing these co-occurring events. The positioning of extreme precipitation within cyclones in the model may be inaccurate due to parametrizations of diabatic processes (Catto et al
2010). Although the synoptic patterns themselves do look very similar between the model and observations which means that the dynamical features are well represented.
could differ from the observations may be due to a spatial offset in GloSea5, particularly within the cyclones causing these co-occurring events. The positioning of extreme precipitation within cyclones in the model may be inaccurate due to parametrizations of diabatic processes (Catto et al
2010). Although the synoptic patterns themselves do look very similar between the model and observations which means that the dynamical features are well represented.
It is also worth noting that ERA5 may not be suitable as a benchmark for compound precipitation and wind events over complex terrain such as the Alps (Zscheischler et al
2021). Zscheischler et al (2021) showed ERA5 has different behaviour for  compared to high resolution weather model simulations over such regions. Owen et al (2020) also found that ERA5 overestimated daily co-occurrence over high topography compared to observational data. Hence differences in
  occurring over high topography may be down to inaccuracies in ERA5 rather than GloSea5.
Although precipitation and wind extremes can differ in magnitude largely between the model and observations, the frequency of co-occurring events compare much better, highlighting the potential of GloSea5 to investigate unprecedented and very rare extreme co-occurring events. The potential of GloSea5 is also seen in the larger sample of extreme and co-occurring events, which gives us smoother distributions and more confidence in our results. The results in this paper along with Ridder et al (2021) and Zscheischler et al (2021) give us confidence that climate models of different horizontal resolutions can simulate compound precipitation and wind extremes well. This suggests that such models can be used to investigate future changes in compound events as well as assessing the likelihood of unprecedented and very rare events.
Acknowledgments
L E Owen is supported by The University of Exeter's College of Engineering, Mathematics and Physical Sciences studentship.
N J Dunstone was supported by the Met Office Hadley Centre Climate Programme funded by BEIS and Defra.
Data availability statement
The data that support the findings of this study are available upon reasonable request from the authors.