

Abstract
India needs to address the immediate concerns of water supply and demand, due to its increasing population, rapid urbanization, and growing industrialization. Additionally, the changing climate will influence water resources, which will subsequently impact the overall sectoral end-use demand patterns. In this study, we have integrated a water module with the existing bottom-up, techno-economic Asia–Pacific Integrated Model/End-use energy system model for India to estimate the future water demand in major end-use sectors under business-as-usual (BAU), nationally determined contribution (NDC), and low-carbon futures (2 °C and 'well below 2 °C') up to 2050. We also simulate the effects of water constraints on major sectors under different climate-change regimes. Our results show that water-intensive end-use sectors, specifically agriculture and power, will face major impacts under water-constrained scenarios. Over the period between 2020 and 2050, policy measures taken under the NDC scenario can cumulatively save up to 146billion cubic metres (bcm) of water, while low-carbon scenarios can save 20–21 bcm of water between 2020 and 2050, compared with BAU. In a water-constrained future, NDC and low-carbon futures can save 28–30 bcm of water. There is a need to increase the current water supply by 200–400 bcm. The marginal cost of installing dry cooling systems in the power sector is considerably higher than the cost and benefits of installing micro-irrigation systems with solar PV. Integrated policy coherence is required to achieve sustainable development goals, e.g., NDC and Paris Agreement goals, in both water and energy sectors. Concurrently, regulatory and economic instruments will play an essential role in improving resource-use efficiency at a systemic level, to reduce the overall water demand.
Export citation and abstract BibTeX RIS

Original content from this work may be used under the terms of the Creative Commons Attribution 4.0 license. Any further distribution of this work must maintain attribution to the author(s) and the title of the work, journal citation and DOI.
1. Introduction
The adoption of sustainable development goals (SDGs) and the Paris Climate Change Agreement in 2015 focused on mitigation and coping strategies to tackle water security and the impacts of climate change on water as a resource and its various other capacities (COP21 2015, UNSDG 2015). India's nationally determined contribution (NDC) emphasizes mitigation through emission intensity reduction and renewable energy; however, the focus on water is from the perspective of adaptation (NDC 2015). At a national level, the central government has removed sectoral prioritization for the allocation of water to domestic and economic uses in the most recent draft water policy (GoI, 2012). In addition, the National Water Mission (NWM) under the National Action Plan for Climate Change (NAPCC) has highlighted the need for water-use efficiency (WUE) in major water-intensive sectors, especially agriculture (NAPCC 2008), a parameter also indicated under SDG6 (UNSDG 2015, GoI 2018). In March 2017, the thirteenth report of the standing committee on water resources, on the subject of 'Indigenous and modern forms of water-conservation techniques and practices' has again highlighted WUE in water-scarce states, in addition to conservation through budgeting and increasing the water supply through various mechanisms of harvesting (GoI 2017a).
India's water demand 7 is rapidly outpacing its supply 8 . India's utilizable 9 water supply has remained fairly constant, ranging between 1100 and 1197 billion cubic metres (bcm) (FAO 2012, India-WRIS 2012, FAO 2017). In contrast, studies have projected that the total water demand will rise from 550–710 bcm in 2010 to around 900–1400 bcm in 2050 (India-WRIS 2012, Amarsinghe et al 2014). Agriculture accounts for more than 85%, while power, industry, and the domestic (building) sectors share the remaining demand. Groundwater extraction is the main method of irrigation, as opposed to canal-based surface water irrigation. Groundwater contributes to about 62% of irrigation needs and 85% of rural and 45% of urban water supply (Amarasinghe 2014, CGWB 2014).
The physical water scarcity in nine river basins, where four-fifths of the national water usage takes place in India, will lead to an increasing gap between water supply and demand by 2050 (Amarsinghe et al 2014, Mishra et al 2019). Furthermore, climate change, in addition to extreme events, will impact water as a resource, thereby affecting water storage, supply, and its end-uses. This will not only lead to increased competition for water between different sectors but also severely impact both food and economic security in various regions across the country. Competition for off-flow use in major sectors will also affect the in-flow uses of water, such as the production of electricity (specifically hydropower), fisheries, and inland waterways. Moreover, changes in the climate, an increased frequency of extreme droughts, environmental degradation, and pollution will exacerbate the stress on water use. Monitoring the water situation in India is relevant, due to its impact on the transition towards a low-carbon economy. This will have significant implications for future food security, industrial, and urban water use, as well as impacts on local and regional environments.
Mishra et al (2018) and Zhang et al (2017) have categorized about ten years 10 between 2000 and 2020 as drought years 11 , based on various criteria. Consequently, several districts in various states of India have observed competition between water users in the agricultural, power, and industrial sectors, indicating its vulnerability when compared to international standards. India's water (storage and supply) infrastructure severely lags behind its current water demand requirements. Furthermore, the water storage availability of 91 major reservoirs ranges between 29% and 45% of their total capacity during the summer months, which is further reduced during drought years (Mishra et al 2018, CWC 2020). Studies in the physical sciences have demonstrated the presence of water stress at spatial (regional, national, sub-national) levels; however, they have not observed the impacts of water constraints 12 at a systemic level on different sectoral (and sub-sectoral) water demands, i.e. they have not simultaneously considered WUE and water productivity from an end-user's perspective at a systemic level for India.
India is rapidly moving towards becoming a middle-income economy, with a population projected to overtake China's by 2025, and a level of urbanization that will exceed 50% by 2050 (UN 2019). As a developing country, India is committed to achieving its SDG and NDC goals by 2030. Studies such as that of McCollum et al (2018) have emphasized the impact of energy policies on other SDGs at the global level, while Dzebo et al (2019) conducted a textual analysis of countries' NDCs and concluded that six SDGs 13 have strong links to NDC activities. Parkinson et al (2019) used the Model for Energy Supply Strategy Alternatives and their General Environmental Impact - GLObal BIOsphere Model (MESSAGEix-GLOBIOM) integrated assessment model (IAM) to specifically focus on SDG6 14 at a global scale; Krey et al (2021) conducted a multi-model (global and national) assessment to simultaneously analyze the co-benefits and trade-offs arising from implementing integrated policies to achieve NDCs and the subsequent impact of doing so on achieving multiple SDGs 15 . The modelling of water demand at a sectoral level under climate change mitigation actions has specifically been focused on a single sector of India, such as power (Macknick et al 2012, Clemmer et al 2013, Srinivasan et al 2018) or agriculture (Chaturvedi et al 2015). Studies have not yet captured both the SDG and NDC 16 linkages of water–energy interactions across all sectors at a national level.
Integrated resource assessment modelling requires that the impacts of all resource-sector policies, including water, energy, and land, should be captured. In the past, policymakers and researchers used an integrated water resource management approach to collect data for water availability and usability at the basin level. This approach has certain limitations. First, it does not capture water demand at a sectoral and technological level from the end users' perspectives (socio-technical). Second, it cannot account for improvements in the productivity of water at the technological and economic levels (techno-economic). Third, the basin-level approach does not consider the water–energy interactions at the local, provincial, and national-level jurisdictions (Liu et al 2017, Endo et al 2020). In reality, in a developing country, water supply and demand heavily impact other resources such as energy and vice versa. Understanding this interaction is essential to evaluate the co-benefits and trade-offs, especially when transitioning towards a low-carbon economy. Since 2011, the study of the water–energy–food–climate-change nexus has been gaining traction in academic circles (Liu et al 2017). Mitigation studies observe policies relevant to energy systems only. Switching to low-carbon and carbon-neutral sources of energy does not necessarily lead to efficient water use. In fact, it can exacerbate the existing conditions caused by the increase in water stress.
In this paper, we present the first detailed country-level analysis of integrated water–energy systems that captures SDG-NDC linkages from the sectoral end users' perspectives. We analyze water demand at the sectoral and sub-sectoral levels under existing policies, NDC, and low-carbon pathways. Additionally, we study the impacts of water-constrained, energy-constrained, and carbon-constrained futures on water demand and power generation. Our results demonstrate the need for integrated assessment models and policy coherence to study the impact of low-carbon transitions on resources such as water. Subsequent sections provide details of the methodology and the results of the model, followed by key insights into future water demands and the need for efficient resource-use policy measures in the major water-intensive sectors of India.
2. Methodology
Integrated water–energy systems have been captured through top-down IAMs, such as Global Change Analysis Model-Indian Institute of Management (GCAM-IIM) and Integrated Research and Action for Development-Integrated Assessment Model (IRADe-IAM), in addition to bottom-up models, such as The Integrated MARKAL-EFOM System (TIMES/MARKAL-Water), Long-range Energy Alternatives Planning System-Water Evaluation And Planning (LEAP-WEAP) and the Model for Energy Supply Strategy Alternatives and their General Environmental Impact (MESSAGE-Water) models. While most IAMs have used sectoral water-use coefficients 17 to capture water demand in the agricultural and power sectors, the industrial and building sectors have not been accounted for. Furthermore, these models run simulations for a fixed time period (the shortest being five years) (Bazaz 2011, Rodriguez et al 2013, Mitra et al 2014, Chaturvedi 2015, IEA 2017, Srinivasan et al 2018). Studies since the 1990s have estimated water demand at basin level for 193 countries. They have considered region-wise structural changes at a macroeconomic level through economic growth, demography, lifestyles and demand patterns, and technological advances in improving water-use efficiencies, in addition to variations in climatic factors and their impact on water use (Gleick 2000, Alcamo et al 2003, Shiklomanov and Balonishnikova 2003, FAO 2012, Amarasinghe et al 2014). In order to capture techno-economic details with sectoral and sub-sectoral granularity at a national level, the Asia–Pacific Integrated Model (AIM)/End use, a bottom-up optimization model, was selected for India (Kapshe et al 2003, Kainuma et al 2003, Vishwanathan et al 2017) 18 . This model is unique, as it can describe the sectoral competition for water and energy from the end-users' perspectives through a technology–resource mix. Additionally, we have also simulated water stress by applying water supply constraints to the water–energy systems to observe their impact on water demand across sectors. Unlike the aforementioned studies, this study captures water, energy, and land systems in one model. The following section describes the AIM/End-use Indian model, supported by appendices A–C (available online at stacks.iop.org/ERL/16/085011/mmedia), which provides the framework, policy, and model assumptions for the study in detail.
2.1. Model description
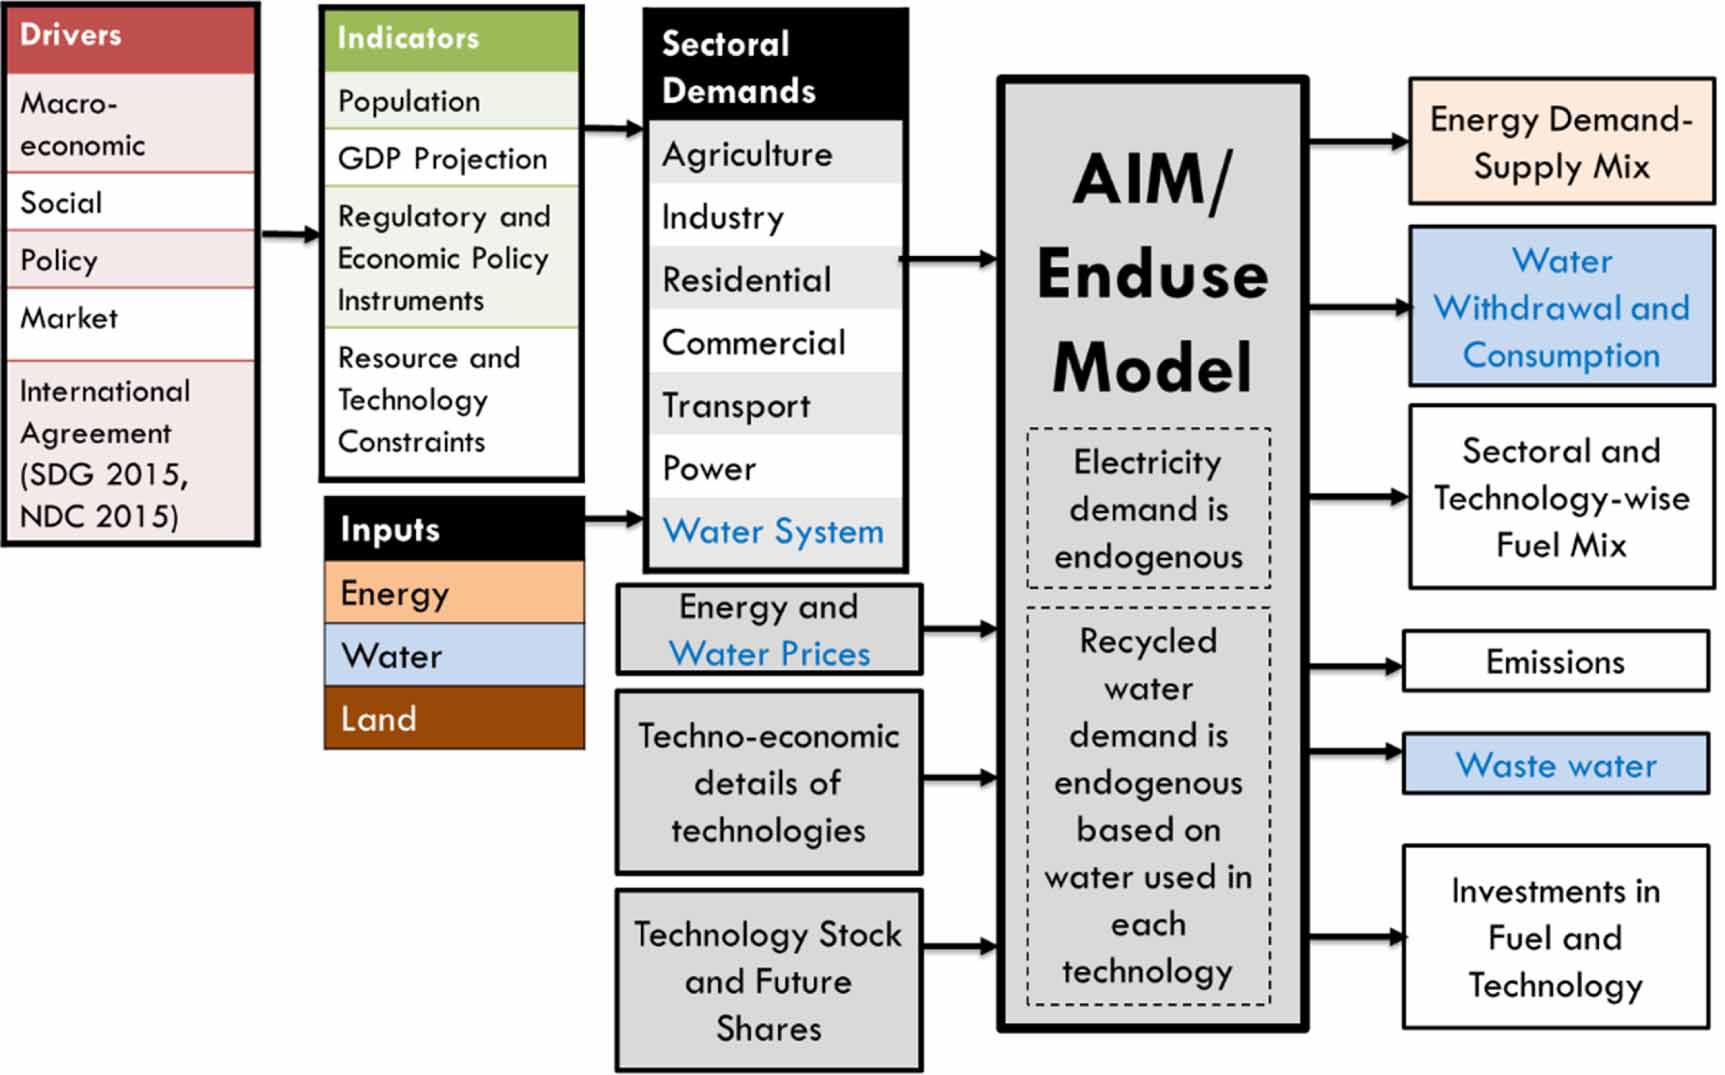
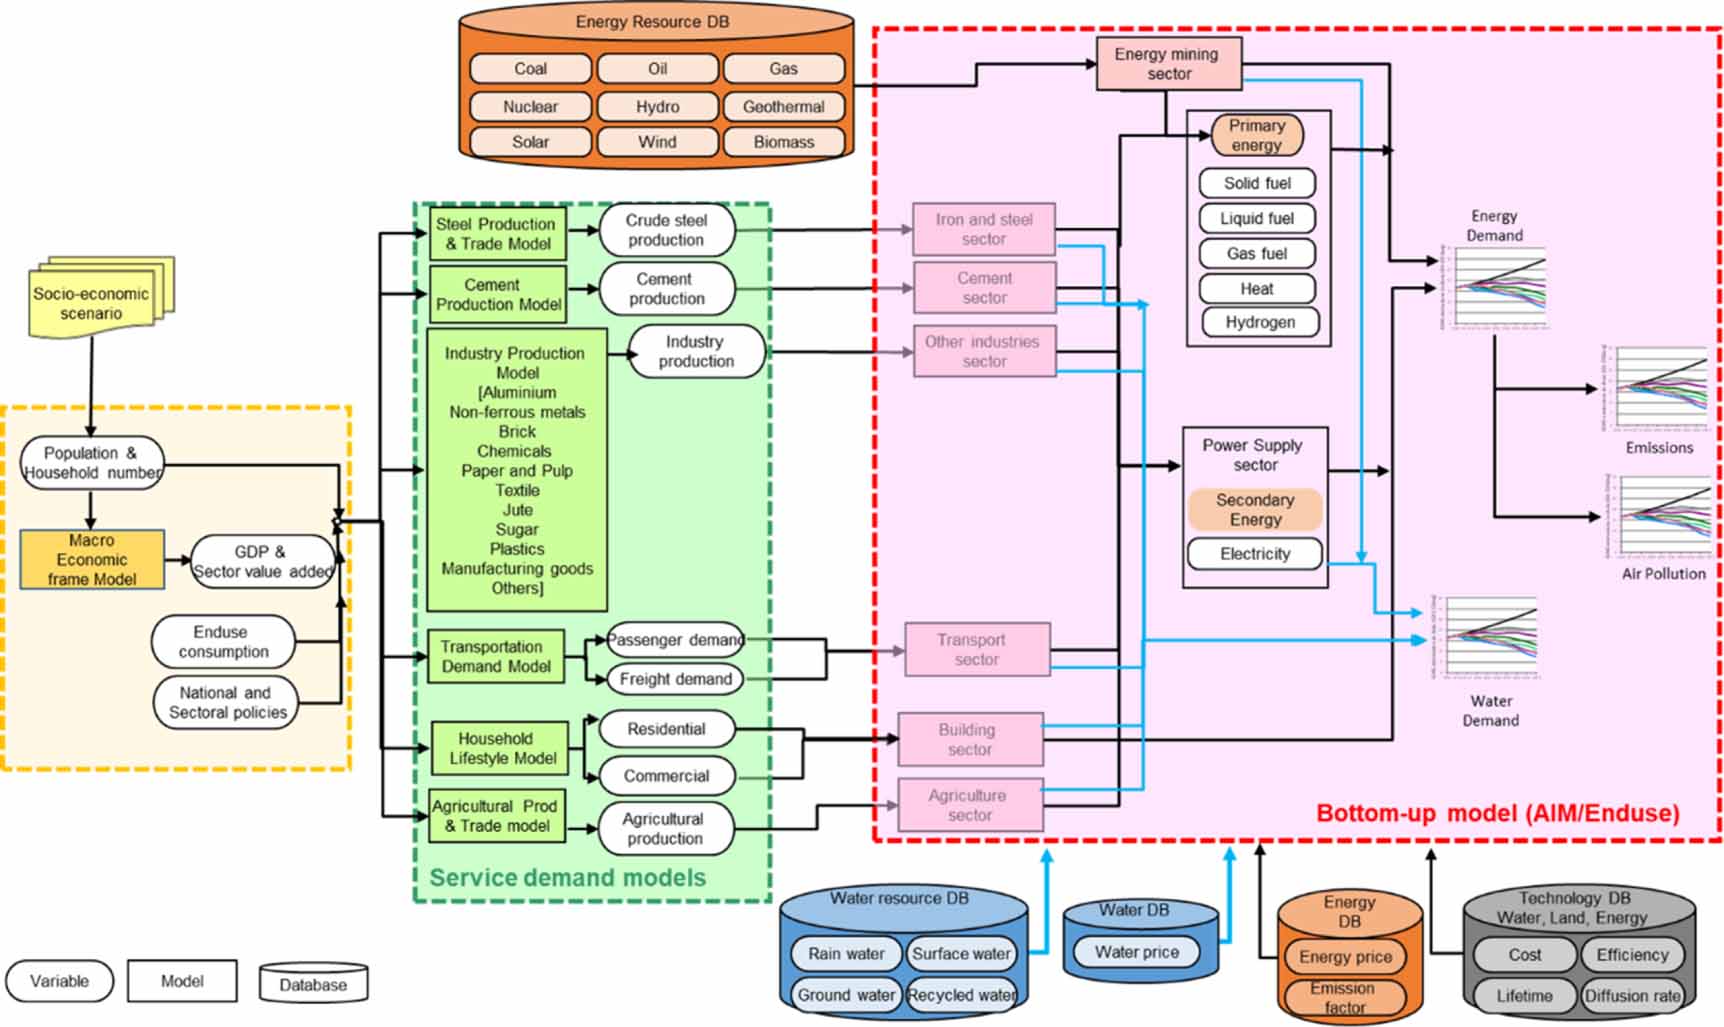
The AIM/End-use Indian model integrates the water module at the resource and technological level into the existing energy and environment systems (Vishwanathan et al 2017, 2018a, Vishwanathan and Garg 2020) to capture the impacts of existing and future policies for water, energy, and land systems on the major water- and energy-intensive sectors. The model uses recursive dynamics and runs in annual time steps. It optimizes costs (technology, energy, and water) and resources (water, energy) by selecting a set of best available technologies based on given physical resources and technological and environmental parameters. A detailed characterization of the inputs reflects an optimistic engineering view of technological progress. Economic parameters, such as taxes, subsidies, resource (energy, water, and land) technologies, policies, and social costs are also classified. The final service demand is exogenous, and is driven not only by the gross domestic product (GDP) but also by end-use consumption and policies across various sub-sectors. The model is also being soft-linked to climatic–hydrological models (Vishwanathan et al 2018b). Figure 1 illustrates the addition of water and land as inputs into the major sectors of the existing AIM/End-use Indian energy model 19 . Figure 2 details the variables, parameters, database, and information flow in the current integrated assessment model.

Figure 1. Modified AIM/End-use Indian water–energy–land (W–E–L) modelling framework. Note: water-module developments (new) are highlighted in blue.
Download figure:
Standard image High-resolution image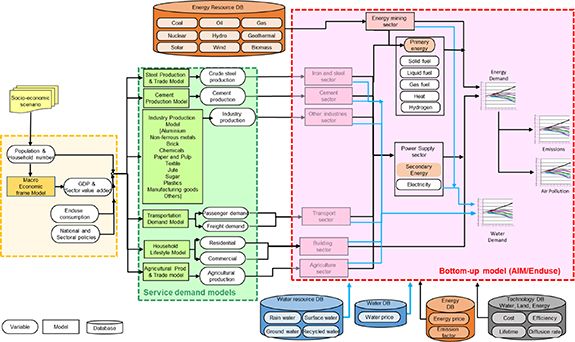
Figure 2. Variables, parameters, and information flow in the AIM/End-use Indian water–energy model. Note: This figure is a modified version of that given in Hanaoka et al (2018), which captures energy systems at a national level. The detailed variables and parameters of the AIM/End-use global model can be sourced from Hanaoka et al (2015) and Hibino et al (2003). The water module (in blue) is a new addition to the existing Indian AIM/End-use model (Vishwanathan et al 2018). Original framework reproduced from Hanaoka et al (2018)). CC BY 3.0 has been considerably modified (in macro-economic, service demand and bottom-up model sections) to capture the details of AIM/End-use Indian model.
Download figure:
Standard image High-resolution image2.2. Scenario architecture
Table 1 presents the salient features of the AIM/End-use Indian (water–energy–land) model. Appendix B presents the SDG-NDC interlinks captured in the model. Appendix C (tables C1–C5) provides policy targets and assumptions pertaining to the water sector. Four scenarios have been explored, combining sectoral policies, mitigation actions, and SDG and NDC targets set for India, in both water as well as energy. Table 2 presents scenario descriptions for the business-as-usual (BAU), NDC, and alternate low-carbon futures. Table C6 (appendix C) lists the policy drivers and model assumptions for each scenario.
Table 1. Salient features of the AIM/End-use Indian water–energy–land model.
| Feature | Description |
|---|---|
| Time frame | 2000–2050 (50 years) |
| End-use sectors | Four major demand sectors: Agriculture: more than 15 crops, including rice, wheat, other cereals, pulses, sugarcane, fruits and vegetables |
| Power: coal (sub-critical, super-critical, IGCC), gas (OGCT, CCGT), oil (diesel), nuclear, hydro (large and small), bioenergy, solar (photovoltaics (PV), concentrated solar power (CSP)), wind, waste-to-energy, and negative-emission technologies | |
| Industry: more than 15 water-intensive industries (paper and pulp, textiles, cement, steel, fertilizer, leather, distillery), Negative emission technologies | |
| Building: includes both residential (drinking, cooking, water heating, bathing, flushing) and commercial sectors (hotels, educational buildings, and so on) | |
| Resources | Fresh water (rain water, ground water, surface water from rivers, canals) and recycled water |
| Energy (fossil fuels, renewables) Land | |
| Technologies | Over 470 devices in end-use demand sector |
| Services | Over 75 services have been captured |
Table 2. Scenario description of current and alternate futures.
| Scenario name | Scenario description |
|---|---|
| Business-as-usual scenario | The business-as-usual (BAU) scenario assumes the continuation of existing water and energy policies under current socio-economic dynamics. These include policies put in place before the development of the climate action plan and the NDC document. The water policies did not provide quantitative targets; however, they focus on efficient use of water through conservation. Similarly, the energy policies stress energy efficiency through the Energy Conservation Act of 2001 and the Integrated Energy Policy of 2006. |
| Nationally Determined Contribution (NDC) scenario | This scenario takes into account the ongoing mitigation and adaptation strategies under the climate-change action plan, consisting of policies mentioned in the National Water Mission (NWM) in the National Action Plan on Climate Change (NAPCC 2008) and NDCs adaptation goal, which are supported by programmes such as the Integrated Watershed Management Programmes (IWMP), the scaling up of micro-irrigation (sprinkler, drip) technologies under the National Mission for Sustainable Agriculture (NMSA). The NDC scenario accounts for India's commitment to UNFCCC in response to decisions taken at COP19 and COP20 for energy and emissions targets. The NWM establishes the target of improving the water use efficiency by 20% in the agricultural sector. In the power sector, a mandatory policy was enforced in 2017 to limit the water use to 4 m3 MWh−1 for older thermal power plants and to 2.5 m3 MWh−1 for newer power plants. The NDC targets highlight mitigation through reducing the greenhouse gas (GHG) intensity of the gross domestic product (GDP) by 33%–35% compared to the 2005 level, increasing the renewable power generation capacity to 40% of the total mix, and increasing the carbon sink by 2.5–3 billion tonnes (bt) by 2030. |
| Low-carbon futures (the 2 °C scenario and the 'well below 2 °C' scenario) | As India is committed to mitigating its emissions to meet the Paris Climate Change Agreement, the study evaluates these futures using 2 °C and 'well below 2 °C' scenarios. The 2 °C low-carbon scenario assumes that the carbon budget for India is estimated to be in the range of 115–136 bt CO2 from 2011 to 2050 (Tavoni et al 2014, Shukla et al 2015, Vishwanathan et al 2018a). The use of carbon-capture and storage technologies is at the pilot demonstration stage, and the shift to solar PV in the agricultural sector is being encouraged through regulatory and economic instruments. Carbon Capture and Storage (CCS) has been proved to be water intensive (GCI 2015, Rosa et al 2020), while the shift to solar-powered irrigation systems has been shown to use water indiscriminately (FAO 2018). Hence, the water-use efficiency targets are assumed to be 25%, based on the integration of solar PV with micro-irrigation systems (MIS). The 'well below 2 °C' low-carbon scenario assumes that the carbon budget for India is estimated to be less than 115 bt—CO2 during 2011–2050 (Vishwanathan et al 2018a). The WUE targets are set at 30% to correspond to the maximum feasible actions that can be implemented in most sectors. |
| Water-constrained scenarios (BAU, NDC, 2 °C scenario and 'well below 2 °C' scenario) | In addition to carbon- and energy-constrained scenarios, the water-constrained scenarios capture the stress in water supply across all sectors. Applying a water supply limit of 1197 bcm up to 2050, we have simulated the impact of water constraints (water stress) on water demand across sectors. The current model has not included rainwater water harvesting as a means of water supply, due to non-availability of data at a national level. |
3. Results
3.1. Impacts of energy and carbon constraints on water demand
3.1.1. Overall
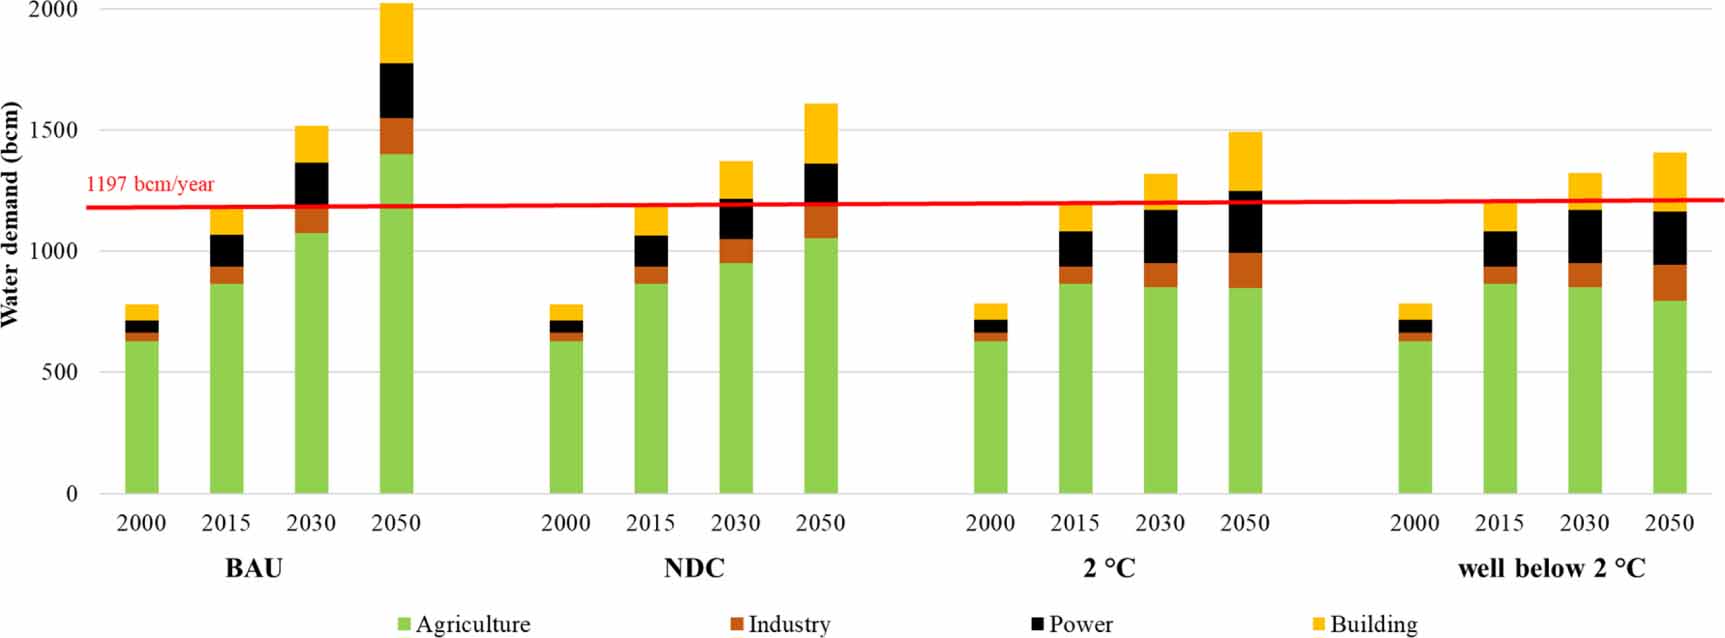
Figure 3 presents the segregation of water demand among major water-intensive end-use sectors, based on energy and carbon constraints. The water demand exceeds the country's water supply limit of 1100–1197 bcm yr−1 in and after 2020 for all scenarios. The demand exceeds the supply limit 20 by 27% in 2030 and by 69% in 2050 under BAU, by 15% in 2030 and by 34% in 2050 under NDC, by 10% in 2030 and by 18%–25% in 2050 under low-carbon futures.
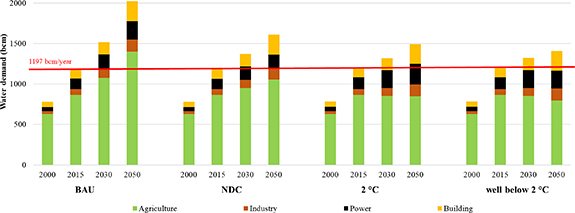
Figure 3. Water demand in major sectors under BAU, NDC, and low-carbon futures. Note: the water supply limit ranges from 1100 to 1197 bcm yr−1.
Download figure:
Standard image High-resolution imageThe agricultural water share decreases from 81% of the total demand in 2000 to 69% in the BAU scenario, to 66% in the NDC scenario, and to 57% in the low-carbon futures in 2050. The power sector water share increases from 6% in 2000 to 11% in the BAU scenario, to 10% in the NDC scenario, and to 15%–17% in the low-carbon futures in 2050. The industrial sector water share increases from 5% in 2000 to 7% in the BAU scenario, to 9% in the NDC scenario, and to 10%–11% in the low-carbon futures in 2050. The building (residential and commercial) sector water share increases from 8% in 2000 to 13% in the BAU scenario, to 16% in the NDC scenario, and to 15%–17% in the low-carbon futures in 2050.
3.1.2. Agriculture
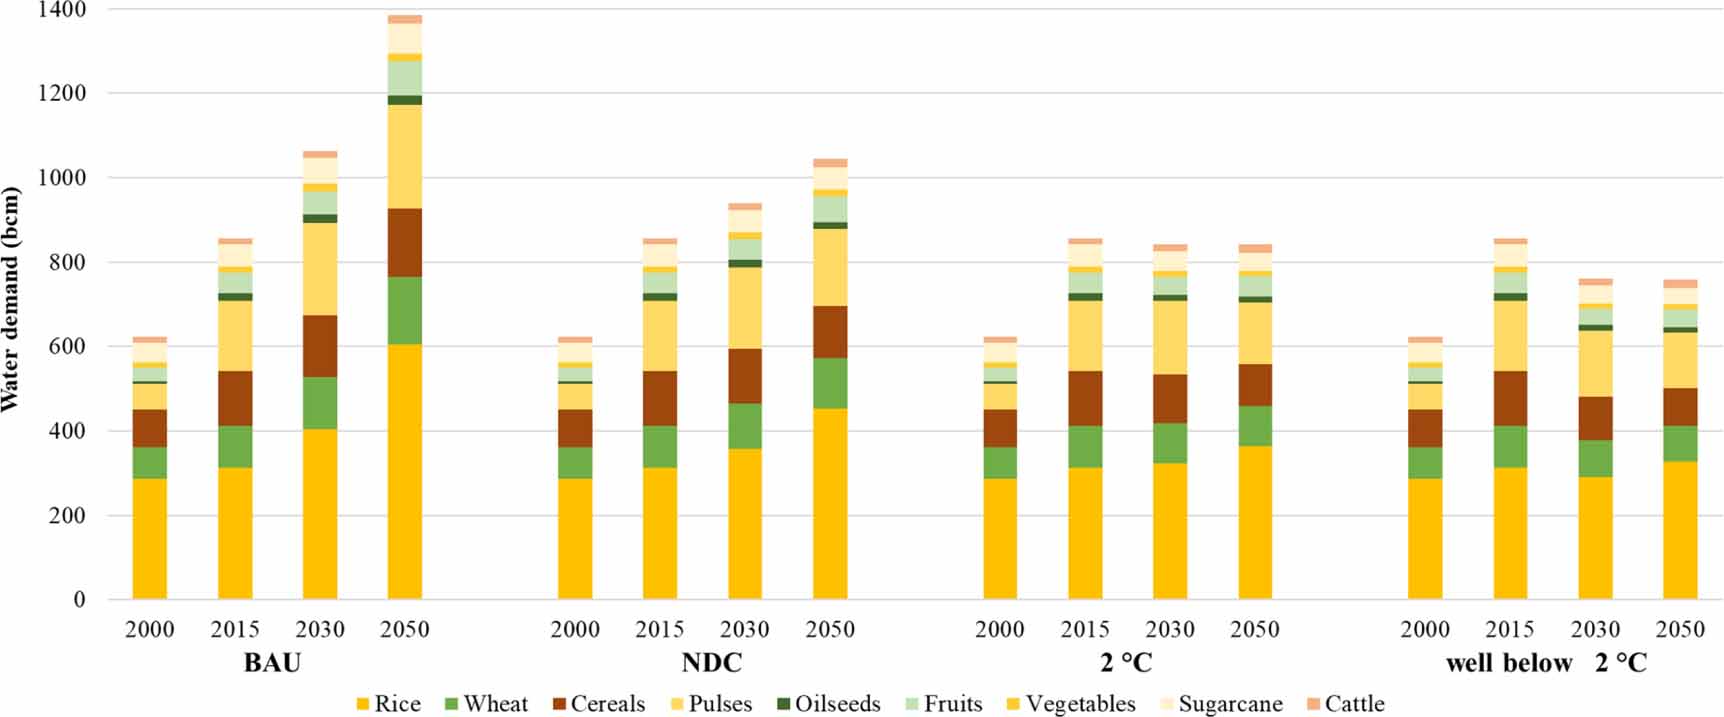
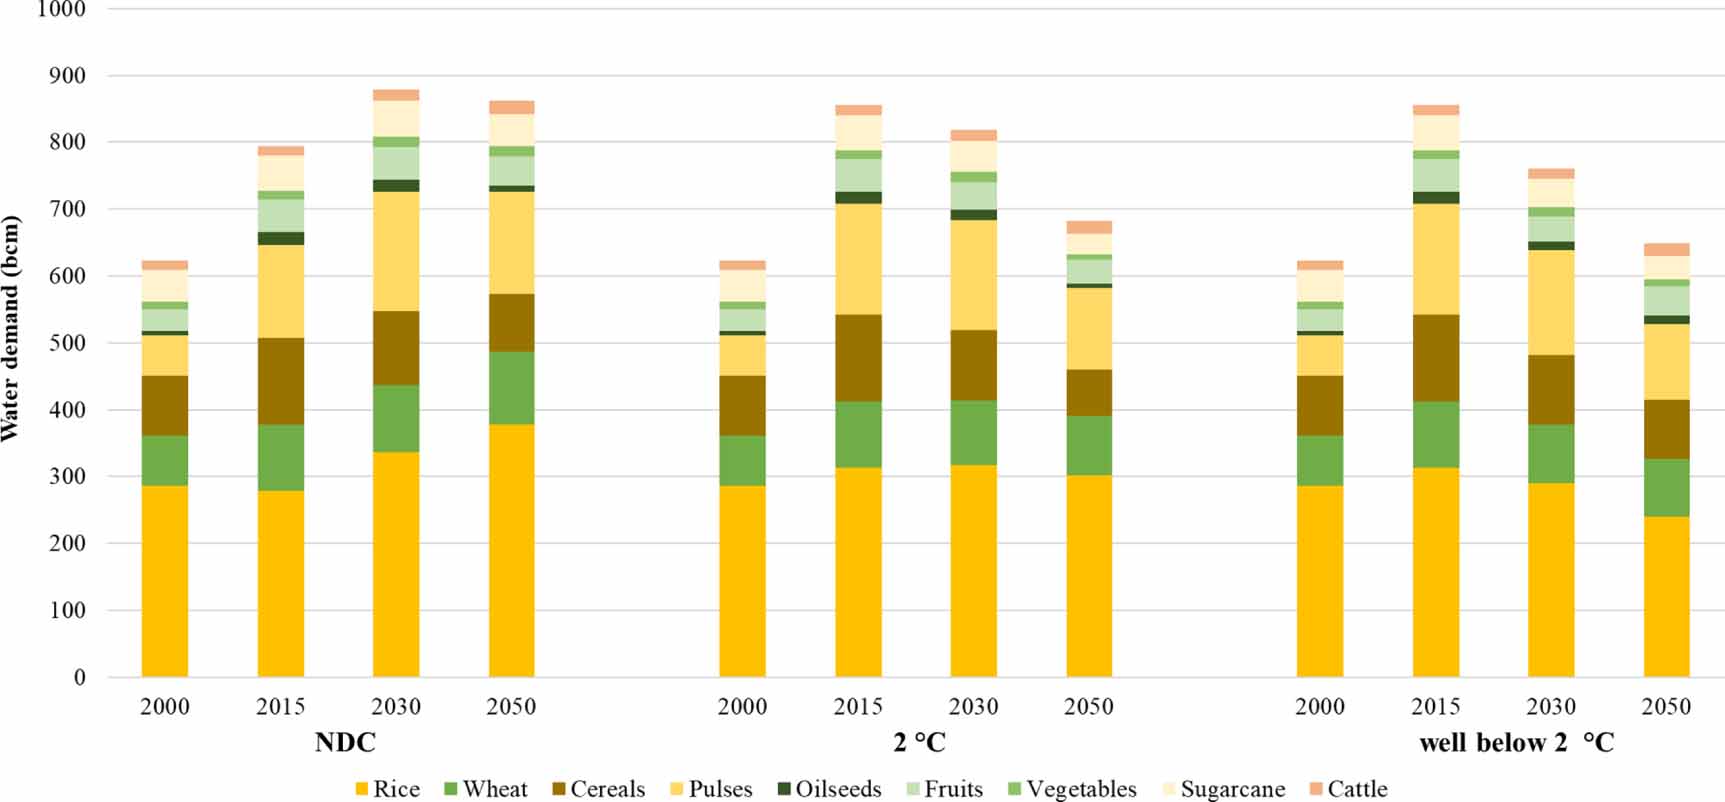
In this study, we have described WUE as the relationship between water demand and sectoral output (crops, industrial outputs, power generation and capacity). This indicator has been used at national (NAPCC, INDC) and international levels (SDG 6, Target 6.4) to guarantee sustainable withdrawals and freshwater supply. It should be noted that the model includes rain water, surface water (canal, river), and groundwater. In the agricultural sector, rice accounts for more than 35% of the total water demand, followed by pulses, wheat, and other cereals in all scenarios (figure 4).
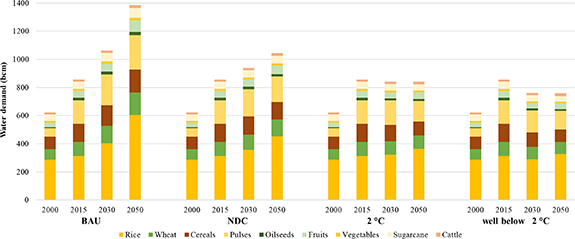
Figure 4. Crop-wise water demand under BAU and alternate futures.
Download figure:
Standard image High-resolution imageIn the agricultural sector, between 2015 and 2050, crop productivity is assumed to increase from 2.2 t ha−1 to 3.7 t ha−1 for rice, from 2.6 t ha−1 to 6.6 t ha−1 for corn, from 0.05 t ha−1 to 0.44 t ha−1 for pulses, and from 70 t ha−1 to 75 t ha−1 for sugarcane for the NDC and low-carbon futures (GoI 2017b). Hence, the improvement in agricultural WUE is due to a combination of higher yields and a shift to water-efficient irrigation techniques. The model simulation shows a WUE improvement from 16% to 55% for rice, from 14% to 53% for wheat and from 13% to 53% for sugarcane in 2050 for the NDC and low-carbon scenarios, compared to the year 2000 (table D1).
The power mix shifts from diesel to energy-efficient electric and solar pumps due to the application of stringent government policies in the alternate futures. The decrease in water demand (40%–45% of 2050 BAU) in the low-carbon futures is driven by: a) a shift to efficient micro-irrigation technologies and b) the application of improved WUE measures to crops, such as rice, sugarcane, fruits, and vegetables. However, it can be seen that the current WUE is not sufficient, especially in case of extreme events, such as droughts 21 .
3.1.3. Power
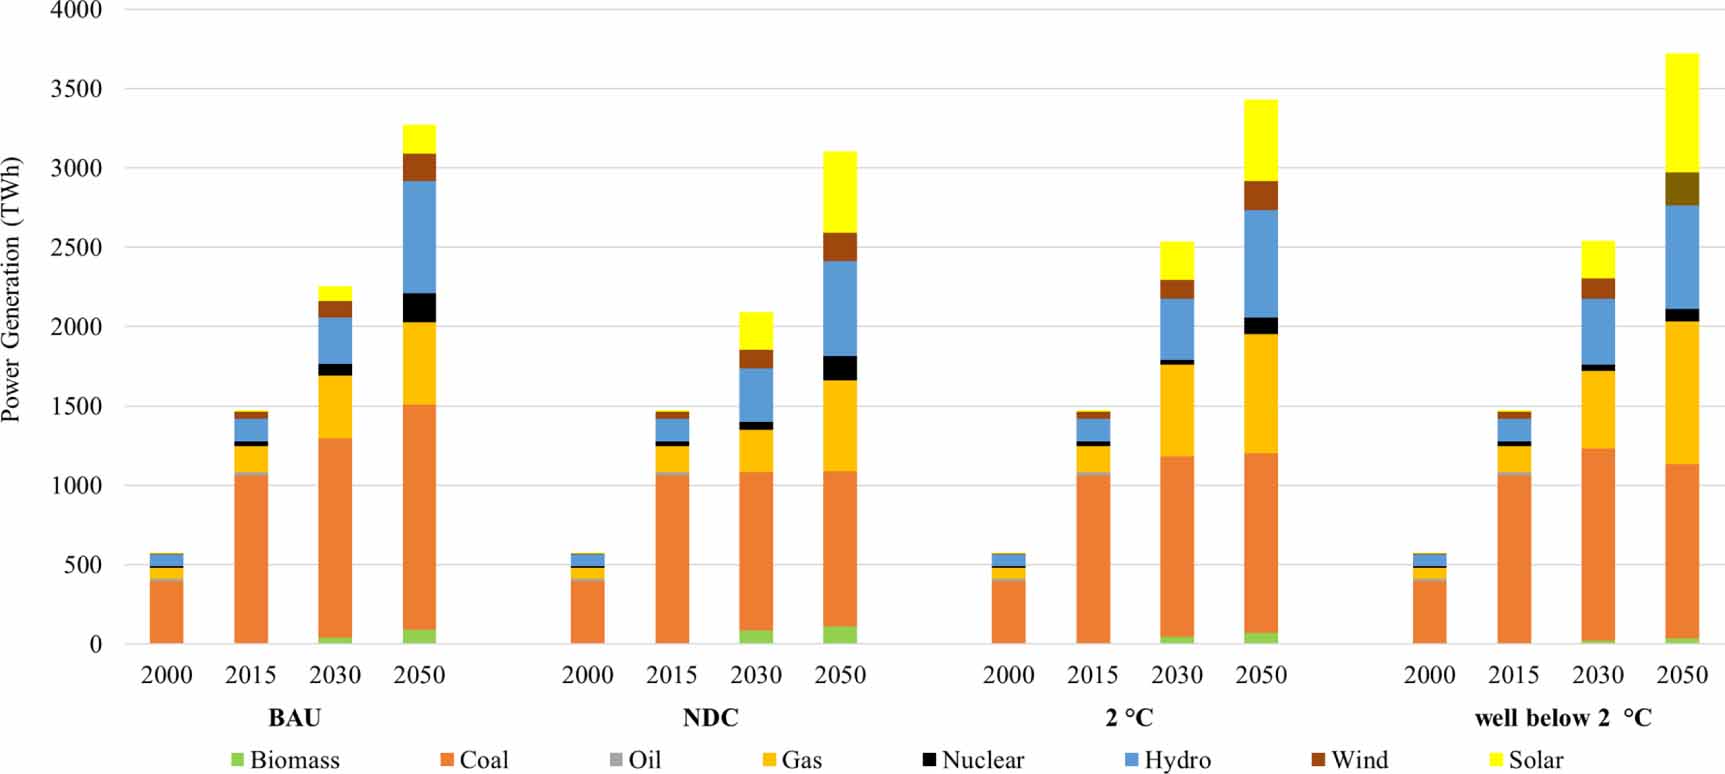
Figures 5 and 6 show the water demand for the power sector and the power generation mix in the BAU, NDC, and low-carbon futures, respectively. The differences between the scenarios are largely a consequence of shifts in the mix of technology generations, the selection of cooling technologies used, and the penetration rate of power production. These are endogenously determined by the model, based on sectoral electricity end-use demand, technology, and resource (energy, water) parameters.
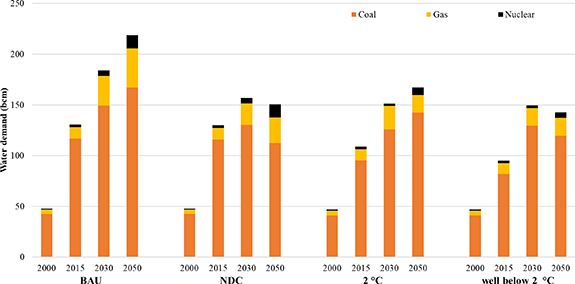
Figure 5. Water demand in the power sector under BAU, NDC, and low-carbon futures.
Download figure:
Standard image High-resolution image
Figure 6. Power generation mix under BAU and alternate futures.
Download figure:
Standard image High-resolution imageThere is a rise in overall water demand in BAU until 2050; however, a decrease in demand is observed under the NDC after 2030 due to: a) a shift to natural gas and renewables, and b) a switch from once-through cooling to efficient closed-loop and dry-cooling systems. The observed rises in water demand in the 2 °C and 'well below 2 °C' scenarios for 2030 correspond to an increase in CCS and Bioenergy with Carbon Capture and Storage (BECCS) in the power technology mix. The share of CCS retrofitted coal-power capacity ranges from 37% to 55%, while for dry-cooling systems, it is 9%–10% in the low-carbon futures.
3.1.4. Industry
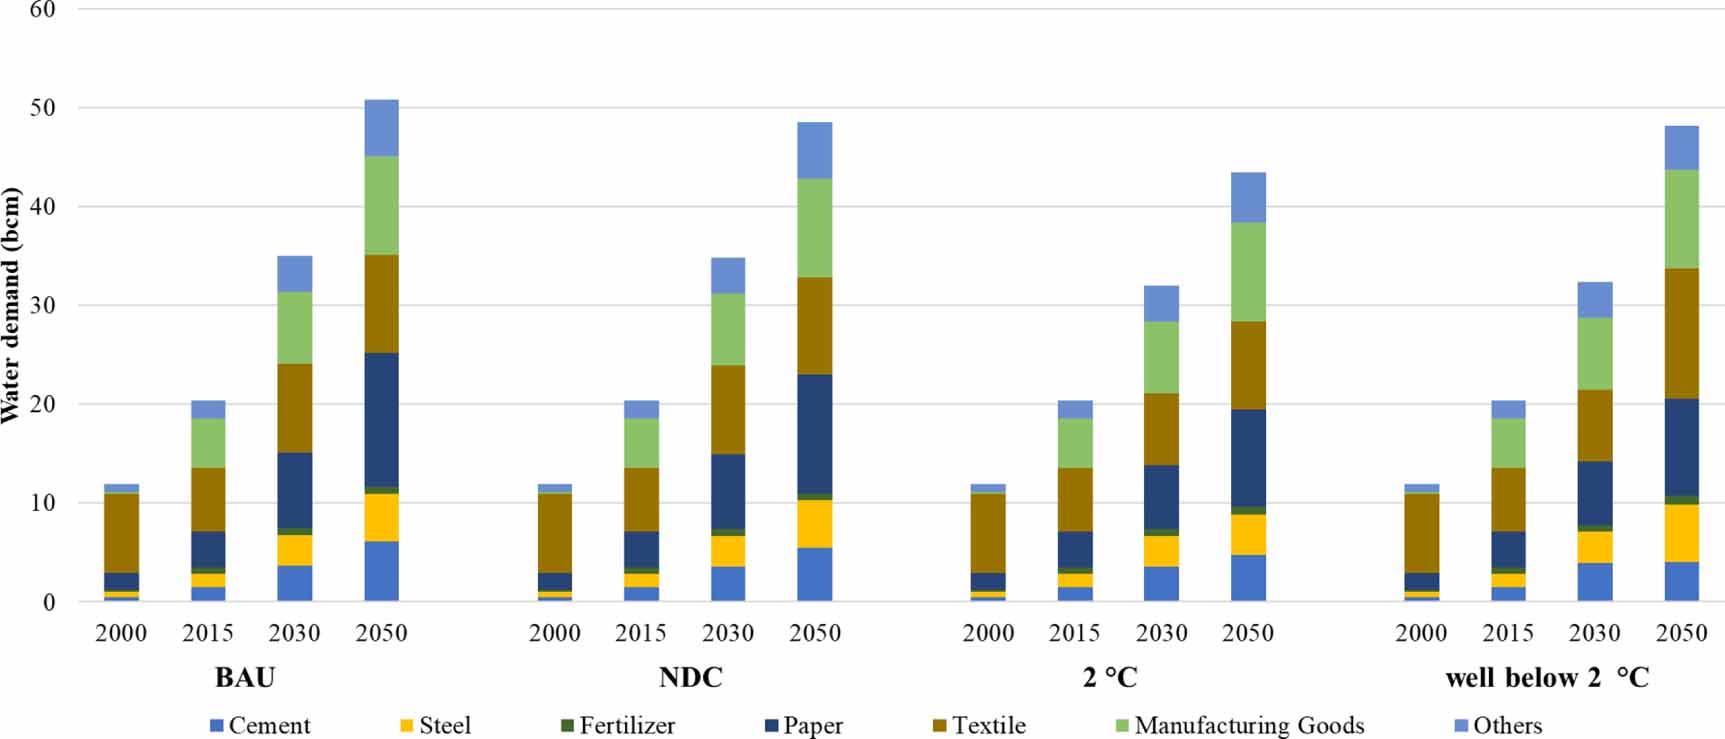
In the industrial sector, major water-intensive industries include textiles, paper and pulp, steel, and cement (figure 7). There is an increase in demand in the 2 °C scenario due to CCS in the steel and cement industries. However, an overall improvement is observed because of WUE (autonomous efficiency parameter), in particular, in the textile, paper, cement and steel industries, which ranges from 4% to 60%, depending on the industry and the type of technology used.

Figure 7. Water demand in industrial sectors in the BAU and alternate futures.
Download figure:
Standard image High-resolution image3.2. Impacts of water constraint on water demand and energy demand
3.2.1. Water demand
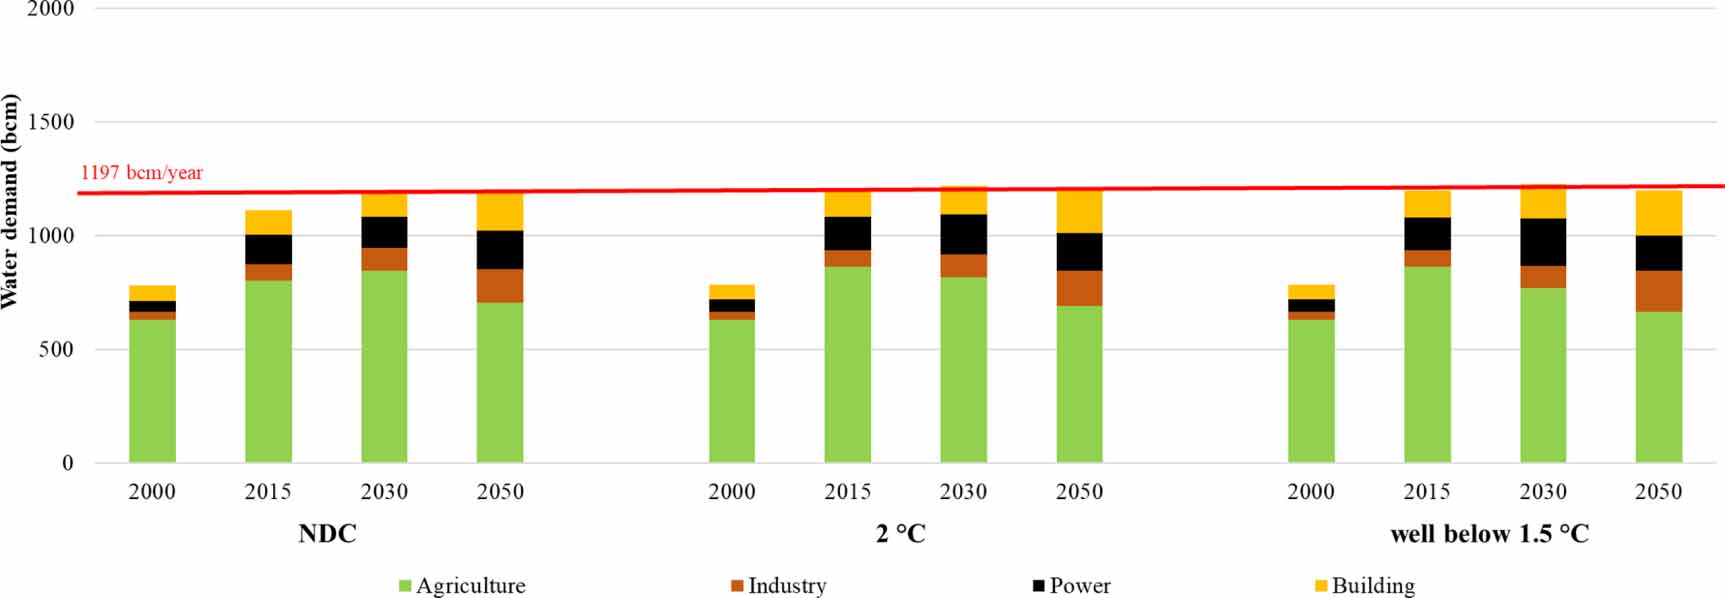
The application of a water-supply limit (1197 bcm) as a constraint on these water-energy systems was simulated to capture the water stress at a national level and to estimate its subsequent impact on final water demand in the major water-intensive sectors (figure 8). Agriculture (figure 9) is observed to experience the greatest impact, followed by the power sector, compared to 'without constraint' water-demand scenarios.
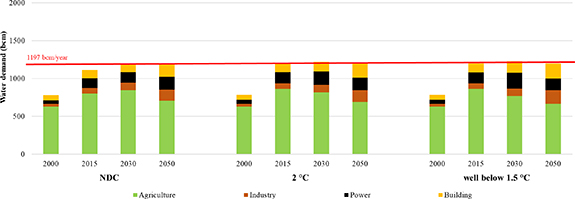
Figure 8. Water demand in the water-constraint scenario in major sectors in the NDC and alternate futures.
Download figure:
Standard image High-resolution image
Figure 9. Water demand in normal and water-constrained (WC) agricultural scenarios.
Download figure:
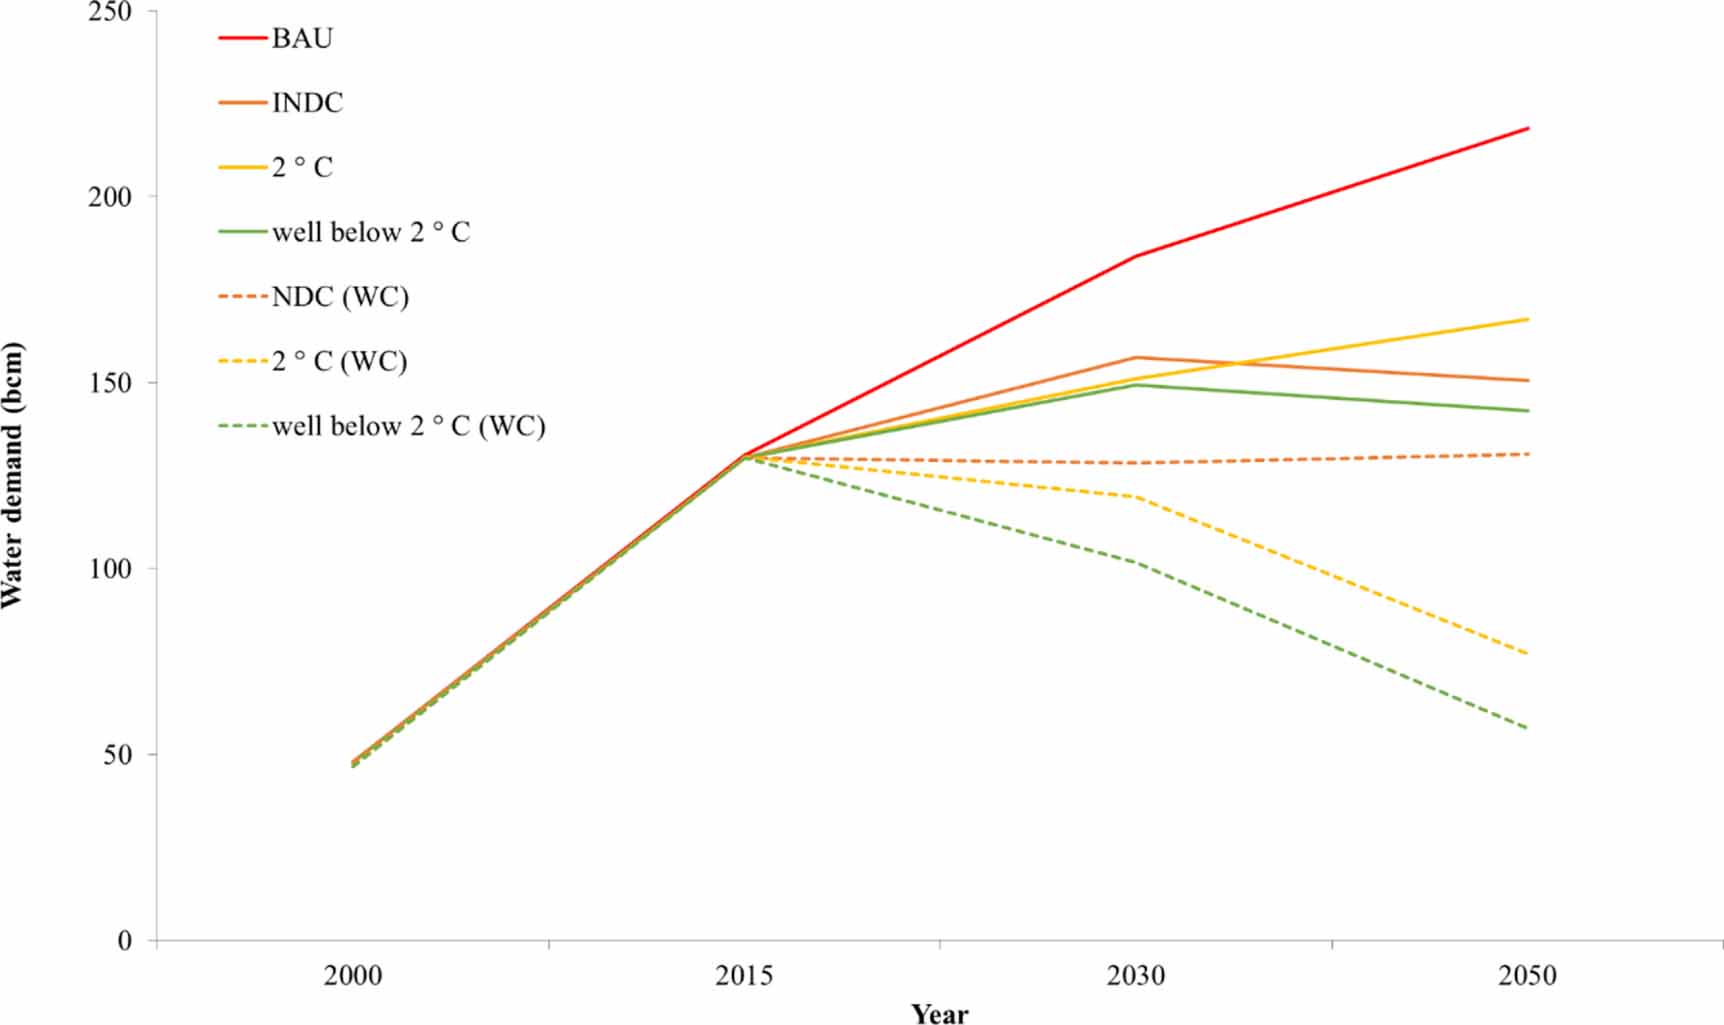
Standard image High-resolution imageThe agricultural water share decreases from 80% of the total demand in 2000 to 59% in the NDC scenario, and to 56%–58% in the low-carbon futures. Rice and sugarcane will be the most-impacted crops in the water-constrained futures (figure 10). Rice, wheat, and sugarcane became more water efficient (table D2) as the model switched to solar PV combined with micro-irrigation systems and the technical autonomous efficiencies were improved over the same time frame to reduce water demand.
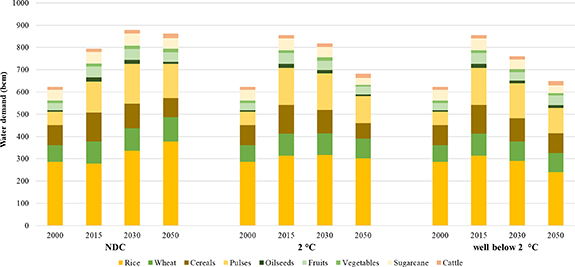
Figure 10. Water demand in the water-constrained agricultural sector in the NDC and alternate futures.
Download figure:
Standard image High-resolution image3.2.2. Impact on power generation
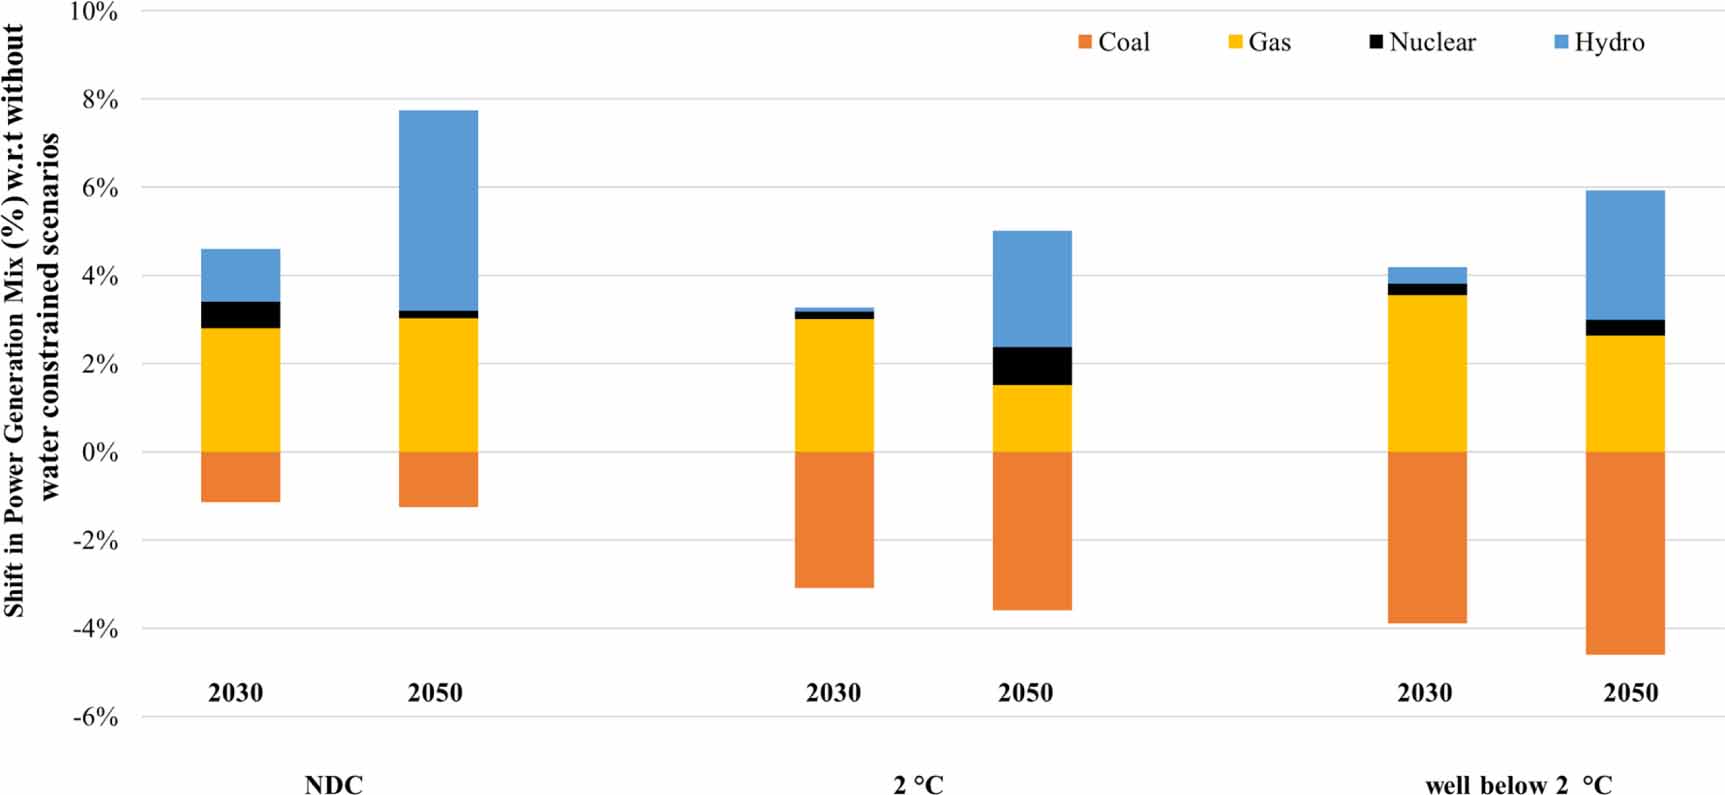
The power sector's water share increases from 6% in 2000 to 13%–15% in the NDC and alternate futures in 2050. However, the overall water demand (figures 11 and 12) decreases by 20% in the NDC water-constrained (WC) scenario, and by around 50% in the low-carbon futures, compared to the non-water-constrained scenarios (figure 5). The water-constrained scenario impacts electricity demand in the agricultural, power and industrial sectors. During high and extreme water stress conditions, electricity generation shifts from coal to natural gas, hydro, and nuclear (figure 13). In the WC futures, the share of CCS technologies decreases to 8%–14% of the generation capacity, while that of the dry-cooling systems increases to 42%–49% in 2050. Additionally, the use of recycled water increases by 15%–70% in the NDC and low-carbon futures.

Figure 11. Water demand in the power sector in water-constrained (WC) and non-WC scenarios.
Download figure:
Standard image High-resolution image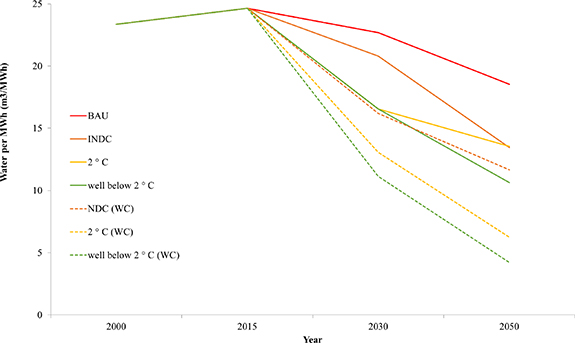
Figure 12. Water demand per MWh in the power sector in the water-constrained (WC) and non-WC scenarios.
Download figure:
Standard image High-resolution image
Figure 13. Shift in the power generation mix in the NDC and alternate futures (compared to the non-water-constrained scenarios, figure 6).
Download figure:
Standard image High-resolution image4. Discussion
4.1. Key insights
4.1.1. The need to increase the water supply (in the non-water-constrained scenarios)
All the (non-water-constrained) scenarios depict a rise in water demand that exceeds the water-supply limit. This indicates the need to increase India's water supply by at least 200–400 bcm (figure 4) in the NDC and alternate futures through measures such as installing additional storage, recycling, desalination, and water harvesting. Long-term strategies need to be planned, developed, and implemented at national, state, and local levels in order to avoid water-stress conditions. This depends not only on the development and implementation capabilities of the state and local governments, but also consideration of the increase in haphazard land-use change due to increasing urbanization.
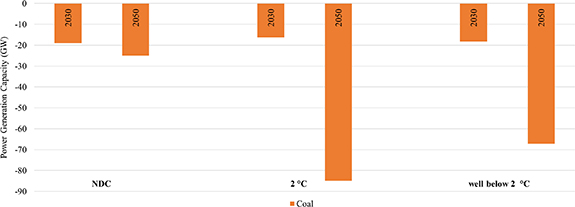
4.1.2. Stranded coal assets (in the water-constrained scenarios)
With more than ten partial and full drought years between 2000 and 2020, the increasing competition for water in the major water-intensive sectors has become apparent. Figure 14 presents the stranded coal capacity, in particular, coal-fired plants retrofitted with CCS and BECCS in the water-constrained scenarios in 2030 and 2050. This mirrors reality, in which acute water shortages have led to coal power-plant shutdowns (ranging from a week to six months) in many parts of India. The frequency of such occurrences will increase, especially during extreme events, such as droughts. Stranded power-plant shutdowns have resulted in revenue losses 22 for coal-based power plants. In the WC scenarios, the estimated revenue losses for these assets may amount to about 9–29 million USD per day in 2030 and 15–127 million USD per day in 2030.
Figure 14. Stranded coal assets in water-constrained futures in the NDC and low-carbon futures in 2030 and 2050 (compared to the non-water-constrained scenarios).
Download figure:
Standard image High-resolution image
4.1.3. Impacts on system costs and future investments
The agricultural sector conserves more than 80% of the cumulative water saved, while the power sector saves 7%–9% in the water-constrained scenarios. This mainly takes place through (a) incremental improvements in water-use efficiency measures and (b) transitions towards low-water, low-carbon, and/or waterless technologies. Shifting 20–25 million hectares of cultivable land to MIS will require an investment of about 700–1500 USD ha−1 depending on geography, climate, soil conditions, technologies (sprinkler or drip), and crops (food grains, other crops) 23 . While installing retrofitted CCS leads to a cost increase of 25%–36%, the addition of dry cooling technologies will require an investment of about 123 million USD (∼11 GW) in the NDC scenarioand around 300–600 million USD (∼29–50 GW) in the low-carbon futures. The marginal cost of installing dry cooling technologies 24 in power plants to save water (m−3) is higher than the cost of installing MIS with solar PV in the agricultural sector.
4.2. SDG-NDC linkages
The Indian government stresses the priority of development goals, followed by climate action. This study integrates water, energy, and carbon systems to model SDG-NDC linkages. Implementing NDC policies will result in the achievement of targets under SDG7, SDG11, SDG12, SDG13, and SDG15 25 . However, this may put stress on water resources (SDG6) without WUE measures. Achieving SDG targets can help India to meet resource-use efficiency goals, in addition to the NDC and Paris Agreement goals (as these targets are a subset of SDG13). Table 3 presents the impact of water (SDG 6) on the NDC and low-carbon pathways. This study shows that the NDC and Paris Agreement goals can be achieved, even under WC scenarios. The installation of CCS and BECCS in the low-carbon futures reduces emissions in the non-WC scenarios, while a shift from coal to natural gas, hydro, and nuclear power, in addition to implementing more stringent WUE measures, results in the attainment of the same decarbonization goals.
Table 3. Impact of SDG 6 (water) on NDC goals and the Paris Agreement.
| NDC | 2 °C | Well below 2 °C | NDC (water constrained) | 2 °C (water constrained) | Well below 2 °C (water constrained) | |
|---|---|---|---|---|---|---|
| NDC Goal 3 (Unconditional) Reduce the emissions intensity of its GDP (GHG/GDP) by 33%–35% by 2030 from the 2005 level. | 46.8% in 2030 | 37.3% in 2030 | 39.4% in 2030 | 45.7% in 2030 | 39.8% in 2030 | 42.2% in 2030 |
| NDC Goal 4 (Conditional) Non-fossil fuel share of cumulative power generation capacity to reach 40% by 2030 | 41% in 2030 (50% in 2050) | 45% in 2030 (48% in 2050) | 43% in 2030 (53% in 2050) | 44% in 2030 (54% in 2050) | 46% in 2030 (56% in 2050) | 44% in 2030 (60% in 2050) |
| Impact of the Paris Agreement goals' cumulative carbon budget (btCO2) | 143 | 135 | 113 | 126 | 112 | 107 |
4.3. The need for integrated policy coherence
An integrated approach is co-beneficial in terms of resource efficiency in both the water and energy sectors. Current national policies, as observed in the BAU and NDC scenarios, mean that the current WUE target is not sufficient to move towards low-carbon pathways. For example, the use of solar pumps does not necessarily decrease the amount of water extracted; however, efficient use of water does conserve the total amount of energy used. This modelling exercise demonstrates that the installation of solar PVs should be accompanied by micro-irrigation technology measures to achieve maximum resource-use efficiency. Additionally, regressive policies, such as highly subsidized electricity prices, need to be reformed to reduce the over-exploitation of water. Crop diversification needs to be promoted along with water-efficient micro-irrigation technologies, in particular, in water-scarce regions, in addition to the growth of water-scarce (or water-efficient) crops. Similarly, both central and state governments need to mandate the installation of dry-cooling systems instead of new closed-loop systems in water-stressed regions. This option will result in an overall high energy penalty and implementation costs 26 . The low-carbon scenarios indicate that the installation of CCS and BECCS needs a more detailed local-level analysis, as it will impact future water and biomass demands. In the industrial sector, a combination of slab water prices and a building-water market may encourage stakeholders to move towards recycling and zero-waste pathways. Energy efficiency schemes such as 'perform, achieve, and trade' can be recommended for water-intensive sectors to improve their WUE.
5. Conclusions
This study assesses India's water demand and the impacts of water-constrained and carbon-constrained scenarios on national water–energy–land–environment systems in the NDC and low-carbon futures. Using a bottom-up analysis, we studied the SDG-NDC linkages and their impacts on the water–energy nexus for India at a sectoral level. This study estimates that policy measures taken in the NDC scenario can cumulatively save up to 14 27 bcm of water, while low-carbon scenarios can save 20–21 bcm of water between 2020 and 2050, compared to BAU. In a WC future, the NDC and low-carbon futures can save 28–30 bcm of water. In the agricultural sector, efficient water systems can help save water by more than 80% compared to BAU for all scenarios between 2020 and 2050. In the power sector, a shift in the technology mix towards water-efficient coal, natural gas, and comparable water-free renewable technologies can cumulatively save about 7%–9% (28–30 bcm) in the water-constrained scenario. Overall, the marginal cost of installing micro-irrigation systems is lower, with the added benefits of increased crop yield (food security) in addition to water savings (water security) and energy savings (energy security).
This study emphasizes the need to increase the current water supply and the need to prioritize water use at both national and state levels. This is dependent not only on the quantity of water resources available in any region but also on how each of the sectors extracts water, to what extent, and the way that they supply, use and consume it. Water demand is likely to vary across states because: (a) each state varies in terms of its physiography, climate, and land and water resources, and (b) there are regional differences in availability, accessibility, affordability, capital investment, governance structures, and regulatory environments. These differences lead to regional variations in the availability and accessibility of water as a resource.
India will be able to achieve its SDG and NDC goals by 2030, but these targets are not enough to reach its objective to be a climate leader and contribute to the Paris Climate Change Agreement. India will need to deepen its SDG6 targets in order to match its revised NDCs and Paris Agreement goals and move towards low-carbon pathways.
Acknowledgments
This study was partly funded by Exploring National and Global Actions to reduce Greenhouse gas Emissions project (ENGAGE) (European Union's Horizon 2020 research and innovation programme under Grant Agreement No. 821471); Linking Climate and Development Policies—Leveraging International Networks and Knowledge Sharing (CDLINKS) (European Union's Horizon 2020 research and innovation programme under Grant Agreement No. 642147); Modelling and Informing Low Emission Strategies (MILES) under DG CLIMA (No. 21.0104/2014/684427/SER/CLIMA.A.4) and Indian Institute of Management Ahmedabad. We would like to acknowledge the National Institute for Environmental Studies for supporting the AIM/End-use model. Finally, we sincerely thank the guest editors and anonymous reviewers for their critical feedback which has helped us significantly improve the paper.
Data availability statement
The data that support the findings of this study are available upon reasonable request from the authors.
Footnotes
- 6
3.7% of the 2000 annual water demand or 2.5% of the 2015 annual water demand.
- 7
In this study, 'water demand' is specified as the total amount of 'water withdrawal' from various resources for each sector. It can include water from primary renewable and secondary freshwater resources, as well as water from the over-abstraction of renewable groundwater or withdrawal from fossil groundwater, direct use of agricultural drainage water, direct use of (treated) wastewater, and desalinated water. It does not include in-stream uses, which are characterized by a very low net consumption rate, such as recreation, navigation, hydropower, inland capture fisheries and so on.
- 8
In this study, 'water supply' suggests the total amount of 'utilizable water' from various resources.
- 9
'Utilizable water supply' is subset of 'total available water'. 'Internal Renewable Water Resources Potential'(IRWRP) considers the long-term average annual flow of rivers and the recharging of aquifers by endogenous precipitation. India's IRWRP has been estimated to be 1869 bcm annually, out of which, 1100–1197 bcm is considered to be 'utilizable water supply' (FAO 2015).
- 10
2000, 2003, 2004, 2006, 2007, 2010, 2012, 2015, 2016, and 2018.
- 11
Zhang et al (2017) classified drought years into four types, based on the drivers, which include meteorological, hydrological, soil moisture, and vegetation.
- 12
Natural systems [Applying an upper water supply limit of 1123 bcm per year].
- 13
These include SDG 7 (Affordable and Clean Energy), SDG 15 (Life on Land), SDG 2 (Zero Hunger), SDG 11 (Sustainable cities and communities), SDG 6 (Clean Water and Sanitation), SDG 17 (Partnerships for goals).
- 14
SDG 6: clean water and sanitation.
- 15
These include SDG 2 (zero hunger), SDG 3 (good health and well-being), SDG 6 (clean water and sanitation), SDG 7 (affordable and clean energy), SDG 8 (decent work and economic growth), SDG 12 (responsible consumption and production), SDG 14 (life below water), SDG 15 (life on land).
- 16
Development policies, SDG 2015, NDC (2015).
- 17
The sectoral water-use coefficient does not capture the sectoral and sub-sectoral granularity of technologies and resources (energy and water).
- 18
The AIM/End-use model has been widely used to capture energy, environmental, and material systems at the national (especially in Asian countries) and global levels since its inception in the early 1990s. The novelty of this study is the inclusion of a water module for the first time at a national level with technological granularity. It captures water and energy-intensive sectors from a systems perspective. This work and module is yet to be included in the AIM/End-use global model.
- 19
Appendix A, figure 1 provides the research framework for the current study.
- 20
The upper water-supply limit presented in the literature.
- 21
Presented and discussed under water-constrained scenarios (section 3.2 of this paper).
- 22
Shutdown of 1 GW of coal power plant leads to a financial loss of USD 0.6–1.5 million per day (Vishwanathan et al 2018b).
- 23
Water saved using a drip irrigation system on one hectare can be used to irrigate two more hectares of land.
- 24
The capital cost of a dry cooling system is twice that of a closed looped system, while the operational costs are two-thirds of those of the closed-loop system.
- 25
Details of the SDG-NDC linkages used in this study are presented in appendix B. SDG 7 (affordable and clean energy), SDG 11 (sustainable cities and communities), SDG 12 (responsible consumption and production), SDG 13 (climate action), and SDG 15 (life on land).
- 26
- 27
3.7% of the 2000 annual water demand or 2.5% of the 2015 annual water demand.