

Abstract
New estimates of greenhouse gas (GHG) emissions from the food system were developed at the country level, for the period 1990–2018, integrating data from crop and livestock production, on-farm energy use, land use and land use change, domestic food transport and food waste disposal. With these new country-level components in place, and by adding global and regional estimates of energy use in food supply chains, we estimate that total GHG emissions from the food system were about 16 CO2eq yr−1 in 2018, or one-third of the global anthropogenic total. Three quarters of these emissions, 13 Gt CO2eq yr−1, were generated either within the farm gate or in pre- and post-production activities, such as manufacturing, transport, processing, and waste disposal. The remainder was generated through land use change at the conversion boundaries of natural ecosystems to agricultural land. Results further indicate that pre- and post-production emissions were proportionally more important in developed than in developing countries, and that during 1990–2018, land use change emissions decreased while pre- and post-production emissions increased. We also report results on a per capita basis, showing world total food systems per capita emissions decreasing during 1990–2018 from 2.9 to 2.2 t CO2eq cap−1, with per capita emissions in developed countries about twice those in developing countries in 2018. Our findings also highlight that conventional IPCC categories, used by countries to report emissions in the National GHG inventory, systematically underestimate the contribution of the food system to total anthropogenic emissions. We provide a comparative mapping of food system categories and activities in order to better quantify food-related emissions in national reporting and identify mitigation opportunities across the entire food system.
Export citation and abstract BibTeX RIS

Original content from this work may be used under the terms of the Creative Commons Attribution 4.0 license. Any further distribution of this work must maintain attribution to the author(s) and the title of the work, journal citation and DOI.
1. Introduction
Agriculture is a significant contributor to climate change, in addition to being one of the economic sectors most at risk from it (FAO 2016, Mbow et al 2019). Greenhouse gas (GHG) emissions from on-farm production (i.e. within the farm gate) and related land use change contribute about one-fifth to one-quarter of total emissions from all human activities (IPCC 2019). This contribution is even more striking for individual gases. For instance, crop and livestock production within the farm gate contributes more than 50% of the methane (CH4) and 75% of the nitrous oxide (N2O) emissions from human activity globally (FAO 2020). Emissions from pre- and post-production activities, such as fertilizer manufacturing, food transport, processing, retail and waste disposal, increase the magnitude of these already relevant impacts. Rosenzweig et al (2020) estimated that the food system generates 20%–40% of the anthropogenic emissions from all economic activities, and Crippa et al (2021) recently quantified the contribution as about one-third of total anthropogenic emissions. These large contributions further highlight the potential of food-related GHG mitigation strategies, providing impetus for innovative approaches in food supply chains, consumption, and waste processes in connection with farm and landscape level mitigation (Smith et al 2014, Niles et al 2018, Mbow et al 2019). It is likewise recognized that dietary choices and consumption patterns are critical to reduce food system emissions, through their impact on supply-side activities (Dalin and Outhwaite 2019, Hayek et al 2020, Willett et al 2019).
The quantification of emissions from crop and livestock activities and associated land use is well established in global inventories, enabling detailed analysis at the country, regional and global levels (e.g. Smith et al 2014, Tubiello et al 2013, IPCC 2006, FAO 2021a). However, similarly detailed emissions information about other critical components of the food system are only recently becoming available (e.g. Crippa et al 2021). For this reason, previous quantification of emissions from the food system largely relied on relatively simplified approaches (i.e. Poore and Nemecek 2018, etc). A dearth of information at the country level currently limits the effectiveness of food system mitigation strategies at the national and regional scale, where they are most important (Loboguerrero et al 2019, Garnett 2011).
Food is well recognized as a central issue in climate change mitigation. Indeed, the majority of the mitigation commitments communicated by countries to the UN Framework Convention on Climate Change (UNFCCC) via Nationally Determined Contributions (NDCs), include agriculture and land use as strategic priorities (e.g. Crumpler et al 2020). The analysis of food system contribution to national GHG emissions within the NDCs, however, is very difficult, hampering the identification and development of effective mitigation options (e.g. Rosenzweig et al 2021, this special issue). For instance, the IPCC 'agriculture' sector used in the National GHG inventory (NGHGI) covers only the non-CO2 emissions generated within the farm gate. Important CO2 emissions on the farm, for instance from drained organic soils on agricultural land (Conchedda and Tubiello 2020, Cooper et al 2020) or from on-farm energy use, are not accounted for in this inventory category. Additionally, large amounts of CO2 emissions, which stem from processes at the conversion boundaries between farmland and natural ecosystems, including emissions from tropical deforestation and tropical peatland fires (Prosperi et al 2020), are also excluded from agriculture in NGHGI accounting.
These food-related CO2 emissions are instead reported by countries within the 'land use, land use change and forestry (LULUCF)' sector of their NGHGI (IPCC 2003). This typically leads to underestimates of food system emissions at the national level, since the latter can be offset by carbon sinks in forest land under current UNFCCC accounting rules. Importantly, food system emissions can be under-reported whenever countries choose to report their national total emissions 'without LULUCF'.
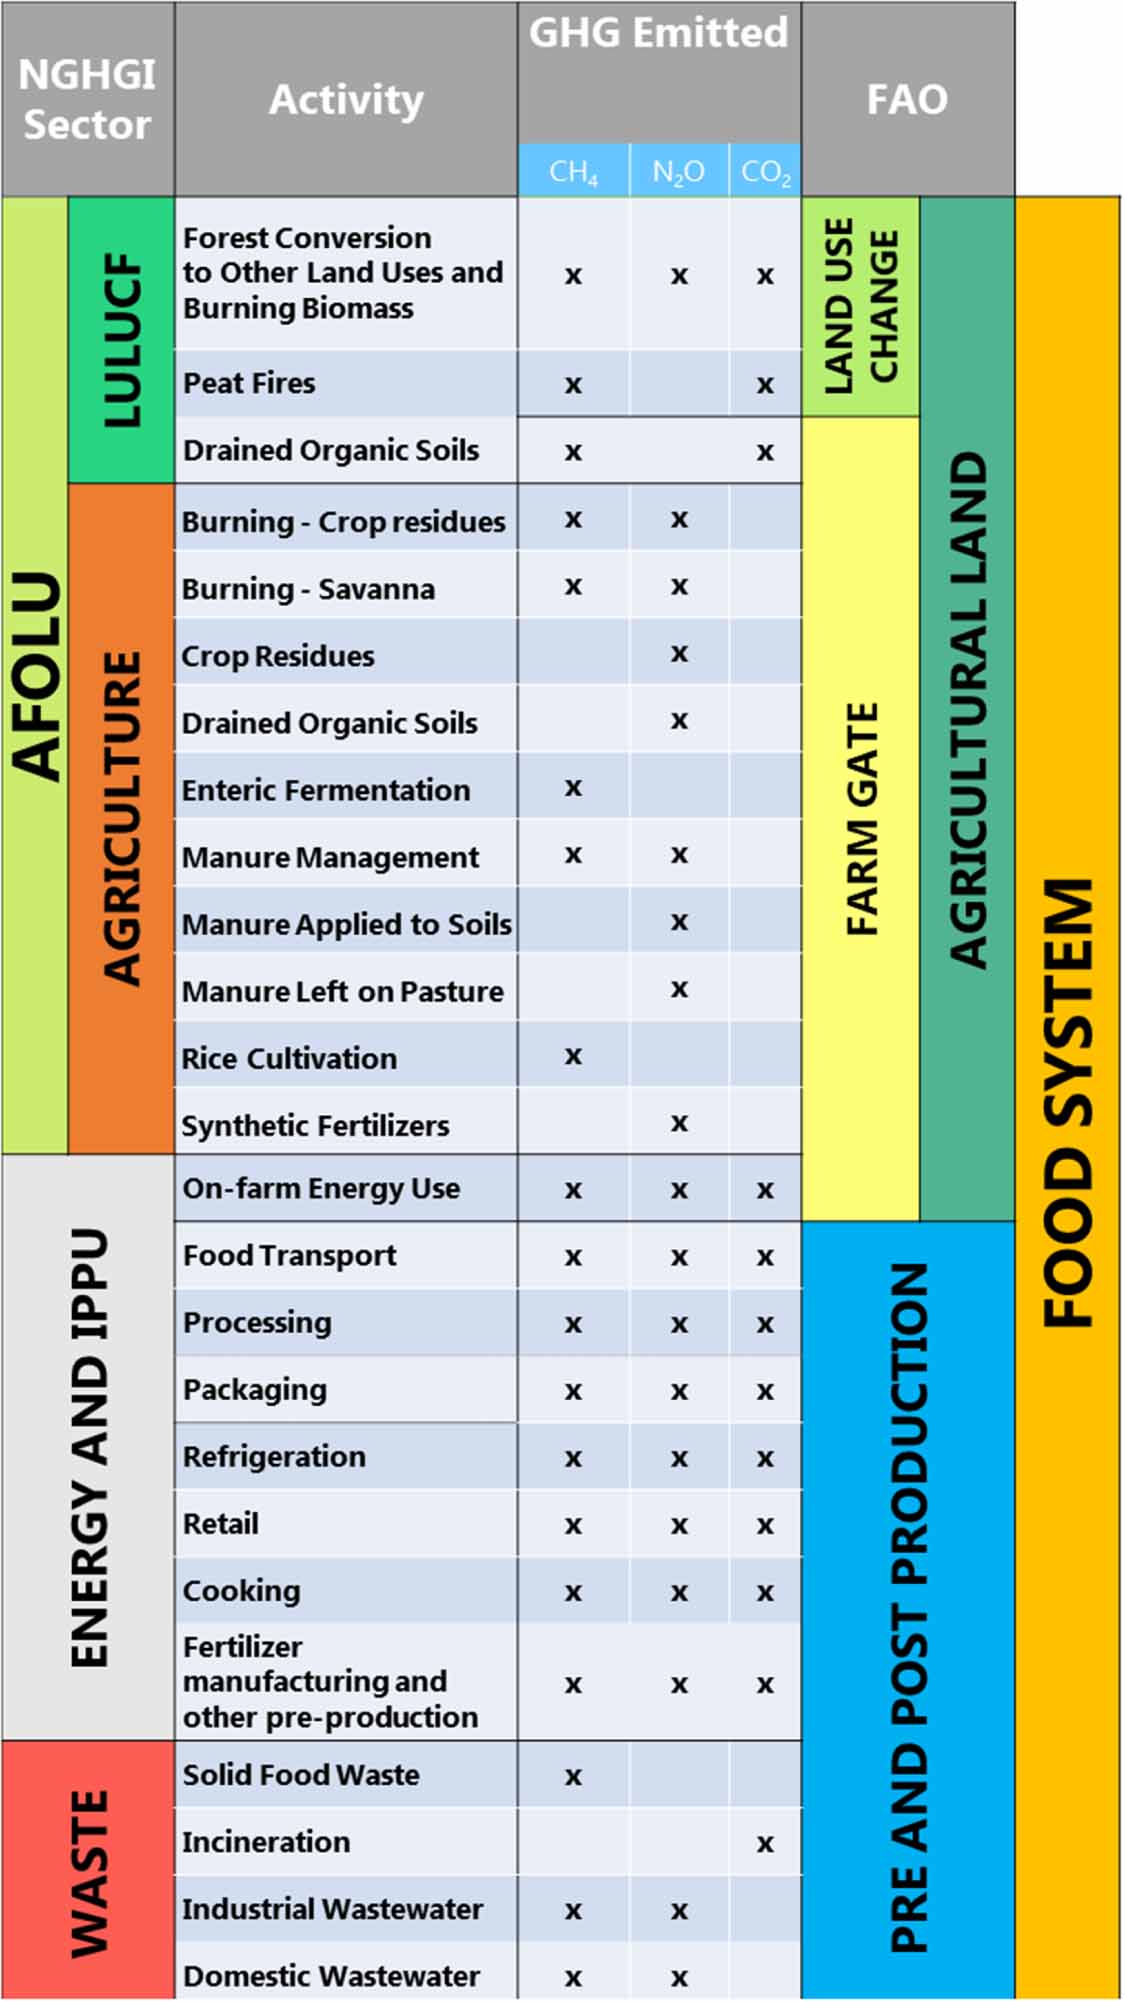
We develop a comparative mapping table of food system categories and activities in order to enable countries to fully account for their food system emissions within their NGHGI reporting, while respecting at the same time the relevant IPCC sector terminology (figure 1). We apply this mapping table to develop a fuller characterization of food system emissions at the country level, over the period 1990–2018, covering both CO2 and non-CO2 emissions within the farm gate, land use and land use change, food transport and food waste disposal. The work presented herein builds upon and improves the relevant recent work on this subject. It adds country-level details and technical sub-sector descriptions to the global synthesis of Rosenzweig et al (2020). It extends the recent country-level database and analysis of Crippa et al (2021), which extended only to the year 2015, additionally incorporating more recent data on food-relevant land use change components, specifically in relation to forests (Tubiello et al 2021) and peatland fires (FAO 2021a). We complete our accounting with regional and global estimates of emissions from energy use in food supply chains. Finally, we discuss how the new set of food system categories can help inform food-related mitigation strategies.
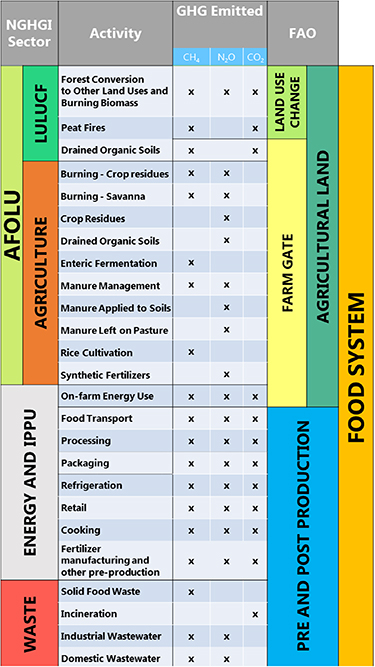
Figure 1. Comparative mapping between reporting categories in NGHGIs, organized by IPCC and FAOSTAT definitions used for food system accounting in this work. IPCC definitions align to relevant IPCC Guidelines (2003, 2006), including the Wetland Supplement (IPCC 2014) for peat fires. IPCC aggregates include AFOLU, LULUCF and IPPU.
Download figure:
Standard image High-resolution image2. Methods
The data for this work were largely taken from existing information on sectoral emissions produced by FAO (2020). The agriculture and LULUCF emissions data were originally developed by Tubiello et al (2013) and are updated annually by FAO to inform relevant international assessments (e.g. FAO 2021b, IPCC 2014, 2019). The non-agricultural emissions cover the IPCC sectors Energy, Industrial Production and Product Use (IPPU), and Waste (Gütschow et al 2016, 2021). These categories align with NGHGI reporting and the NDC process, with FAO estimates made at Tier 1 of the 2006 IPCC Guidelines (2006).
2.1. Comparing IPCC and NGHGI categories to a food system approach
In order to facilitate identification of food-related mitigation strategies within national reporting to UNFCCC, we developed a rather simplified mapping table that compares IPCC, NGHGI and food system categories across the same set of activities (figure 1). The core component of this comparison links emissions from NGHGI sectors Agriculture and LULUCF (collectively known as AFOLU, agriculture, forestry and other land uses) to processes located on the farm, on common grazing land or at the land use change boundary, i.e. where conversion to agricultural land takes place. To this end, we use the FAO definition of agricultural land to set the boundary between agricultural production systems from everything else in the food system, e.g. food supply chains, preparation for consumption (notably cooking), and waste disposal processes. Note that the FAO land use category Agricultural Land corresponds conceptually to the sum of IPCC land use categories Cropland and Grassland.
2.2. Food system components on agricultural land
Within agricultural land, our mapping distinguishes between emissions within the farm gate (on-farm production) and emissions from the conversion of natural ecosystems to agriculture. Specifically, for on-farm production, we include the CH4 and N2O emissions from crop and livestock production processes on agricultural land, such as enteric fermentation, fertilizers application, rice cultivation and peatland drainage. These are reported under the IPCC Agriculture sector of the NGHGI.
We also include the Cropland and Grassland land use sub-components of LULUCF as part of the farm gate estimates, i.e. CO2 and non-CO2 emissions located either on the farm or on common grazing land. Conversely, LULUCF emissions from the conversion of natural ecosystems to Cropland and Grassland (e.g. deforestation, peat fires) are included in Agricultural land, but accounted for outside of the farm gate. Specifically, deforestation of primary and secondary forest is closely linked to land clearance for crop cultivation and livestock rearing (Tubiello 2019).
Tropical peat fires are likewise linked to the conversion of tropical peat forests, which may be drained and burned to make room for oil palm plantations or other agricultural activities. Previous work by FAO had considered all peat fire emissions, totaling some 1 Gt CO2eq yr−1 as food-related (Rossi et al 2016, Tubiello 2019). However, close agreement of independent modeling estimates and field reporting is limited to south-east Asian countries (New York Times 2019, Prosperi et al 2020). For this reason, and in agreement with recent FAO (2021a) work, peat fires emissions of relevance to the food system were limited to those estimated for south-east Asia (Indonesia, Malaysia, Brunei).
The explicit association of land use change emissions to agricultural land is an important feature of our new categorization of food system activities. It facilitates the identification and separate accounting of food-related LULUCF emissions that might otherwise be hidden by carbon removals on forest land within NGHGI reporting. This mapping was first proposed for the air emissions tables of the System for Environmental Economic Accounting, known as SEEA (FAO and UNSD 2019).
Finally, our new categorization of food system activities adds emissions from on-farm energy use (FAO 2020) to Agricultural land. These emissions are reported by countries under the Energy sector of in the NGHGI. They cover direct energy use in food production (e.g. tractors and other machinery, irrigation pumps, fishing vessels) and indirect emissions offsite, e.g. from electricity production.
2.3. Food system components beyond agricultural land
Relevant data on GHG emissions generated on agricultural land were available in FAOSTAT with country detail over the period 1990–2018. In addition in this work, we developed new food system data, at the country level for the period 1990–2018, for: (a) 'domestic food transport,' defined as the sub-component of the IPCC Energy sector covering mostly CO2 emissions from commercial and household food transport; and (b) 'food waste disposal,' defined as the sub-sector of the IPCC Waste sector covering CH4 emissions from the decomposition of solid food waste in landfills, CO2 emissions from the incineration of food waste materials, and CH4 and N2O emissions from domestic and industrial wastewater management. Finally, we developed regional and global estimates of food system emissions from energy use in food supply chains, based on published work by FAO (2011). The following sections provide additional details on this new work.
2.3.1. Food waste disposal
We first estimated the mass of solid food waste disposed to landfills by country, by applying food waste data from the IPCC guidelines (2019) to solid waste destination data from the World Bank (Kaza et al 2018). A log-linear relationship between per capita solid waste disposal and per capita GDP was used to estimate historic solid food waste deposition in landfills (Thi et al 2015, Xue et al 2017, Singh et al 2018). The latter was used as input into a climate-sensitive first order decay model to estimate CH4 emissions from landfills in a given inventory year.
We also included estimates of food systems emissions from domestic wastewater, industrial wastewater and incineration by country and over the same period 1990–2018, while recognizing that these components are relatively small compared to emissions from solid food waste. The former consist of CH4 and N2O from sewage systems, waste treatment facilities, latrines, septic systems; from industrial wastewaters, generated in the production of alcohol, beer and malt, fish, meat and poultry, nitrogen fertilizer, starches, coffee, dairy, sugar, vegetable oils, wine, vinegar, and vegetable and fruit products. The latter consist of CO2 emitted from burning of plastic and rubber materials used in the food system. GHG emissions were estimated at IPCC Tier 1 emissions factors (2006, 2019). Full technical details for the computation and validation of food system waste disposal emissions are being presented elsewhere (Karl and Tubiello 2021a).
2.3.2. Domestic food transport
Emissions from food transport consist of CO2, CH4 and N2O from fuel combustion for domestic civil aviation, road transportation, railways, domestic water-borne navigation, and other transportation. We estimated these emissions by country and over the period 1990–2018, as a fraction of transport emissions reported by a version of the PRIMAP dataset with increased sectoral resolution (Gütschow et al 2021). Food transport activity data and emissions factors for the United States, China and the European Union—representing roughly 50% of world-total transport emissions, according to PRIMAP—were estimated with coefficients taken from published reports (USDA-ERS, EU-JRC 2015, Canning et al 2017, Song et al 2019). For all other countries we took the relevant coefficients from Crippa et al (2021). A more technical description of our work is described in Karl and Tubiello (2021b).
2.3.3. Energy use in food supply chains
Energy use in food supply chains, including fertilizer and equipment manufacturing, industrial food processing, packaging, refrigeration, and retail, is considered the largest contributor to CO2 emissions from the food system outside of the farm gate (FAO 2011). Note that we disaggregate food transport from supply chains in our estimates in order to avoid double-counting emissions. While work to generate country-level data for all supply chain stages is ongoing at FAO, we proceeded to compute global and regional estimates, in order to integrate the country level information available and produce a first-order assessment of emissions from the entire food system. To this end, we used existing estimates of emissions from food supply chains for the year 2008, which had been quantified globally and for developing and developed country groups by FAO (2011). We then estimated emissions from food supply chains for 1990 and 2018 by applying the 2008 proportion to total energy use, assuming for lack of any additional information, that it remained constant over the time period 1990–2018.
2.3.4. World population
Finally, we used world population data by country from FAOSTAT (FAO 2021b), aggregated at Annex I (AI), non-Annex I (NAI), and globally, to compute per capita food systems emissions indicators overall and by sub-components.
2.4. Limitations and uncertainty
While the efforts undertaken advance significantly existing knowledge on food system emissions, a number of limitations are identified. First, we used emissions from net forest conversion as a proxy for deforestation (Tubiello et al 2021) and designated them as conversion to agricultural land, whereas recent studies have estimated that only 80% of deforestation may be linked to agriculture globally (Carter et al 2018). We are thus likely overestimating the food-related land use change component. At the same time, use of the net forest conversion proxy systematically underestimates gross deforestation fluxes, potentially reducing bias. It should also be noted that we are not including forest sinks potentially generated on abandoned agricultural land, considering them outside of the production boundary in this analysis. Secondly, we did not consider possible carbon sinks on agricultural land, for instance those generated by tillage practice, despite the recognized role of reduced tillage or no-till as a carbon sequestration technique (Debska et al 2020, Feng et al 2020). Insufficient data coverage at national and regional scale limit such estimations currently. At the same time, we assumed that eventual removals over the study period were likely to be small compared to the land use emissions that were instead considered, i.e. those from peat drainage.
Third, the data used for on-farm energy use also included energy use in forestry and fisheries, although data for these latter categories are quite incomplete. This implies that we may be overestimating emissions from on-farm energy use, or at least that we should use them to cover the full range of emissions from the agriculture, forestry and fishing sector, once more complete data coverage is available from the original United Nations Statistics Division (UNSD) source. Furthermore, the emissions considered within the farm gate, for instance from fertilizers application or from energy use, include non-food production, for instance for fiber to bio-energy, which is assumed small compared to total use for food and feed production.
Fourth, available activity data at the country level for the new food system components computed herein, for instance in solid food waste or food-related transport, are quite poor compared to agriculture and land use data, pointing to overall uncertainties in these emission components that are larger than estimates for AFOLU.
Fifth, this accounting does not yet include a quantification of the GHGs emitted by food system processes beyond CH4, N2O, and CO2. For instance, emissions of hydrofluorocarbons from refrigeration and black carbon from solid fuel cookstoves may also be significant (Dickinson et al 2015).
Finally, the simple methods used to estimate emissions from energy use in supply chains, specifically the use of a fixed share to total energy emissions, may lead to overestimates earlier in the time series and underestimates in more recent years, considering that the actual energy use along supply chains tends to increase over time as economies develop (FAO 2011).
Importantly, it should be noted that the focus of this work is on domestic emissions, so that the food-related international transport component is missing. Applying the food share of domestic transport to global emissions from international bunkers indicates that this component, while of great importance to specific commodities and trade routes, may be small in relation to the global estimates quantified in this work.
The uncertainty in estimates related to emissions on agricultural land for Agriculture and LULUCF have been discussed elsewhere, pointing to overall uncertainties in emissions estimates of roughly 30%–50% (i.e. Tubiello et al 2013, 2021). For lack of additional information, these uncertainties are adopted herein for estimates across the food system. We note that the lower end of this range is consistent with uncertainties reported in Crippa et al (2021).
Next, we present results at the global level and by UNFCCC country grouping, i.e. AI, composed largely of developed economies, and NAI parties to UNFCCC, the latter composed of developing countries and emerging economies. We chose to convert single gas emissions to CO2 equivalents, using the IPCC SAR global warming potentials (e.g. CH4 = 21, N2O = 310), in line with current reporting requirements for developing countries, which also represent the majority of global emissions estimated herein.
3. Results
3.1. Emissions on agricultural land
Our estimates indicate that 2018 total GHG emissions on agricultural land—the sum of farm gate emissions and land use change—were 10 383 Mt CO2eq yr−1, 80% of which generated in NAI countries (table 1). Remarkably, they represented nearly twice the emissions that would be reported under the Agriculture sector of the NGHGI, the latter covering only non-CO2 emissions from crop and livestock production processes. Our results show that emissions of CO2 on agricultural land were nearly half of the total, with individual non-CO2 gases contributing less than a third each, i.e. CH4 (30%) and N2O (24%).
Table 1. Food system emissions (Mt yr−1) generated on agricultural land, defined as the sum of emissions within the farm gate (on-farm production) and from land use change processes linked to conversion to agriculture. Results for IPCC categories used in NGHGI are also provided, for years 1990 and 2018, single gases and CO2eq, world-totals and by AI and NAI country grouping. Note that non-CO2 emissions from net forest conversion were those associated to fires in humid tropical forests, and thus are present only within NAI country totals.
| 1990 | 2018 | |||||||
|---|---|---|---|---|---|---|---|---|
| CH4 | N2O | CO2 | CO2eq | CH4 | N2O | CO2 | CO2eq | |
| Farm gate | 2675 | 2066 | 1336 | 6077 | 2978 | 2560 | 1607 | 7145 |
| On-farm energy use | 16 | 42 | 701 | 759 | 23 | 38 | 885 | 946 |
| Land use | 0 | 118 | 635 | 753 | 0 | 129 | 722 | 852 |
| Crop and Livestock | 2659 | 1788 | 0 | 4447 | 2955 | 2264 | 0 | 5218 |
| Land use change | 109 | 57 | 4482 | 4648 | 80 | 51 | 3107 | 3238 |
| Net forest conversion | 54 | 57 | 4271 | 4382 | 38 | 51 | 2945 | 3034 |
| Peat fires | 54 | 0 | 211 | 265 | 42 | 0 | 162 | 204 |
| Agricultural land | 2784 | 2123 | 5818 | 10 725 | 3058 | 2611 | 4714 | 10 383 |
| NGHGI reporting | ||||||||
| Agriculture | 2659 | 1906 | 0 | 4565 | 2955 | 2393 | 0 | 5347 |
| LULUCF | 128 | 76 | 1668 | 1873 | 100 | 78 | 1193 | 1372 |
| AFOLU | 2787 | 1982 | 1668 | 6438 | 3055 | 2471 | 1193 | 6719 |
Over the period 1990–2018, CO2eq emissions decreased, by −3%, as the moderate growth in farm gate emissions (+10% for CH4 and +24% for N2O) was counterbalanced by a decrease in land use change emissions (−19%). CO2 was a larger contributor to total emissions on agricultural land in 1990 (55%). A more detailed description of agricultural land emissions is given in FAO (IEA 2020b) and Tubiello (2019).
3.1.1. Emissions within the farm gate
In 2018, global farm gate (on-farm production) emissions were 7145 Mt CO2eq yr−1, 20% higher than the 1990 levels of 5959 Mt CO2eq yr−1 (table 1). More than 70% of these emissions were located in NAI countries. Non-CO2 emissions represented more than three-fourths of the total, including in NAI and AI countries and rather consistently across 1990–2018. They were dominated by livestock processes (enteric fermentation and manure), followed by synthetic fertilizers and rice cultivation. CO2 gas represented one-fourth of the total on-farm production emissions, with nearly equal contributions from on-farm energy use and peatland drainage (figure 2).

Figure 2. Agricultural land emissions, by activity and NGHGI sector. Colors indicate category total emissions for AI countries (blue) and NAI countries (orange). Category 'other' comprises mostly emissions from crop residues burning and additions to soils, and from prescribed burning of grasslands and savannahs.
Download figure:
Standard image High-resolution imageNon-CO2 emissions increased from 4447 to 5218 Mt CO2eq yr−1 over 1990–2018, and were characterized by opposite trends between AI and NAI groups. In developed countries, emissions decreased by 25%, from 1555 to 1173 Mt CO2eq yr−1, while they increased in developing countries by nearly 40%, from 2892 to 4045 Mt CO2eq yr−1 (figure 2). Legislation put in place in the late 1980s to reduce environmental nitrogen pollution in Europe and in many OECD countries, as well as the break-down of the agricultural communal systems after the collapse of the Soviet Union, underlie the emission decreases in AI countries. Conversely, the observed increases in NAI countries stem from growth in both internal demand and global trade of food products over the study period (i.e. Finogenova et al 2019, Martínez-Valderrama et al 2021).
At the same time, global emissions from drained organic soils increased by 13%, from 753 to 852 Mt CO2eq yr−1 (table 1). These emissions were generated largely in NAI countries, representing in 2018 nearly 70% of the total (Conchedda and Tubiello 2020).
On-farm energy emissions increased globally by 25% from 1990 to 2018, i.e. from 759 to 946 Mt CO2eq yr−1 (table 1). NAI countries contributed more than two-thirds in 2018 and doubled since 1990, from 307 to 658 Mt CO2eq yr−1. Conversely, emissions form on-farm energy use decreased in AI countries, by 36% from 449 to 288 Mt CO2eq yr−1.
3.1.2. Land use change emissions
New forest emissions and removals data for the period 1990–2020 (Tubiello et al 2021) were used for this assessment. They show a 30% decrease in net forest conversion from 1990 to 2018 (from 4382 to 3034 Mt CO2eq yr−1), with emissions occurring almost entirely in NAI countries (table 1). Emissions from tropical peat fires were 204 Mt CO2eq yr−1 in 2018, 30% less than in 1990. These results were only one-fourth of previous FAO estimates (Prosperi et al 2020), used in recent assessments of food system emissions (Crippa et al 2021). In contrast, land use change emissions on agricultural land totaled 3238 Mt CO2eq yr−1 in 2018. Net forest conversion, used herein as a proxy for food-related deforestation, was the single largest emission source estimated on agricultural land over the entire 1990–2018 period (table 1).
3.2. Pre- and post-production
3.2.1. Emissions from food waste disposal and food transport
While emissions on agricultural land were taken from existing FAO data products, the country-level estimates of emissions from food transport and food waste disposal represent an original contribution of this work. Results indicated that in 2018 world total emissions from domestic food transport were 511 Mt CO2eq yr−1 (table 2), of which nearly 60% were generated in NAI countries. Domestic food transport emissions increased globally 80% since 1990, with exceptionally strong growth in NAI countries, where they nearly tripled since 1990 (table 2).
Table 2. Food system emissions (Mt yr−1) generated in pre- and post-production processes outside agriculture, defined as the total of emissions from food transport, food waste disposal and energy use in food processing and supply chains. Results are provided for years 1990 and 2018, single gases and CO2eq, world-totals and by AI and NAI country grouping.
| 1990 | 2018 | |||||||
|---|---|---|---|---|---|---|---|---|
| CH4 | N2O | CO2 | CO2eq | CH4 | N2O | CO2 | CO2eq | |
| Food transport | 1 | 4 | 282 | 288 | 2 | 5 | 504 | 511 |
| NAI | 0 | 1 | 97 | 98 | 1 | 2 | 286 | 290 |
| AI | 1 | 4 | 185 | 189 | 0 | 3 | 217 | 221 |
| Waste disposal | 684 | 51 | 30 | 764 | 887 | 77 | 33 | 996 |
| NAI | 533 | 31 | 17 | 582 | 711 | 54 | 20 | 784 |
| AI | 150 | 20 | 13 | 182 | 176 | 23 | 13 | 212 |
| Supply chains | 3256 | 3256 | 4298 | 4298 | ||||
| NAI | 663 | 663 | 2074 | 2074 | ||||
| AI | 2593 | 2593 | 2224 | 2224 | ||||
| Pre and post-production | 685 | 55 | 3568 | 4308 | 889 | 82 | 4835 | 5806 |
| NAI | 533 | 32 | 777 | 1342 | 712 | 56 | 2380 | 3148 |
| AI | 152 | 23 | 2791 | 2966 | 177 | 26 | 2455 | 2658 |
Global emissions from food waste disposal, including solid food waste, industrial wastewater and incineration, reached 996 Mt CO2eq yr−1 in 2018, with NAI countries representing 80% of the total (table 2). CH4 emissions generated by disposal of solid food waste in landfills and open-dumps grew by 30% between 1990 and 2018, reaching 594 Mt CO2eq yr−1 in 2018—roughly 60% of total food waste disposal emissions. CH4 and N2O emissions from domestic wastewater increased by 50% since 1990, contributing an additional 288 Mt CO2eq yr−1 in 2018. Emissions from incineration were conversely very small by comparison and are not discussed further.
Transport and food waste disposal contributed in total 1507 Mt CO2eq yr−1 to food system emissions outside of agricultural land. While they represented a mere 15% of the emissions on agricultural land in 2018, they exhibited very strong growth over the period 1990–2018, in both CO2 (+72%) and non-CO2 (+40%) components (table 2).
3.2.2. Emissions from energy use in supply chains
In order to provide a quantification of emissions from the entire food system, we included first-order estimates of emissions from energy use in supply chains, based on published FAO (2011) work including fertilizer and equipment manufacturing, industrial food processing, packaging, refrigeration, and retail. To this end, we used the FAO global and regional estimates for the year 2008 (FAO 2011) to calculate emission in 1990 and 2018, limited to AI and NAI country groupings as well as at global level, as discussed in section 2. Results indicated world-total emissions of roughly 4300 Mt CO2eq yr−1 in 2018, 60% of which were generated in NAI countries, representing an increase of about 50% with respect to 1990 levels (table 2).
3.3. Emissions from the food system
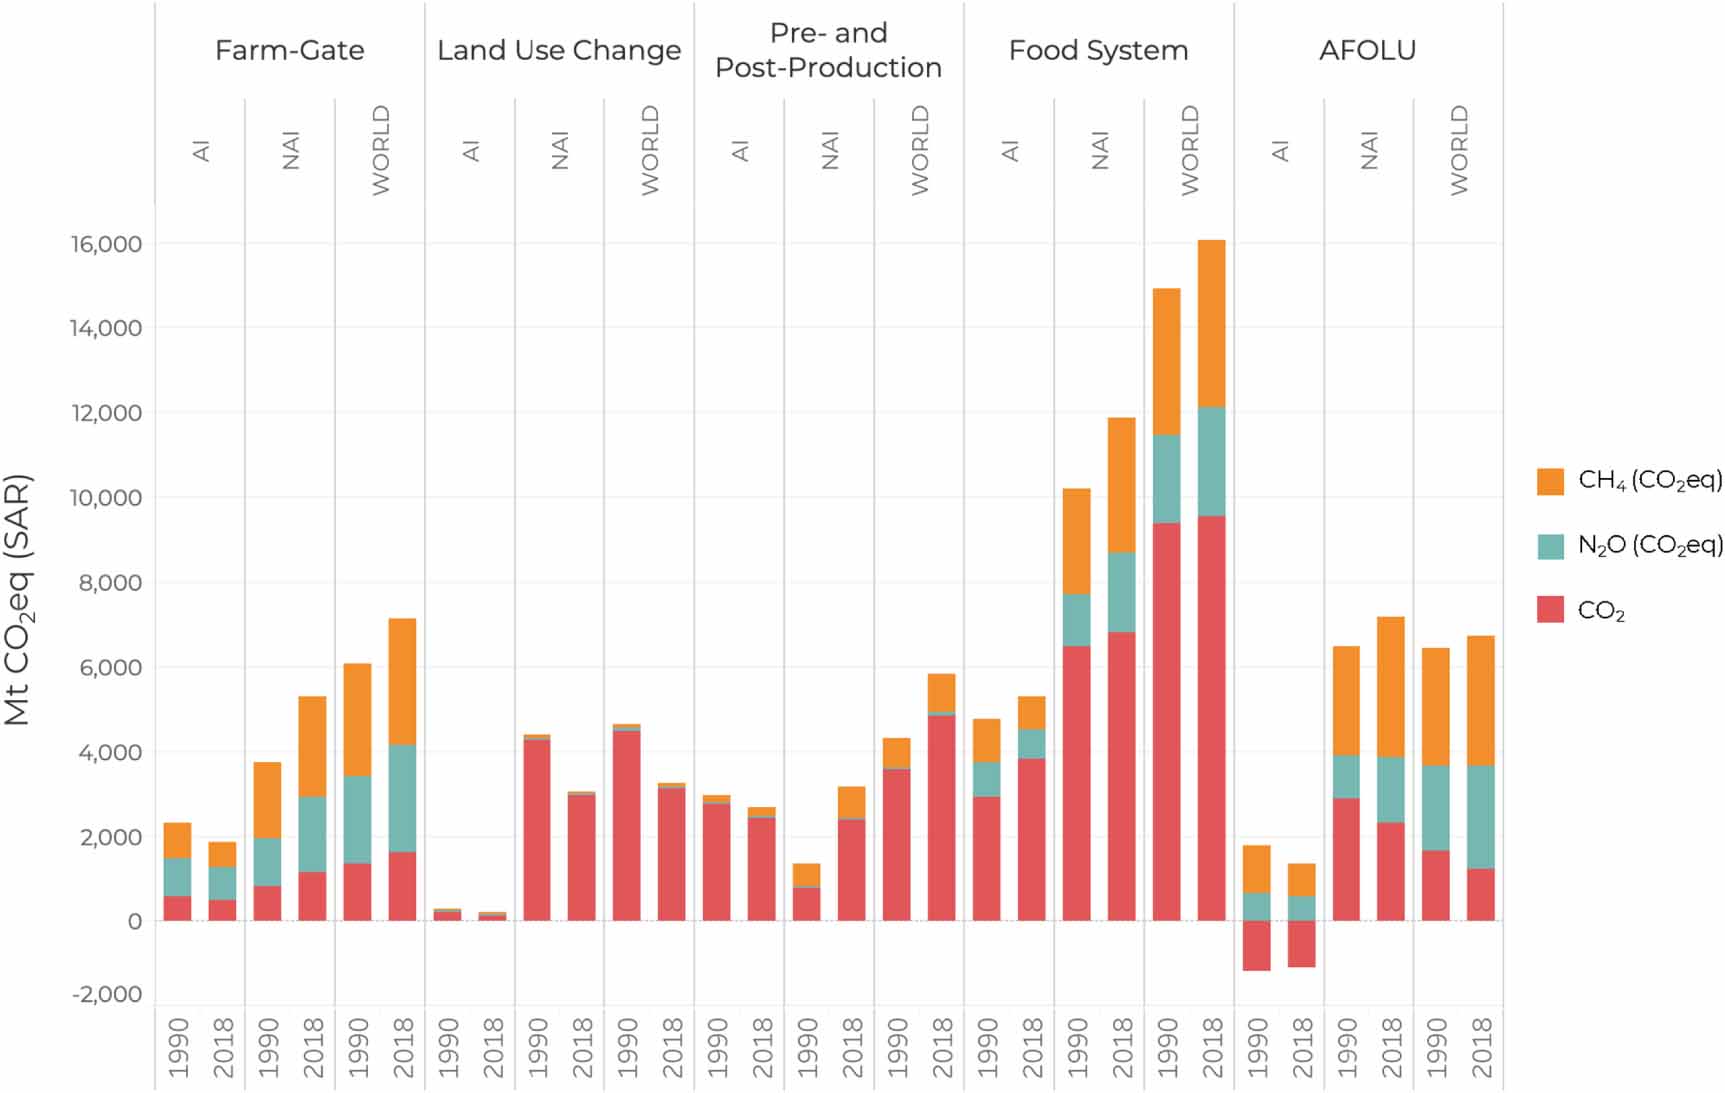
Taken together, results indicate that in 2018 total food system emissions were roughly 16 Gt CO2eq yr−1, having increased 8% since 1990. Nearly three-quarters (about 12 Gt CO2eq yr−1) were generated in NAI countries in 2018, compared to a share of 68% in 1990. In 2018 (as in 1990), CO2 was the largest contributor to food system emissions, totaling 9.5 Gt CO2 yr−1. In comparison, in 2018 CH4 contributed 3.9 Gt CO2eq yr−1 and N2O 2.6 Gt CO2eq yr−1 (table 3; figure 3).

Figure 3. Relevant food and agriculture emissions groupings, by trace gas (CH4, N2O, CO2 and CO2eq) and regional aggregation (AI = Annex I parties; NAI = non-Annex I parties). Aggregates include those for: food system, agricultural land, pre- and post-production, and land use change. AFOLU emissions are provided for comparison.
Download figure:
Standard image High-resolution imageTable 3. Food system emissions totals (Mt yr−1) generated across the three main components identified in this work: Farm gate (on-farm production), land use change processes, pre- and post-production. Results are provided for years 1990 and 2018, single gases and CO2eq, world-totals and by AI and NAI country grouping.
| 1990 | 2018 | ||||||||
|---|---|---|---|---|---|---|---|---|---|
| CH4 | N2O | CO2 | CO2eq | CH4 | N2O | CO2 | CO2eq | ||
| Food system | WORLD | 3469 | 2059 | 9385 | 14 913 | 3946 | 2564 | 9549 | 16 059 |
| NAI | 2455 | 1236 | 6481 | 10 172 | 3175 | 1878 | 6789 | 11842 | |
| AI | 1014 | 823 | 2905 | 4741 | 771 | 686 | 3831 | 5288 | |
| Pre- and post-production | WORLD | 685 | 55 | 3568 | 4308 | 889 | 82 | 4835 | 5806 |
| NAI | 533 | 32 | 777 | 1342 | 712 | 56 | 2380 | 3148 | |
| AI | 152 | 23 | 2791 | 2966 | 177 | 26 | 2455 | 2658 | |
| Farm gate | WORLD | 2675 | 1948 | 1336 | 5959 | 2978 | 2560 | 1607 | 7145 |
| NAI | 1812 | 1148 | 792 | 3753 | 2383 | 1771 | 1144 | 5298 | |
| AI | 863 | 918 | 544 | 2324 | 595 | 789 | 463 | 1847 | |
| Land use change | WORLD | 109 | 57 | 4482 | 4648 | 80 | 51 | 3107 | 3238 |
| NAI | 54 | 57 | 4271 | 4382 | 38 | 51 | 2945 | 3034 | |
| AI | 54 | 0 | 211 | 265 | 42 | 0 | 162 | 204 | |
The aggregation of results at the food system level highlights important differences between developed and developing countries. For instance, while CO2 was the largest contributor of food system emissions in both AI and NAI groups, in 2018 it contributed proportionally more to the overall total in AI (72%) than in NAI (57%) countries (figure 3). Furthermore, emissions from within the farm gate and by pre- and post-production activities were roughly equal contributors in AI countries in 2018, while in NAI countries they were dominated by land use change processes (table 2).
With regards to the three major components of the food system (on-farm production, land use change, and pre- and post-production activities), our results indicate that in 2018 farm gate and pre- and post-production activities each contributed roughly equally to food system emissions at the global level, while land use change provided a smaller contribution. Specifically, farm gate emissions were 7 Gt CO2eq yr−1 (mostly non-CO2 gases), with pre- and post-production processes contributing another 6 Gt CO2eq yr−1. Land use change contributed only half of these amounts, about 3 Gt CO2eq yr−1, mostly as CO2 gas (figure 3). The trends in these three components were likewise notable, considering that in 1990, farm gate emissions were 6 Gt CO2eq yr−1, with land use change and pre- and post-production processes each emitting 4.5 Gt CO2eq yr−1 (table 3).
3.4. Emissions per capita
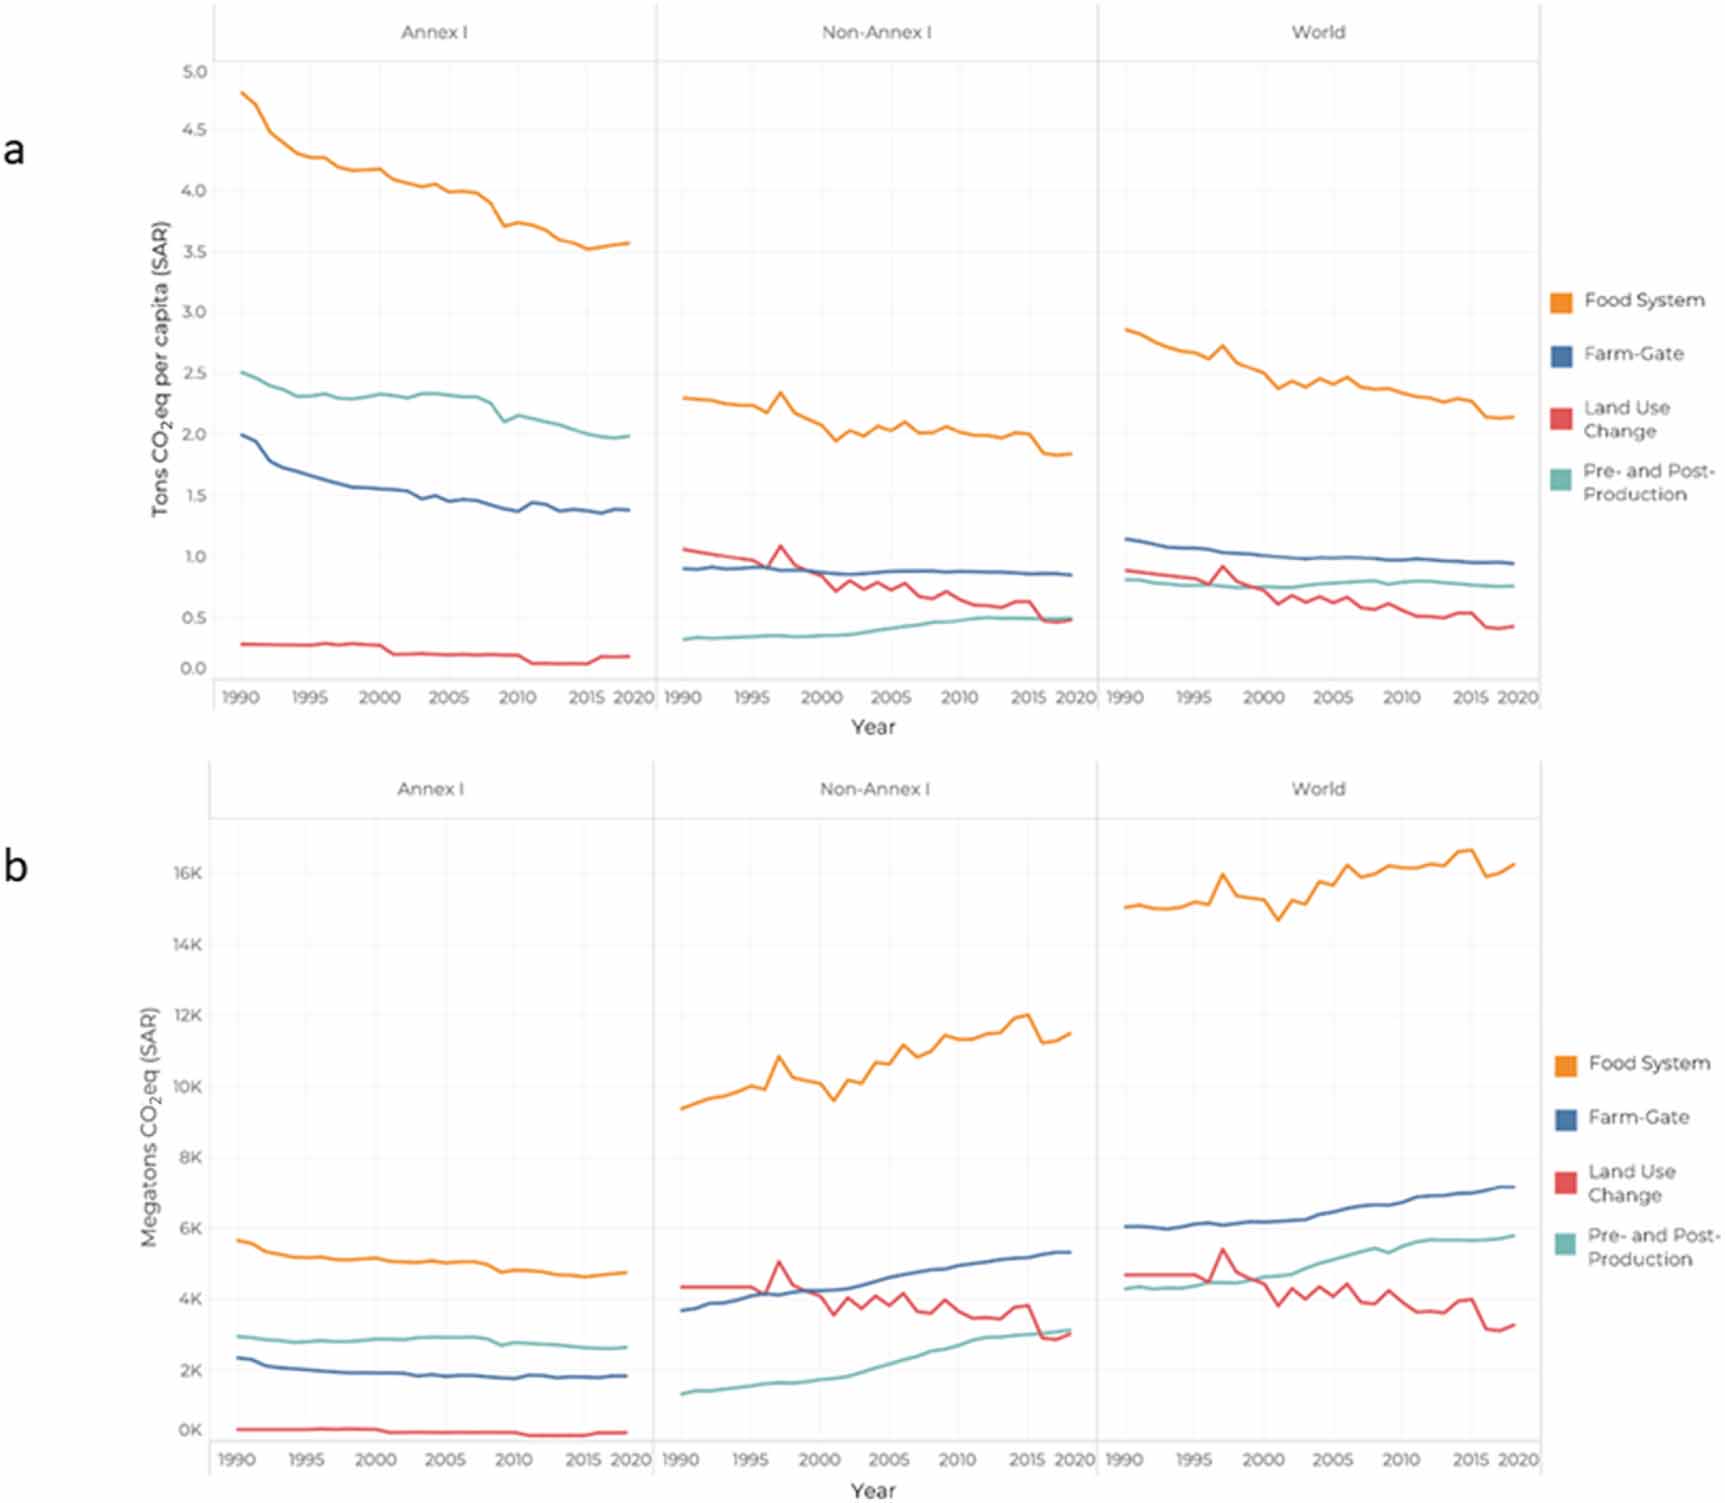
We computed emissions per capita over the entire study period 1990–2018, in order to provide an additional descriptor of food systems emissions globally and across regional aggregations, in total and by sub-system component. As expected, trends in per capita emissions significantly alter the overall storyline discussed above in terms of absolute emissions. We find that world-total per capita emissions decreased from 1990 to 2018, from 2.9 to 2.2 t CO2eq cap−1 (figure 4). Emissions per capita were higher in developed countries (AI), which nonetheless exhibited a strong reduction over the study period, from 4.8 to 3.6 t CO2eq cap−1, and lower in developing economies (NAI), but with a smaller decrease from 1990 to 2018, from 2.3 to 1.9 t CO2eq cap−1.
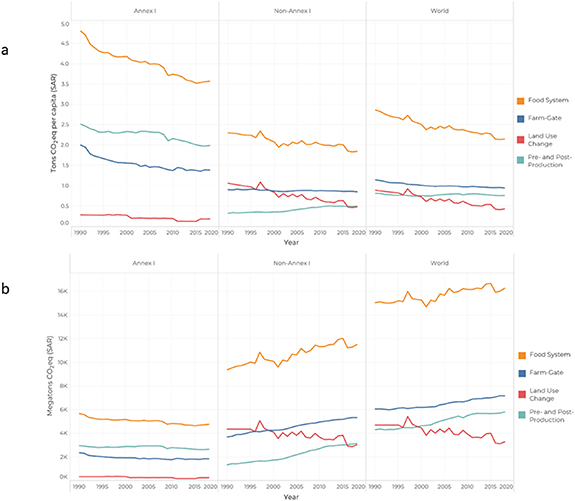
Figure 4. Annual values of food systems emissions relative to the period 1990–2018, for AI and NAI regional aggregates and world total. Data reported in (a) absolute emissions and (b) per capita emissions.
Download figure:
Standard image High-resolution imageThe observed decreases in per capita emissions were related to trends in the three food system sub-components considered in this study. Globally, they were almost entirely due to sharp reductions in per capita land use change emissions, which more than halved during 1990–2018, from 0.9 to 0.4 t CO2eq cap−1. Conversely, global per capita emissions related to farm gate activities and pre- and post-processing decreased slightly from 1990 to 2005, but have remained fairly constant over the last 15 years, with a plateau at around 0.8–1.0 t CO2eq cap−1.
4. Discussion
The new results presented at the food system level are consistent with recently published estimates in both absolute values and in terms of relative contribution to total anthropogenic emissions. Specifically, Crippa et al (2021), using a similar approach to the one developed herein, recently estimated total emissions from the food system in EDGAR-FOOD, at 18GtCO2eqyr−1 in 2015, representing 34% of total anthropogenic emissions. Our estimate of 16GtCO2eqyr−1 in 2018 is consistent with their findings, also considering their stated uncertainty range of 14–22GtCO2eqyr−1. This is in line with our own estimate of 30%–50% uncertainty. Our results are likewise consistent with those published by the IPCC (2019) and further refined by Rosenzweig et al (2020), which estimated a range of food system emissions of 12–19GtCO2eqyr−1 for the period 2008–2017.
At the same time, the FAO land use change data used herein represent an important update with previous work. First, the new FAO update reduced emissions from peat fires by nearly 1GtCO2eqyr−1, due to a more limited accounting of these emissions, as discussed in section 2. Second, new FAO estimates of forest emissions (Tubiello et al 2021) revised emissions from net forest conversion downwardly by 0.4GtCO2eqyr−1. With these new estimates, our results extend the available data to more recent years, while also improving data on key food system components.
Our results confirm recent quantifications of the relative contributions of the food system to total anthropogenic emissions. We used an unpublished version of the PRIMAP database (FAO 2020, Gütschow et al 2021) with increased sectoral resolution to compute the relative contribution of food system emissions to total anthropogenic emissions over 1990–2018, globally and for the AI/NAI country groupings. The combined PRIMAP-FAO estimates of world total emissions for 1990 and 2018 were 39 and 49GtCO2eqyr−1, respectively (figures 4, 5). Our results thus indicated a world-total percentage share of 33%, in 2018, with similar values for AI (33%) and NAI (36%) countries (table 3). These results were consistent with the recent estimate of 34% for the year 2015 by Crippa et al (2021) and the published range of 21%–37% of the IPCC (2019). Furthermore, we estimated that the share of food system emissions to total anthropogenic emissions decreased over period 1990–2018; in 1990 the food system share was 44%—consistently with previous estimates.

Figure 5. Sankey diagram of world total anthropogenic emissions flows from IPCC sectors to food system and non-food groupings, for the year 2018. Produced with free SANKEYMatic software, available at http://sankeymatic.com/.
Download figure:
Standard image High-resolution image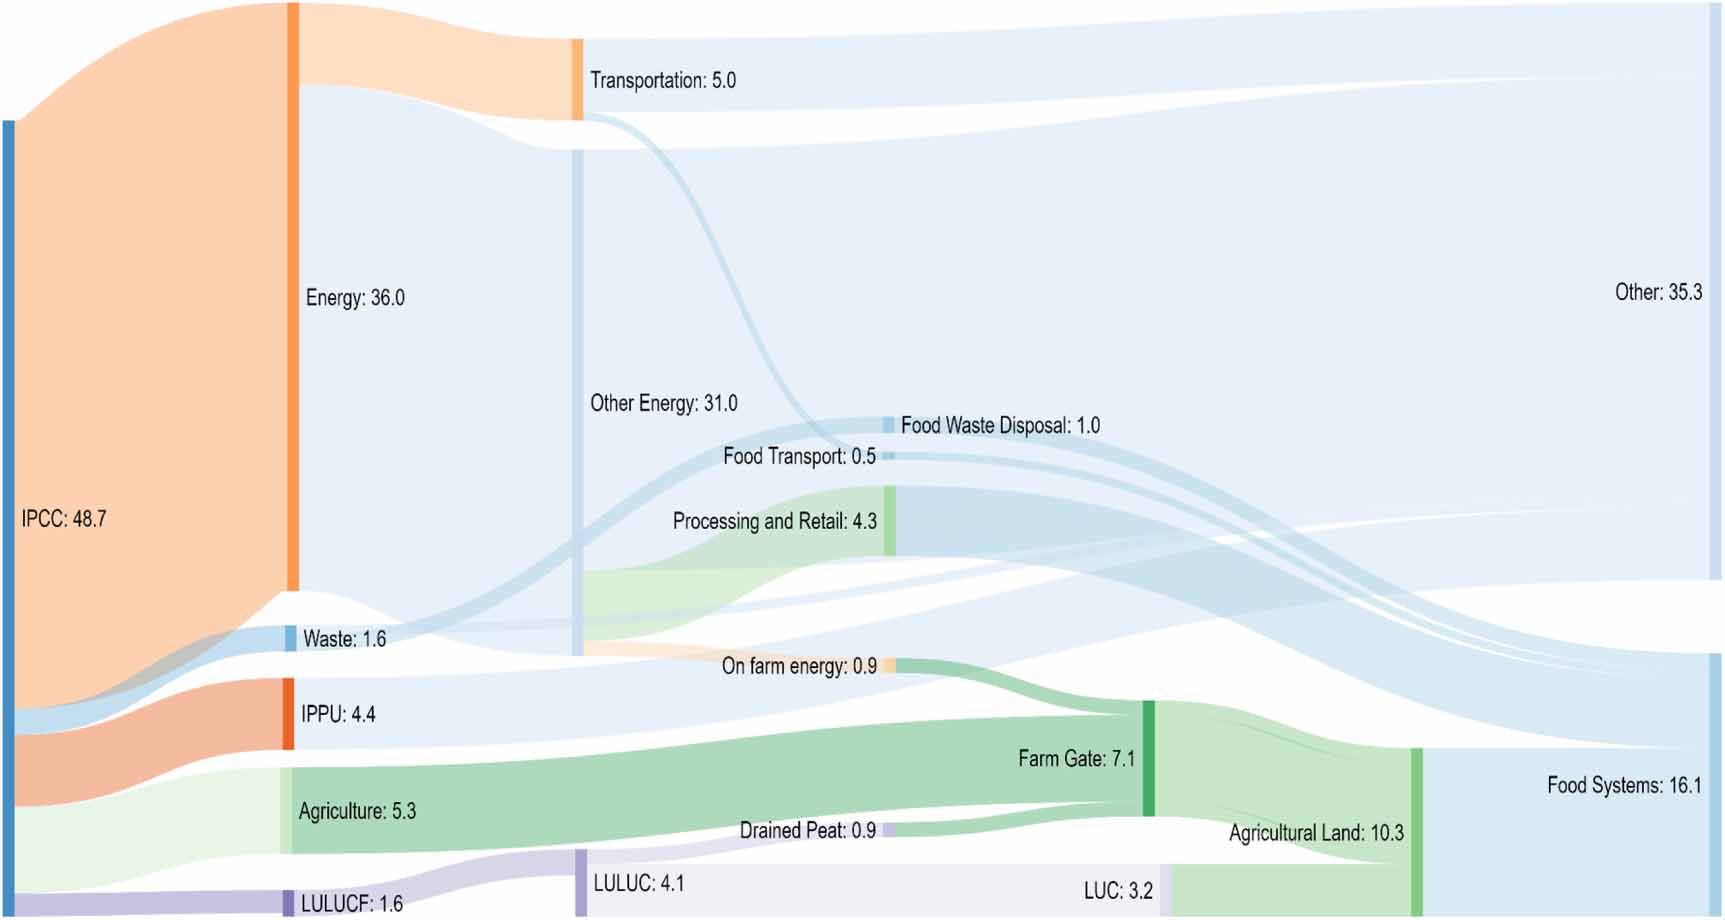
Our results show that differences between developed and developing countries have been decreasing over time. Specifically, they indicate that in 1990 food system shares were 24% and 56% in AI and NAI countries, respectively. The trend analysis over 1990–2018 also shows, notably, that the share of food system emissions actually increased in developed countries, possibly as the result of increases in energy use in pre- and post-production processes beyond the farm gate. Conversely, the significant decrease of the share of food system emissions over time in NAI countries, i.e. from 56% to 36%, was explained by the sharp decreases in land use change emissions linked to reduced deforestation, discussed in section 3.
Finally, our study adds significant new details with respect to published literature in terms of regional, temporal and sub-component trends in per capita food system emissions. While the world-total per capita values we find, about 2.2 t CO2eq cap−1 in 2018, are consistent with those of Crippa et al (2021), our results extend the previous analysis in important components. First, we documented differences in per-capita contributions between developing and developed countries, with per-capita values in AI countries still nearly half those NAI in 2018. Secondly, our results clarify that, in aggregate for the AI countries, per capita (and absolute) emissions in pre- and post-processing were the largest contributor over the entire 1990–2018 period, greater than those from within the farm gate. In NAI countries, farm gate emissions still dominate as a contributor of both per capita and absolute food systems emissions, with pre- and post-processing sharply increasing since 2005, so much so that by 2018 it has overtaken land use change as the second most important component.
The observed trends in our results, expressed in either absolute emissions, per capita emissions or relative shares, point to important transformations in the way that the food system has impacted the planet though GHG emissions over the last 30 years, in the period 1990–2018. They suggest that, as the food system changed with economic development, emissions from the conversion of natural ecosystems decreased, counterbalanced by increases in emissions from pre- and post-production processes. If continued in coming years, these trends suggest that mitigation in the food system will need to focus on both farm gate and pre- and post-production processes in terms of abatement of absolute emissions. From a per capita perspective however, our results also show that reductions in per capita food system emissions will continue to be driven in the short term by progress in halting agriculture-related deforestation and ecosystem degradation.
Trends in non-CO2 gases suggest the need for a renewed focus on improved nitrogen use efficiencies—an issue that is closely linked to achieving more sustainable production systems (Kanter et al 2016). For CH4, our results highlight the importance of mitigation in solid food waste disposal.
For CO2 mitigation, our analyses confirm that on farm energy use is an important hotspot of emissions from farms (Bennetzen et al 2016). Equally importantly, improved management of agricultural land, reduced deforestation and protection of natural ecosystems at the interface between managed and unmanaged land will need to accelerate (Searchinger et al 2018). The goal is to convert current emissions on agricultural land into net removals, thus advancing a carbon-neutral food system.
5. Conclusion
Agriculture is a significant contributor to climate change due to the amount of GHG emissions generated within the farm and on agricultural land. Global emissions from agriculture and associated land use currently represent about one-fifth of the total from all economic activities. However, the impact of the entire food system on climate change is much greater after incorporating pre- and post-production activities along supply chain, retail, consumption and waste disposal phases. After accounting for all food system activities, food system emissions may be as large as 20%–40% of total anthropogenic emissions.
The IPCC sectors used to calculate and partition GHG emissions can miss many important food-related emissions. Our new comparative mapping of food system categories and activities and improved data have shown that significant emissions are also contributed by non-IPCC agricultural and land sectors, such as on-farm energy use, domestic food transport and food waste disposal. Taken together, the global food system represents a larger GHG mitigation opportunity than previously estimated. Food system emissions are most substantial in developing countries, where they often represent more than half of the total from all economic activities.
The available data point to marked reductions in GHG food system emissions from land conversion over 1990–2018, especially in connection to decreased deforestation. At the same time, trends in agricultural development suggest that, while land use change emissions have decreased over time, emissions from energy use beyond the farm gate will become an increasingly prominent component of total food system emissions in the coming decades.
Acknowledgments
This work is the result of a collaboration among lead researchers at FAO, UNSD, UNIDO, IEA, Potsdam Institute for Climate, NASA (WBS 281945.02.80.01.13), the Agricultural Models Inter-comparison and Improvement Project (AgMIP), the Center on Global Energy Policy, School of International and Public Affairs at Columbia University, the Center for Climate Systems Research at Columbia University, and New York University. FAOSTAT, the main database used as data source in this study, is funded by FAO member states through their contributions to the FAO Regular Programme. We thank the Swiss Federal Office for Agriculture for support to FAO under the project 'Strengthening Global Assessments of Sustainable Agriculture'. F N T and C R conceived the ideas and together with G C and K K designed the methodology. L S, A F and R Q provided pre- and post-production data. NW provided forest data. G O, K K, X P, S Q, J d B, R Q, L S, A F and J G compiled and analyzed data, F N T led the writing of the manuscript with inputs from G C and K K, C R, D S, P B commented on an earlier version of the manuscript. All authors contributed critically to the drafts and gave final approval for the publication. The views expressed in this paper are the authors' only and do not necessarily reflect those of FAO, UNSD and IEA.
Data availability statement
The data that support the findings of this study are openly available at the following URL/DOI: fao.org/faostat.