

Abstract
The impact of prenatal and early childhood exposure of ambient particulate matters (PMs) on the risk of autism spectrum disorder (ASD) in children remained inconclusive, particularly at low levels below current National Ambient Air Quality Standards. The study summarizes the epidemiological association between PM exposure and risks of ASD in children. PubMed, Embase, Web of Science, Cochrane Library, Compendex, Biosis Previews, and Agricultural & Environmental Science Databases for studies published before February 2020. Original studies with the following information were included: (a) exposure of ambient PM (including PM2.5 and/or PM10); (b) ASD as the outcome of interest in children; (c) effect estimates of relative risk (RR), odds ratio (OR), or hazard ratio. The risks of ASD are summarized at different exposure windows (i.e. first, second, third trimesters, and early childhood period) by using a random-effects model. Exposure-response meta-regression was performed across various background levels of PM2.5. We used Newcastle–Ottawa Scale for quality assessment. Eleven studies (two cohort and nine case-control studies) and 313 301 children were enrolled. Overall, the risk of ASD increased by 64% (pooled RR = 1.64, 95% CI = 1.16–2.34) and 31% (pooled RR = 1.31, 95% CI = 1.08–1.58), with exposure to 10 μg m−3 increment of PM2.5 during early childhood and prenatal periods, respectively. Stratifying by three trimesters of prenatal period, the risk of ASD increased 35% per 10 μg m−3 difference of PM2.5 exposure during the third trimester (pooled RR = 1.35, 95% CI = 1.18–1.55), but not during the first and second trimesters. The risks of ASD persisted at the background PM2.5 levels from 8 μg m−3 (pooled RR = 1.30, 95% CI = 1.02–1.66) and onward. Our findings suggested an association between PM2.5 exposure and risks of ASD, particularly within specific exposure windows, even at low background levels of PM2.5.
Export citation and abstract BibTeX RIS

Original content from this work may be used under the terms of the Creative Commons Attribution 4.0 license. Any further distribution of this work must maintain attribution to the author(s) and the title of the work, journal citation and DOI.
1. Introduction
Autism spectrum disorders (ASDs) are neurodevelopmental disorders characterized by persistent deficits in social communication, interaction, restricted interests and repetitive behaviors [1]. Its symptoms present in the early developmental period and cause significant social and occupational impairments [2]. ASD would contribute to considerable financial and medical burden [2, 3], and result in a 33% decrease of health utility [4]. In the United States, the costs of lifetime support for an ASD child with and without intellectual disability were estimated 2.4 and 1.4 million dollars, respectively, mainly for special education services and parental productivity loss [2].
The administrative childhood prevalence diagnosis of ASD has increased substantially in the United States, from 6.7 per 1000 person in 2000 to 16.8 per 1000 person in 2014 [5]. While the exact etiology of ASD remained unknown [6, 7], possible risk factors included family-related factors (e.g. genetic factors or parental ages) [1] and environmental factors [6]. Studies have shown that exposure to developmental neurotoxicants (e.g. heavy metals, medications, and pesticides) may contribute to the occurrence of ASD [8, 9]. In recent years, exposure to air pollution, such as ambient particulate matters (PMs), ozone, and nitrogen oxides, revealed an association with neurobehavioral dysfunction [10] and ASD [11, 12] among children.
PM with diameter less than 2.5 μm (PM2.5) can deposit in alveolar and penetrate into circulation [13] to cause neurological effects through disrupting blood brain barriers [14], penetrating cellular membranes [15], accelerating neuroinflammation [16], and increasing oxidative stress in brain structures [17]. Studies reported that inhaled PM2.5 could translocate from lung to placenta, and into fetal brain tissues [18], implying possible biological explanations that PM2.5 could contribute to ASD. However, previous epidemiological studies on the association between PM exposure and the development of ASD have yielded inconclusive results. Three meta-analysis studies published in 2016 [19, 20] and 2019 [12] revealed contradictory conclusions, probably due to different selection process, limited studies, and not considering the effects by exposure windows. Hence, we aimed to conduct a systematic review and meta-analysis to address the association between the risks of ASD and PM exposure by exposure windows, as well as the exposure–response effects.
2. Methods
We conducted the protocol of this study following the Preferred Reporting Items for Systemic review and Meta-Analysis Protocols [21] and Meta-analysis of Observational Studies in Epidemiology [22]. This study was registered in PROSPERO international prospective register of systematic reviews (PROSPERO CRD 124 791).
2.1. Literature searches and selection criteria
We searched publications from PubMed, Embase, Web of Science, Cochrane Library, Compendex, Biosis Previews, and Agricultural & Environmental Science Database up to February 27th, 2020. The Medical Subject Heading terms of 'Autism Spectrum Disorder', 'Air Pollution' and their synonyms (appendix 1) were used during searching process. A total of 740 articles were identified and 332 articles remained after removal of conference abstracts, animal studies and duplicates. Three researchers (YTC, FSL, STC) screened the titles and abstracts independently and reviewed 60 full-text articles thoroughly for their eligibilities.
Original studies with the following information were included: (a) exposure of ambient PM (including PM2.5 and/or PM10); (b) ASD as the outcome of interest in children; (c) effect estimates of relative risk (RR), odds ratio (OR), or hazard ratio. Exposure windows could be either prenatal (i.e. during gestation) or early childhood (within the first three years of life). ASD diagnosis was ascertained by standardized medical examination and credible clinical criteria, including Diagnostic and Statistical Manual of Mental Disorders IV (DSM-IV), DSM IV-R, DSM-IV-TR, DSM-V, Social Communication Questionnaire plus Autism Diagnostic Observation Schedule (SCQ + ADOS), International Classification of Diseases version 9 (ICD-9) and/or Autism Diagnostic Interview, Revised (ADI-R). Types of study included case-control, nested case-control, case-cohort, and cohort studies. There was no randomized controlled trial on this topic in the literature. The search algorithm in details was showed in figure 1.
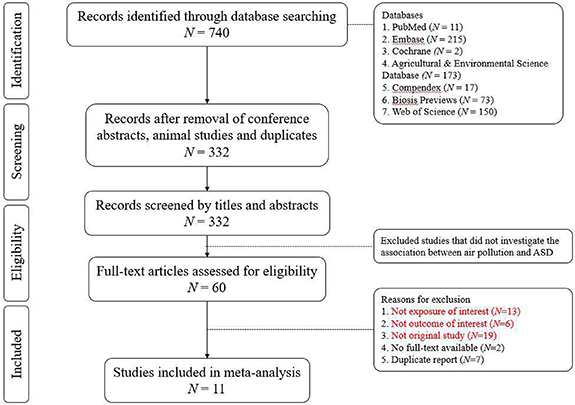
Figure 1. Algorithm of study inclusion.
Download figure:
Standard image High-resolution image2.2. Data extraction
The data from each selected article were extracted by three independent reviewers (YTC, FSL, STC). Among 11 included studies, subjects enrolled from different cities [23] and genders [24] were considered as distinctive study populations (a total of 13 study populations). Information of authors, population size, city/country, follow-up duration, and other basic characteristics were summarized in table 1 and/or extracted for subsequent analysis. Confounding adjustments and/or matching factors of each study were described accordingly in table 1. According to different exposure windows, the numbers of study populations that reported effect measures during prenatal periods alone (either three trimesters or whole prenatal period), early childhood alone, separated prenatal and early childhood periods, and combined prenatal and early childhood period were 4, 2, 5, and 2, respectively, which consisted of 18 effect estimates (4 + 2 + 5 + 5 + 2 = 18). To summarize pooled risks from the same study population during prenatal and postnatal exposure windows, we applied half weight to each estimate in order to prevent double-counting [25]. The magnitudes of effects were standardized as RRs per 10 μg m−3 increase of PM2.5. For those studies only reported risks of PM10, a conversion factor of 0.6 was applied, which has been used in previous report by World Health Organization [26]. Data from those studies with autism trait as the outcome of interest were further extracted as post hoc sensitivity analysis.
Table 1. Characteristics of 13 study populations among 11 included studies.
| Authors | Published year | Study design | No. of controls | No. of cases | Exposure windows | PM2.5 concentrations | Study periods | Ages (yrs) at diagnosis | Diagnostic criteria for ASD | Location (city, country) | Male ratio | Models of PM2.5 measurement | Adjusted covariates |
|---|---|---|---|---|---|---|---|---|---|---|---|---|---|
| Jung CR [27] | 2013 | Cohort | 49073 | 342 | Early childhood | 30.6 | 2000–2010 | 3–13 | ICD-9 | Taiwan | 0.52 | Beta-gauge, IDW | Age, anxiety, gender, intellectual disabilities, obsessive compulsive disorder, phobia, preterm, and SES |
| Volk HE [28] | 2013 | Case-control | 524 | 279 | First | 18.5 | 1997–2008 | 2–5 | ADOS & ADI-R | California, USA | 0.84 | CALINE4 line-source air-quality dispersion model | Sex, ethnicity, maximum education of parents, maternal age, and prenatal smoking |
| Second | |||||||||||||
| Third | |||||||||||||
| Prenatal | |||||||||||||
| Early | |||||||||||||
| Childhood | |||||||||||||
| Becerra TA [29] | 2013 | Case-control | 83229 | 7594 | Prenatal | 19.6 | 1998–2009 | 3–5 | DSM-IV-R | California, USA | 0.83 | LUR model | Controls matched to cases by birth year, sex, and at minimum reached the gestational age of the case. Model further adjusted for maternal age, education, race/ethnicity, maternal place of birth; type of birth, parity, insurance type, gestational weeks at birth. |
| Talbott EO [30] | 2015 | Case-control | 430 | 211 | First Second Third Prenatal Early childhood Both | 15.1 14.6 14.7 14.8 13.7 14.1 | 2005–2015 | 0–10 | SCQ & ADOS | Southwestern Pennsylvania, USA | 0.77 | LUR model | College education, smoking, race, and mom's age |
| Raz [31] | 2015 | Case-control | 1767 | 245 | First | 18.5 | 2005–2015 | 0–10 | SCQ + ADOS | Southwestern Pennsylvania, USA | 0.77 | LUR model | Child sex, year of birth, month of birth, maternal age at birth, paternal age at birth, census income |
| Second | |||||||||||||
| Third | |||||||||||||
| Prenatal | |||||||||||||
| Early childhood | |||||||||||||
| Kalkbrenner [23] | 2015 | Case-cohort | 13079 | 645 | First | 24.2 | 1990–2007 | 0–17 | ADI-R | North Carolina, USA | 0.57 | Nationwide expansion spatiotemporal model | Race/ethnicity, maternal education, maternal age, median household income, urbanization, calendar week of the child's birth |
| Second | 23.8 | ||||||||||||
| Third | 24.0 | ||||||||||||
| Prenatalb | 24.0 | ||||||||||||
| Early childhood | 23.7 | ||||||||||||
| Kalkbrenner AE [23]a | 2015 | Case-cohort | 2566 | 334 | First | 23.7 | 1990–2007 | 0–17 | ADI-R | California, USA | 0.57 | Nationwide expansion spatiotemporal model | Race/ethnicity, maternal education, maternal age, median household income, urbanization, calendar week of the child's birth |
| Second | 24.1 | ||||||||||||
| Third | 22.9 | ||||||||||||
| Prenatalb | 22.9 | ||||||||||||
| Early childhood | 22.0 | ||||||||||||
| Gong T [32] | 2017 | Case-control | 23373 | 5136 | Prenatal Early childhood | 4.3 | 1993–2011 | 0–18 | ICD 9/10 & DSM-IV | Stockholm, Sweden | 0.56 | Gaussian air quality dispersion model | Calendar year of birth, municipality of birth, sex, birth month, birth order, parents' birth countries, mother's marital status, mother's education, father's education, mother's employment, father's employment, disposable income within household, and neighborhood deprivation |
| Pagalan L [24] | 2018 | Cohort | 66960 | 1091 | First | 3.5 | 2004–2014 | 0–10 | ADOS & ADI-R | Vancouver, Canada | 1 | LUR model | Child sex, birth month, birth year, maternal age, maternal birthplace, neighborhood-level urbanicity and income band. |
| Second | |||||||||||||
| Third | |||||||||||||
| Prenatal | |||||||||||||
| Pagalan L [24] | 2018 | Cohort | 63989 | 216 | First Second Third Prenatal | 3.5 | 2004–2014 | 0–10 | ADOS & ADI-R | Vancouver, Canada | 0 | LUR model | Child sex, birth month, birth year, maternal age, maternal birthplace, neighborhood-level urbanicity and income band. |
| Chen G [11] | 2018 | Case-control | 1364 | 124 | Early childhood | 66.7 | 2005–2014 | 3–12 | DSM-V | Shanghai, China | 0.77 | Random forest model | Sex and age by matched design and adjusted for birth weight, gestational weeks, disease history, trauma history, maternal age, familial mental health history, parents' marital status, parental relationship, parenting, income, parents' educational level and smoking status |
| Yousefian F [33] | 2018 | Case-control | 522 | 134 | Prenatal | 104.8 | 2006–2018 | 2–10 | DSM-IV-TR | Tehran, Iran | 0.83 | LUR model | Maternal age at birth, maternal education, paternal education, cousin marriage, maternal smoking during pregnancy, birth order, gestational age, multiple births, maternal disease, paternal disease |
| Kaufman JA [34]c | 2019 | Case-control | 6425 | 428 | First | 12.3 | 2005–2012 | 0–7 | ICD-9 | Cincinnati, Ohio | 0.52 | US EPA's Fused air quality surface using downscaling model | Year of birth, mother's education, birth spacing, maternal pre-pregnancy body mass index, and month of conception, multi-window, and multi-pollutant. |
| Second | 12.3 | ||||||||||||
| Third | 12.3 | ||||||||||||
| Prenatal | 12.6 | ||||||||||||
| Early childhood | 12.5 12.5 | ||||||||||||
| both |
Note: ASD, autism spectrum disorder; ADOS, Autism Diagnostic Observation Schedules; ADI-R, Autism Diagnostic Interview Revised; LUR, land use regression; DSM, Diagnostic and Statistical Manual of Mental Disorders; ICD, International Classification of Diseases. a Same article as the one above, but different populations, locations and PM levels. b Represented by the third trimester estimates due to the effect of whole pregnancy was absent in the research. c 1st, 2nd, 3rd trimester, and prenatal risks were analyzed and reported by genders, respectively.
2.3. Statistical analysis
We chose random effect models a priori to estimate summary effects for this meta-analysis. The pooled RRs of ASD for PM2.5 exposure were analyzed and displayed separately according to different exposure windows. Because the risks of ASD might vary across different background PM2.5 levels [35], we further conducted exposure–response regression analyses. The concentrations of ambient PM2.5 were defined as the average levels among controls for case-control studies and among general populations for cohort studies. The natural spline with three knots was applied in the concentration-risk estimation with auto-optimized knot selection and weighted by ( ) in the regression models [36, 37]. Subgroup analyses were performed based on different characteristics (study types, oldest age at diagnosis, and locations) of studied subjects. The association between ASD and per 10 μg m−3 increment of PM10 during perinatal period was also analyzed. Meta-regressions were conducted to investigate factors related to high heterogeneity, including publication years, starting birth year in the study, ending birth year in the study, starting follow-up year, ending follow-up year, the youngest age of the cases, the oldest age of the cases, age ranges of cases, and follow-up years. All analyses were conducted using R (version 2.1.7), with package RISmed [36], rms [37], and metafor [38].
2.4. Quality and risk of bias assessment
Quality of the included studies was evaluated by Newcastle-Ottawa Quality Assessment Scale (NOQAS), with a full score of 9, containing three metrics: (a) selection; (b) comparability; and (c) exposure for case-control studies or outcome for cohort studies. Details of the quality assessment were summarized in appendices 2 and 3, for case-control and cohort studies, respectively. We also performed Funnel plot and quantile-quantile (Q-Q) plot to detect possible publication bias. Both Egger's test and Begg's test were applied to examine the small publication effects. To better understand the uncertainty of the pooled results, leave-one-out method was performed as a sensitivity test. For 13 independent studied populations, point estimates from early childhood were used for the sensitivity test, if overall estimates (ie: combined prenatal and early childhood) were absent.
3. Results
3.1. Characteristics of selected studies
This meta-analysis included 11 original studies (13 study populations) and a total of 313 301 children (16 779 cases and 296 522 controls) from five countries between 1990 and 2018 (table 1). All studies had at least eight years of follow-up. The male percentage among those studies ranged between 0.51 and 0.84. The average concentrations of PM2.5 varied widely from 3.5 μg m−3 in Vancouver, Canada to 104.8 μg m−3 in Tehran, Iran.
3.2. Main analysis
The pooled RRs of ASD associated with PM2.5 exposure were showed in figure 2, based on specific exposure windows. With 10 μg m−3 increase in PM2.5 levels, PM2.5 exposure during overall prenatal and early childhood periods revealed 31% (pooled RR = 1.31, 95% CI = 1.08–1.58) and 64% (pooled RR = 1.64, 95% CI = 1.16–2.34) increased risks of ASD in children, respectively. In terms of three trimesters of gestation, the RRs of ASD among children significantly increased up to 35% (pooled RR = 1.35, 95% CI = 1.18–1.55) per 10 μg m−3 increase of PM2.5 exposure during the third trimester, but not significantly during the first (pooled RR = 1.07, 95% CI = 0.94–1.22) and second trimesters (pooled RR = 1.17, 95% CI = 0.98–1.38). However, there is a trajectory of increased ASD risks across different exposure windows, particularly close to the time of birth. In addition, the effects of PM10 exposure during prenatal and early childhood periods on the risks of ASD were summarized in supplementary figure 1 (available online at stacks.iop.org/ERL/16/063003/mmedia). We found a 4% increase of pooled RR of ASD (pooled RR = 1.04, 95% CI = 1.00–1.09) per 10 μg m−3 increment of PM10 exposure.
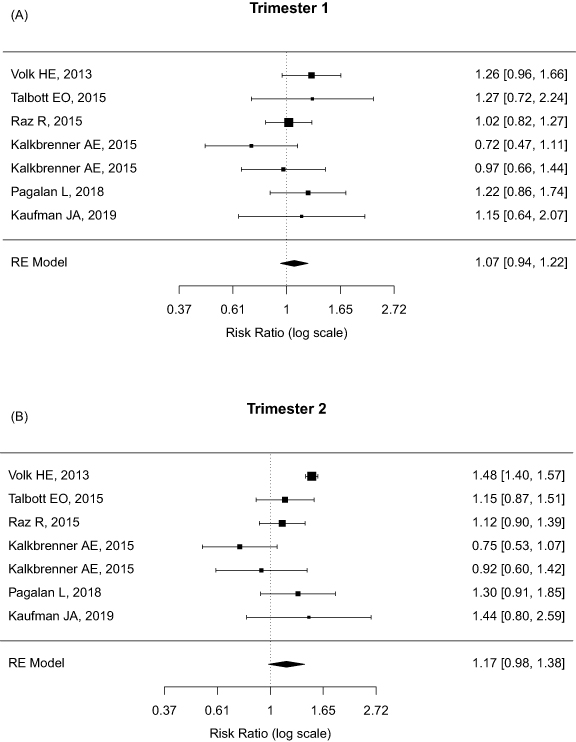
Figure 2. Forest plot of pooled relative risks (RR) of autism spectrum disorder (ASD) per 10 ug m−3 increase of PM2.5 exposure by four exposure windows: (A) the first trimester, n = 7; (B) the second trimester, n = 7; (C) the third trimester, n = 7; and (D) early childhood period, n = 9.
Download figure:
Standard image High-resolution image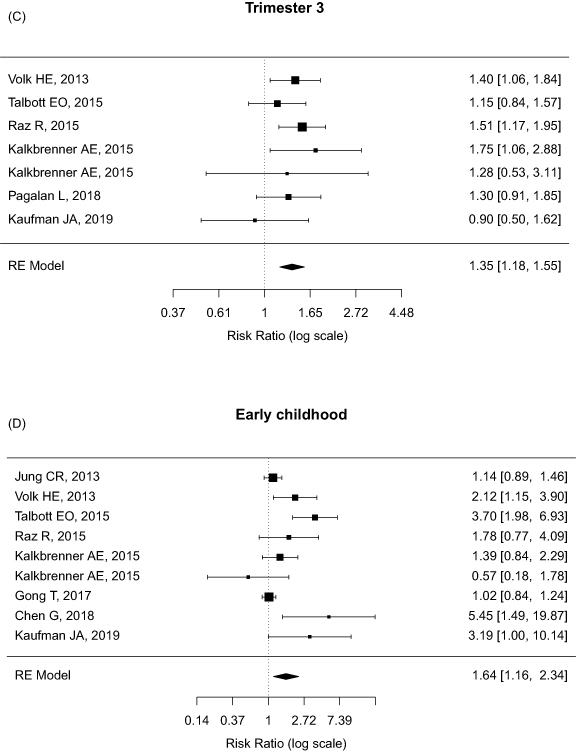
Figure 2. (Continued.)
Download figure:
Standard image High-resolution image3.3. Exposure–response analysis
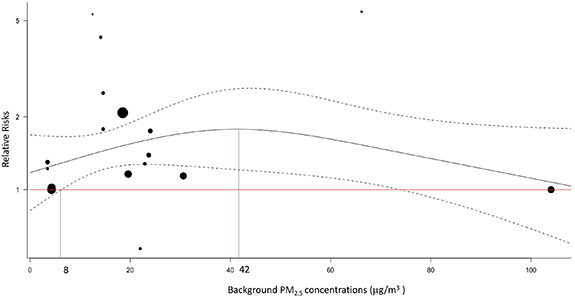
We found various effects of PM2.5 exposure in cities with different concentrations of PM2.5, suggesting the existence of exposure–response phenomenon. Exposure–response analysis demonstrated the risks of ASD per 10 μg m−3 increment of PM2.5 exposure in an exposure-responsive manner across a wide range of background PM2.5 levels (figure 3). The background PM2.5 levels range from 3.5 μg m−3 to 30.6 μg m−3, with two outliers at 66.7 μg m−3 [11] and 104.8 μg m−3 [33]. The risks of ASD per 10 μg m−3 increment of PM2.5 significantly increased during the background PM2.5 levels from 8 μg m−3 (pooled RR = 1.30, 95% CI = 1.02–1.66) to 74 μg m−3 (pooled RR = 1.44, 95% CI = 1.01–2.04), with a maximum effect at PM2.5 level of 42 μg m−3 (pooled RR = 1.77, 95% CI = 1.21–2.61).
Figure 3. Pooled relative risks of autism spectrum disorder (ASD) across different background PM2.5 levels. Each dot represents distinctive effect estimate of each study populations. The size of dots reflects the weight given in the dose-response regression. The black line and two dashed lines represent the relative risks (RR), upper and lower bounds of confidence intervals, respectively. The red horizontal line indicates relative risk of 1. The RRs firstly reaches significance at the background level of 8 μg m−3, as noted at left vertical blue line. The highest RR locates at the background level of 42 μg m−3, as noted at right vertical blue line.
Download figure:
Standard image High-resolution image
3.4. Subgroup analysis
Subgroup analyses were performed to investigate potential effect modifiers, such as different study types, ages at diagnosis, and locations of study (table 2). Considering all effect estimates (n = 18) during prenatal and early childhood periods, the overall pooled RRs of ASD per 10 μg m−3 increment of PM2.5 exposure increased 43% (pooled RR = 1.43, 95% CI = 1.19–1.73). In terms of the ages at diagnosis, the pooled RR for ASD was 1.65 (95% CI = 1.17–2.34) for children diagnosed less or equal to age 5, higher than the risks among children diagnosed less or equal to age 10 (pooled RR = 1.51, 95% CI = 1.20–1.91) and 18 (pooled RR = 1.43, 95% CI = 1.19–1.73). Meta-regressions on other characteristics showed non-significant results.
Table 2. Subgroup analysis. The pooled relative risks of autism spectrum disorder (ASD) per 10 μg m−3 increase of PM2.5 exposure by different factors.
| Characteristics | No. of effect estimates a (n) | Pooled relative risks (95% CI) | I2 (%) | P value |
|---|---|---|---|---|
| Overall | 18 | 1.43 (1.19–1.73) | 81.95 | 0.0002 |
| Study types | ||||
| Case-control | 11 | 1.65 (1.21–2.24) | 92.50 | 0.0014 |
| Cohort | 7 | 1.25 (1.05–1.48) | 0.00 | 0.0115 |
| Oldest age at diagnosis | ||||
| ⩽5 years | 3 | 1.65 (1.17–2.34) | 88.95 | 0.0044 |
| ⩽10 years | 12 | 1.51 (1.20–1.91) | 79.86 | 0.0005 |
| Location | ||||
| Asia | 3 | 1.07 (0.92–1.23) | 0.02 | 0.3816 |
| North America | 13 | 1.63 (1.32–2.02) | 66.49 | <0.001 |
| Europe | 2 | 1.01 (0.89–1.14) | 0.00 | 0.8964 |
a The effect estimates at different exposure windows (i.e. prenatal and early childhood periods) within the same study were considered different.
3.5. Quality assessment and publication bias
The detailed assessments were summarized in appendices 1 (case-control studies) and 2 (cohort studies). By using the NOQAS tool, the 11 included articles revealed high scores (i.e. >7 points, supplementary table 3). Most researches lost one star for not reporting response rate, per NOQAS. Three studies [23, 29, 32] lost one star in the adequacy of case definition, metrics of selection, because they used record linkage to define their cases, rather than validated cases independently, per NOQAS.
Considering 18 effect estimates during prenatal and early childhood periods, the funnel plot (supplementary figure 2) showed a symmetric pattern and the Egger's test and Begg's test were both non-significant (P value = 0.71 and 0.43, respectively), suggesting no obvious small-study bias. The Q-Q plot (supplementary figure 3) revealed scattered dots along with the straight line, implying no significant publication bias. Leave-one-out sensitivity analysis revealed the estimated RRs ranging from 1.13 to 1.43 (supplementary table 1). The post hoc sensitivity analysis including studies using a composite outcome of autism trait and ASD showed similar effects, across three trimesters and early childhood periods (supplementary table 2).
4. Discussion
In this meta-analysis, our results revealed significantly increased risks of ASD per 10 μg m−3 PM2.5 exposure during third trimester and early childhood. The effects of PM2.5 exposure showed an exposure-responsive manner across a wide range of background PM2.5 levels, starting as low as PM2.5 level of 8 μg m−3 and reaching a peak effect at PM2.5 level of 42 μg m−3.
Current US EPA standards for PM2.5 were set at 35 μg m−3 for 24 h average levels and 12 μg m−3 for annual average levels [39]. This meta-analysis indicated that risks of ASD associated with PM2.5 exposing during prenatal and early childhood periods still increased at a low background level of PM2.5. The pattern of increased risks of ASD at a low PM2.5 background level is similar to the association between all-cause mortality and PM2.5 exposure [35]. However, the incremental risks per 10 μg m−3 difference of PM2.5 diminished marginally as background levels over 42 μg m−3. That's said, the additional risks of ASD diminished (but still positive) with concurrently increased risks among controls exposed to higher background levels of PM2.5. Since the PM2.5 levels were less than 40 μg m−3 in most of the included studies, we did not have enough power to detect the significant effects at high levels of PM2.5.
In our results, the estimated effects varied according to different exposure time windows (figure 2). The associations between risks of ASD and PM2.5 exposure were significantly increased only during the third trimester and early childhood period, but not significant at the first and second trimesters. The results agreed with previous findings of critical periods for brain development in fetus [40] and young children [41], whenever is vulnerable to both the internal and external environmental hazards. PM2.5 can either transmit through placenta [42] or alveola [43] during prenatal and early childhood, respectively, and influence neural development at early ages. Other heterogeneous factors might include the background PM2.5 levels, diagnosed ages and locations. Our subgroup analyses revealed the effects of PM2.5 exposure were higher among studies with children diagnosed less or equal to age 5, suggesting PM exposure has an stronger impact on the risks of ASD diagnosed at a young age [44, 45].
Previous meta-analyses revealed inconclusive results regarding the association between PM exposure and risks of ASD [12, 20, 46]. The meta-analysis by Flores-Pajot et al concluded no significant association between ambient PM2.5 exposure and risks of ASD (RR = 1.34, 95% CI = 0.83–2.17) [20]. However, the study incorrectly included four studies reporting autism traits as their outcome of interest [19], which could lead to misclassification of the outcome. On the contrary, in 2016 the study by Lam et al summarized nine studies and concluded the 'limited evidence of toxicity' based on the positive associations between early life exposure to PM10 and the diagnosis of ASD (RR = 1.07, 95% CI = 1.06–1.08) [19]. This study was not convincing because of limited inclusion of studies and not considering specific exposure windows. The latest meta-analysis [12] reported an increased pooled RR of 1.68 (95% CI = 1.20–2.34) on the association between PM exposure and ASD development. Unfortunately, it had similar pitfalls, including considering ASD traits as the outcomes [19], a small number of studies, and not addressing time-specific risks of ASD. We believed our meta-analysis successfully addressed these issues and could provide convincing results.
Diagnosis of ASD is still challenging worldwide [47]. Firstly, there is no uniform diagnostic testing for certainty of autism, but only subjective assessing criteria [47]. For example, ASD administrative childhood prevalence ranged widely from 3 in 10000 children in Poland to 372 in 10000 in Hong Kong [48]. The huge disparity of ASD prevalence could not be explained merely by genetic variation between ethnicities and countries [1]. Thus over-diagnosis and under-diagnosis of ASD were possible across countries [49]. Secondly, the evolution of ASD diagnostic criteria from DSM-IV to DSM-V, which broadens the definition of ASD in 2014 [50, 51], also contributes to the prevalence of ASD over time. However, the above issues less likely affect the pooled effect estimates in this study because of the following reasons: first, the chance of over-diagnosis for the binary outcome is non-differential among exposed group and unexposed group, likely leading the bias to the null [52]. Second, our random effect models addressed the heterogeneities and uncertainty, including measurement errors, of overall effect measures from different study populations with larger confidence intervals than would have be obtained by using fixed effect models [53]. Third, all included studies were of high quality, with points from 7 to 9 by the NOQAS, supporting the validity of those data (supplementary table 3, appendices 2 and 3).
There are still a few potential limitations with this meta-analysis. As a complex disorder [54], autism results from the combination of genetic and environmental factors [55]. Some potential confounders (e.g. individual genetic variations) [1] and other co-exposed environmental factors [56] (e.g. heavy metal exposures) [8] remained unadjusted in most original studies. Nonetheless, studies included in this meta-analysis adjusted for the most important factors to some extent, such as sex, maternal ages, parental education, socioeconomic status (household income), birth year, smoking, ethnicity, and birth order. Internal analysis by comparing the estimates from nested case-control studies and the corresponding whole cohort, to eliminate confounding bias, were attempted but not attainable due to lack of data. We also acknowledged a potential misclassification of air pollution levels in different models. For example, those models based on living address [57] might not be able to correctly estimate and reflect a true exposure level individually [58]. However, it is unlikely that the misclassification is differential. That is, the probability of exposure being misclassified, if any, is independent of ASD status. A non-differential misclassification tends to bias results toward the null. As vast majority of studies focusing on PM2.5, we only summarized the effects by PM2.5 and were not able to estimate effects from various components of air pollutions due to limited evidence body. A previous case-control study conducted in Isreal showed that the odds of ASD remain the same (OR = 0.77; 95% CI = 0.59, 1.00) per 5.85 parts per billion increment of nitrogen dioxide (NO2) exposure from traffic pollution during pregnancy, but the OR for exposure during the 9 months after birth was 1.40 (95% CI = 1.09–1.80) [59].
Even though this meta-analysis has properly summarized the available epidemiological studies, further studies on the causation and biological mechanisms regarding the effects of PM exposure on ASD development are highly warranted.
5. Conclusion
This meta-analysis concluded that PM2.5 exposure was associated with increased risks of ASD in children, particularly with exposure windows during the third trimester and early childhood period. The effects of PM2.5 exposure per 10 μg m−3 increment revealed an exposure-responsive manner. Our findings suggested that PM2.5 exposure could possibly affect vulnerable populations at a low PM2.5 background level.
Acknowledgments
We sincerely thank Professor Hsieh C Chung from Harvard Chan School of Public Health for epidemiologic consulting and statistical support.
Contributions
CKL, YTC, FSL, and STC contributed to the study design, data analysis, reporting results, data interpretation, and drafting the manuscript. All authors gave final approval of the version to be submitted and any revised version.
Data availability statement
The data that support the findings of this study are available upon reasonable request from the authors.