

Abstract
Long-term mitigation scenarios developed by integrated assessment models underpin major aspects of recent IPCC reports and have been critical to identify the system transformations that are required to meet stringent climate goals. However, they have been criticized for proposing pathways that may prove challenging to implement in the real world and for failing to capture the social and institutional challenges of the transition. There is a growing interest to assess the feasibility of these scenarios, but past research has mostly focused on theoretical considerations. This paper proposes a novel and versatile multidimensional framework that allows evaluating and comparing decarbonization pathways by systematically quantifying feasibility concerns across geophysical, technological, economic, socio-cultural and institutional dimensions. This framework enables to assess the timing, disruptiveness and scale of feasibility concerns, and to identify trade-offs across different feasibility dimensions. As a first implementation of the proposed framework, we map the feasibility concerns of the IPCC 1.5 °C Special Report scenarios. We select 24 quantitative indicators and propose feasibility thresholds based on insights from an extensive analysis of the literature and empirical data. Our framework is, however, flexible and allows evaluations based on different thresholds or aggregation rules. Our analyses show that institutional constraints, which are often not accounted for in scenarios, are key drivers of feasibility concerns. Moreover, we identify a clear intertemporal trade-off, with early mitigation being more disruptive but preventing higher and persistent feasibility concerns produced by postponed mitigation action later in the century.
Export citation and abstract BibTeX RIS

Original content from this work may be used under the terms of the Creative Commons Attribution 4.0 license. Any further distribution of this work must maintain attribution to the author(s) and the title of the work, journal citation and DOI.
1. Introduction
What drives the feasibility of the systemic transformations required to reach the more ambitious climate goals? The discussions pertaining to feasibility are heating up, with some observers calling the 2°C world a 'fantasy' (Tollefson 2015), and others, like Christiana Figueres, the former Executive Secretary of the UN Framework Convention on Climate Change, suggesting that reaching 1.5°C largely depends on political will (Figueres 2018). Our paper contributes to these discussions by demonstrating how to evaluate feasibility concerns in a systematic way, and by putting more emphasis on tracing the trade-offs over time and dimensions rather than simply concluding that a certain pathway is not feasible.
Low-carbon scenarios of IAMs and other systemic approaches are widely used to shed light on the mitigation strategies to decarbonize the economy, energy and land-use systems (Weyant 2017, Bosetti 2021). Although these models have grown to represent an increasing number of features of reality, they fall short of including many of the processes, actors and incentives that affect the transformation in the real world (Trutnevyte et al 2012, Geels et al 2016, Li and Strachan 2019, Turnheim and Nykvist 2019, De Cian et al 2020, van Sluisveld et al 2020). Therefore, it is important to explore their feasibility in terms of the wide-ranging transformational changes they entail, and offer insights on when, where and what type of concerns are to be expected and how they can possibly be overcome (Rogelj et al 2013, Riahi et al 2015, Kriegler et al 2018, Jewell and Cherp 2020).
In this paper, we bridge insights from the literature on the concept of feasibility (Majone 1975a, Gilabert and Lawford-Smith 2012, Turnheim and Nykvist 2019, Jewell and Cherp 2020, Nielsen et al 2020), the IAM scenario comparison literature (Loftus et al 2015, van Sluisveld et al 2015, 2018, von Stechow et al 2016, Gambhir 2017, Napp et al 2017) and empirical work pertaining to different feasibility dimensions.
Conceptual contributions highlight how feasibility evaluations should consider the context of transformations (Gilabert and Lawford-Smith 2012, Schubert et al 2015, Jewell and Cherp 2020, Nielsen 2020). Actors, sectors, and regions involved in the transformation might have different levels of capacity, and capacity might be changing over time. Building on these considerations, we define feasibility as the degree to which scenarios lie within the boundaries of societal capacities for change in a given period. We stress the importance of a conceptual and operational distinction between feasibility and desirability (Jewell and Cherp 2020). While feasibility is a plausibility evaluation of what could be achieved, given societal capacities within a specific geographical and temporal context (Gambhir 2017, Napp et al 2017), desirability is a normative evaluation of the degree of compatibility with key societal goals, such as the Sustainable Development Goals (von Stechow et al 2016, Lamb and Steinberger 2017).
We present an operational framework that allows a systematic assessment and comparison of scenarios along key dimensions of feasibility identified in the 2018 IPCC Special Report (IPCC 2018). Importantly, our framework should not be interpreted as a final judgement on feasibility but rather as a tool to map out areas of concern and highlight enabling factors which can mitigate them. Drawing from earlier studies comparing scenarios (Loftus et al 2015, van Sluisveld et al 2015, 2018, von Stechow et al 2016, Gambhir 2017, Napp et al 2017), we map several key indicators onto geophysical, technological, economic, socio-cultural and institutional feasibility dimensions. We employ indicators measuring decadal changes, which allow us to assess the timing, disruptiveness and scale of the required transformation both across the century and at specific points in time (Kriegler et al 2018). We derive thresholds for all indicators and for increasing levels of feasibility concerns based on historical data and insights from empirical and scenario studies. Our paper presents a novel evaluation of institutional feasibility concerns at the regional level, thus addressing calls to bring in insights from the social sciences into scenario comparison efforts (Geels et al 2016, Nielsen 2020).
As the first implementation of our framework, we evaluate the scenarios from the 2018 IPCC Special Report, since they are the most comprehensive and up-to-date collection of scenarios available in the literature. Importantly, the set includes not only 1.5°C scenarios, but also scenarios that aim at 2°C and above, which allows exploring differences across different temperature goals. We show how our method allows a flexible aggregation of feasibility concerns within and across dimensions and time, and what type of insights can be gained. We also make available an interactive visual tool that allows the user to perform sensitivity analyses by assessing how feasibility evaluations change when selecting different thresholds for different indicators.
2. Systematic framework for scenario evaluation
From an interdisciplinary perspective, feasibility assessments can be defined as evaluations of different types of constraints (Majone 1975a, 1975b). IAMs scenarios highlight under which conditions certain climate goals can be feasible or infeasible (Riahi et al 2015), and provide insights on geophysical, economic and technological constraints of mitigation options based on stylized assumptions. However, what is feasible in models might not be feasible in the real world and vice versa (Kriegler et al 2018, Rogelj et al 2018).
To evaluate the feasibility of scenarios generated by models one can either focus on model validity, assessing models' underlying assumptions and input data (Krey et al 2019), or evaluate model output data, benchmarking them to the current knowledge regarding different types of constraints that might affect the feasibility of climate scenarios (Wilson et al 2013, van Sluisveld et al 2015, 2018). We present a framework that follows the latter approach. This requires deciding first what type of dimensions should be considered.
The 2018 IPCC report (2018) introduced a feasibility assessment of mitigation and adaptation options along six dimensions: (a) geophysical, focusing on physical potentials and scarce resources; (b) technological, focusing on technical scalability and maturity of technologies; (c) economic, focusing on economic viability; (d) socio-cultural, focusing on acceptance of policies and behavioral changes; (e) institutional, focusing on institutional capacity; and (f) ecological, focusing on environmental co-benefits and trade-offs. We argue that ecological impacts, such as impacts on biodiversity, water and other natural resources, as well as impacts on human health, hunger, poverty, and inequality, pertain to desirability evaluations. Given our focus on feasibility instead of desirability, we omit the ecological dimension from our analysis and propose to analyze it as part of desirability evaluations (von Stechow et al 2016, Luderer et al 2019, Lamb et al 2020).
While feasibility evaluations present in the 2018 IPCC report focused on specific mitigation and adaptation options (for example having high shares of wind or solar technology as a key mitigation option on the supply side), our framework is devised to compare scenarios. The major steps within our framework are summarized in figure 1. Employing data reported by IAMs scenarios, (a) we define five key feasibility dimensions; (b) for each dimension, we select a set of relevant indicators measuring decadal changes (using either indicators reported by scenarios or performing additional calculations where necessary); (c) based on past literature and empirical data, we propose thresholds to define low, medium, and high feasibility concerns for each indicator in each decade; and (d) based on the feasibility evaluations of each indicator in each decade, we can then compute aggregated feasibility concerns both within or across dimensions and time.

Figure 1. Steps and details of our general framework for scenario evaluation.
Download figure:
Standard image High-resolution imageBy employing indicators measuring changes at the decadal level, which is currently the lowest available time period in most IAM scenarios, our approach allows capturing the timing (the specific decade), disruptiveness (the level of transformation in a given point in time) and scale (the level of transformation over the whole period of time) of the transformative change required within each dimension (Kriegler et al 2018). In the following section we provide more details for each dimension and indicator, with additional explanations and figures provided in the SM.
Importantly, our framework is extremely flexible. It allows performing feasibility evaluations based on different sets of thresholds, and other dimensions and indicators can be added in the future, also depending on which variables are available in the scenario set under evaluation. We developed an interactive visual tool that allows the user to define different thresholds for all indicators and see how this impacts feasibility evaluations within and across dimensions and time for different climate categories. The visual tool is publicly available online at https://data.ece.iiasa.ac.at/climate-action-feasibility-dashboard/
3. Data and methods
3.1. Scenario data
We employ our framework to perform a first multi-dimensional feasibility evaluation of the set of scenarios developed for the 2018 IPCC Special Report on 1.5°C (Forster et al 2018, IPCC 2018), which also includes scenarios that aim at 2°C and above (Huppmann et al 2018, 2019). To ensure the comparability of scenarios, we evaluate scenarios that belong to the same climate target category and make the same underlying assumptions about socio-economic drivers (belonging to the same so-called Socio-economic Pathways (SSPs) (for more details on the assumptions see (Kriegler et al 2017, Riahi et al 2017)). In section 4, we present a possible implementation of our framework focusing on scenarios reaching the 1.5°C temperature target and following SSP2, assuming current trends in population, GDP, energy demand, and governance. We present results for other temperature targets in the visual tool that supplements this paper. Overall, we show that, as expected, more ambitious climate targets systematically raise more feasibility concerns.
3.2. Method and indicators
We define thresholds for each indicator by reviewing the relevant literature and historical data (see table 1, sections 3.2.1–3.2.5, and sections 1–6 of the SM for more analyses and details (available online at stacks.iop.org/ERL/16/064069/mmedia)). Based on these thresholds, we assign low (a), medium (b) and high (c) feasibility concern levels to each indicator in each decade. We compute aggregate feasibility concerns across time and across the five feasibility dimensions employing the geometric mean, which reduces the level of compensation across dimensions (and is also used for the Human Development Index and in many other contexts, as shown in the overview by Van Puyenbroeck and Rogge (2017)). Table 1 shows that the majority of the thresholds were derived based on our own empirical analyses but also that for some indicators the empirical evidence is still scarce. This is especially true for the socio-cultural dimension, where we focus on demand side changes and for the emerging technologies.
Table 1. —Indicators selected for the five feasibility dimensions. In this table we indicate the general approach to derive the thresholds and point to the specific section in the SM, where more details and citations can be found. All indicators are defined at the decadal level. Please refer to the visual tool to explore the sensitivity of results to the selection of different thresholds: https://data.ece.iiasa.ac.at/climate-action-feasibility-dashboard/. The framework includes both demand and supply side mitigation measures, and focuses on sectors where rapid decarbonization is required.
| Indicator | Computation | Medium concern threshold | High concern threshold | Sources |
|---|---|---|---|---|
| Geophysical constraintsIndicators measuring technical potentials (not accounting for desirability considerations) (SM section 2) | ||||
| 1.1 Wind energy generation | Total secondary energy generation from wind in a given decade (EJ) | 830 | 2000 | Deng et al (2015), Eurek et al (2017) |
| 1.2 Solar energy generation | Total primary energy generation from solar in a given decade (EJ) | 1600 | 50 000 | Moomaw et al (2011) |
| 1.3 Biomass energy generation | Total primary energy generation from biomass in a given decade (EJ) | 300 | 600 | Slade (2011) |
| Economic constraints Indicators measuring economic mitigation efforts or costs (SM section 3) or costs (SM section 3) | ||||
| 2.1 Carbon price | Carbon price levels (NPV) and decadal increases | 60$ | 120$ and 5× | Own analysis (based on World Bank data) |
| 2.2 GDP losses | Decadal percentage difference in GDP in mitigation vs baseline scenario | 5% | 10% | Analogy to current COVID-19 spending Andrijevic et al (2020b) |
| 2.3 Energy investments | Ratio between investments in mitigation vs baseline in a given decade | 1.2 | 1.5 | Various reports and related studies |
| 2.4 Stranded coal assets | Share of prematurely retired coal power generation in a given decade | 20% | 50% | Own analysis based on the current fleet of coal power plants (Global Energy Monitor 2021) |
| Technological constraintsIndicators assuming ideal conditions for technological growth (SM section 4) | ||||
| Electricity sector | ||||
| Established technologies | ||||
| 3.1 Wind scale-up | Decadal percentage point increase in the wind share in electricity generation | 10 pp | 20 pp | Own analysis; Wilson et al (2020) |
| 3.2 Solar scale-up | Decadal percentage point increase in the solar share in electricity generation | 10 pp | 20 pp | Own analysis; Wilson et al (2020) |
| 3.3 Nuclear scale-up | Decadal percentage point increase in the nuclear share in electricity generation | 5 pp | 10 pp | Own analysis; Markard et al (2020), Wilson et al (2020) |
| Emerging technologies | ||||
| 3.4 Biomass scale-up | Decadal percentage point increase in the biomass share in electricity generation | 2 pp | 5 pp | Analogies and related studies |
| 3.5 CCS with coal scale-up | Decadal percentage point increase in the share of coal with CCS in electricity generation | 2 pp | 5 pp | Analogies and related studies |
| 3.6 BECCS scale-up | Decadal percentage point increase in the share of BECCS in electricity generation | 2 pp | 5 pp | Analogies and related studies |
| Transport sector | ||||
| 3.7 Biofuels in transport scale-up | Decadal percentage point increase in the share of biofuels in the final energy demand of the transport sector | 10 pp | 15 pp | Various reports and related studies |
| 3.8 Electricity in transport scale-up | Decadal percentage point increase in the share of electricity in the final energy demand of the transport sector | 10 pp | 15 pp | Various reports and related studies |
| Socio-cultural constraints Indicators assessing shifts in demand associated with attitudinal and behavioral changes (SM section 5) | ||||
| Energy sector | ||||
| 4.1 Total energy demand decline | Decadal percentage decrease in energy demand | 10% | 20% | Grubler et al (2018) |
| 4.2 Energy demand decline in transport sector | Decadal percentage decrease in energy demand | 10% | 20% | Grubler et al (2018) |
| 4.3 Energy demand decline in industry sector | Decadal percentage decrease in energy demand | 10% | 20% | Grubler et al (2018) |
| 4.4 Energy demand decline in residential sector | Decadal percentage decrease in energy demand | 10% | 20% | Grubler et al (2018) |
| Land sector | ||||
| 4.5 Decline of livestock share in food demand | Decadal percentage decrease in the livestock share in total food demand | 0.5 pp | 1 pp | Various reports |
| 4.6 Forest cover increase | Decadal percentage increase in forest cover | 2% | 5% | Own analyses based on FAO data |
| 4.7 Pasture cover decrease | Decadal percentage decrease in pasture cover | 5% | 10% | Own analyses based on FAO data |
| Institutional constraints Indicator measuring the institutional capacity to decarbonize (SM section 6) | ||||
| 5.1 Governance level and decarbonization rate | Governance levels and per capita CO2 emission reductions over a decade | >0.6 and <20% | <0.6 and >20% | Own analysis using data from Andrijevic et al (2019) |
3.2.1. Geophysical feasibility
To assess the geophysical feasibility of scenarios determined by the availability of resources, we focus on key mitigation technologies and evaluate for each decade the levels of primary energy generation from biomass and solar, and the levels of secondary energy generation using wind in electricity (de Vries et al 2007, Moomaw et al 2011). Similarly to the assessments in the 2018 IPCC Special Report, which also relied on the insights from past literature (Moowaw et al 2011), we conclude that while some scenarios are close to the upper (optimistic) limits of the technical potential estimates for biomass (Slade 2011, Skea et al 2019), none of them exceeds the technical potential of solar and wind energy generation (see SM, section 2 for more details). Overall, we conclude that the vast majority of the pathways do not violate geophysical limits (which however do not include any desirability considerations), and thus focus the rest of paper on the other four feasibility dimensions.
3.2.2. Economic feasibility
Mitigation costs and efforts are another important determinant of the feasibility of decarbonization pathways and have been utilized in many inter-model comparison studies (Tavoni and Tol 2010, Paltsev and Capros 2013). To assess the economic feasibility of scenarios, we select four established indicators commonly employed to capture mitigation costs, measuring (a) carbon prices, (b) GDP losses; (c) energy investments, and (d) stranded coal generation (see SM, section 3 for more details for each indicator and threshold).
While there are reasons to argue that carbon prices are also relevant to socio-cultural feasibility, IAMs employ carbon prices as a measure of mitigation effort (Paltsev and Capros 2013, Rogelj et al 2013) and mostly only report them at the global level. As public attitudes towards carbon pricing mechanisms crucially depend on highly contextual social and political factors and specific policy design features (Bristow et al 2010, Drews and Bergh 2016, Klenert et al 2018, Beiser-McGrath and Bernauer 2019), assessing the socio-cultural feasibility of carbon prices is currently hampered by the data provided in the set of scenarios under consideration.
3.2.3. Technological feasibility
Under the technological feasibility dimension, we evaluate, from a purely technological and supply-side perspective (not accounting for institutional or social constraints), whether scenarios display rates of transformation of the power generation and transport sectors that are likely to be concerning (for details on each indicator and threshold, see SM, section 4). For the electricity sector, we select a first set of indicators measuring the scale-up of more established low-carbon energy technologies (including solar, wind and nuclear). As many scenarios also rely on technologies that are not yet established to reach ambitious climate goals (Rogelj et al 2018), we include a second set of indicators measuring the scale-up of energy production from emerging technologies, including biomass, the scale-up of CCS with coal and of bioenergy with CCS (BECCS). We build on the insights from a recent study on the granularity of technologies (Wilson et al 2020) and propose stricter thresholds for the so-called 'lumpy' technologies (nuclear and CCS) as compared the granular ones (wind and solar). For the transport sector, we select indicators measuring the scale-up of electricity and biofuels.
3.2.4. Socio-cultural feasibility
Past research shows that climate policies and the pace of transformation are affected not only by institutional factors (see section 3.2.4) but also by people's attitudes and behaviors (Kachi et al 2015, Andrijevic et al 2020a). Thus, it is plausible to assume that climate action should be easier in societies with more pro-environmental attitudes, even though more research is required to better understand the relationship between attitudes and climate action (Steg 2018). As IAMs currently do not include any variables that quantify this dimension, we base our socio-cultural feasibility evolution on proxies related to shifts in lifestyles which could be substantially affected by changes in attitudes and behaviors.
The current dominant approach in the IAMs community is to proxy changes in lifestyles by assuming substantial reductions in demand across different sectors (van den Berg et al 2019). Here we consider transformations affecting the energy sector (including reductions in energy demand within key sectors) and transformations affecting the land sector (including reductions in carbon-intensive food demand and changes in forest and pasture cover). In section 5.1 of the SM we report some exploratory analyses assessing the relationship between environmental performance and proxies that were found to be key correlates of environmental attitudes and behavior, such as education levels (Muttarak and Lutz 2014, Kachi et al 2015, Hoffmann and Muttarak 2020) and gender equality (Mavisakalyan and Tarverdi 2019, Andrijevic et al 2020a). We discuss this finding in more detail in section 4.1.
3.2.5. Institutional feasibility
To assess institutional feasibility concerns, we developed an indicator that allows tracing whether the assumed mitigation effort in a given scenario and decade is matched by the projected governance capacity in the region under consideration. We rely on the governance projections for different SSPs developed by Andrijevic et al (2019) and identify a governance level associated with high environmental performance (see SM, section 6 for more details). We define low, medium and high institutional feasibility concerns based on the combined consideration of governance levels and decadal decrease in per capita CO2 emissions observed in countries that achieved significant mitigation goals. We evaluate feasibility concerns at the regional level and then aggregate them to define global institutional feasibility concerns.
When developing the institutional feasibility indicator, we explored different dimensions of governance, such as government effectiveness and regulatory quality (see SM, section 6.1). However, as for our purposes and given our set of scenarios looking at different governance dimensions does not lead to new insights, we employ an aggregate governance measure. We hope that future research will build on our insights and explore different governance dimensions with more granular data that might become available with a new generation of climate scenarios.
4. Implementation of the framework
We propose here a first implementation of our framework, employing the selection of indicators and thresholds described above. We quantify the feasibility concerns across time and dimensions for scenarios reaching the 1.5°C target. Sensitivity analyses based on stricter thresholds across all indicators do not change the overall trends but might increase overall feasibility concerns (see SM, section 7 and the interactive visual tool). Rather than making claims about which pathways are feasible or not feasible in the real world, we focus on the trade-offs over time and across dimensions. As has been pointed out by many scholars in the past, the feasibility frontier might quickly shift, and what seems challenging from today's point of view might become attainable in the future (Rogelj et al 2018, Jewell and Cherp 2020).
4.1. Trade-offs across feasibility dimensions
A key question that has already motivated a large part of feasibility research is which feasibility concerns might be of key relevance (Jewell and Cherp 2020). Our framework helps to systematize and operationalize such efforts and offers some insights into trade-offs across different dimensions. Indeed, many pathways might appear feasible on one dimension (such as supply upscaling) at the expenses of another dimension (such as demand shifts).
Figure 2 offers a broad overview of the IPCC SR1.5 scenarios when all of the feasibility indicators are aggregated over time for the different dimensions. The institutional dimension is clearly standing out, suggesting that in many scenarios there is a mismatch between assumed levels of mitigation effort and mitigation capacity. Our additional empirical analysis (SM, section 6.1) shows that the key governance dimension driving environmental performance is government effectiveness, i.e. the quality of public and civil service provision, which is independent of political regime type. Institutional constraints are often defined as 'soft' constraints (Gilabert and Lawford-Smith 2012), and enabling factors such as international cooperation and foreign aid through financial support and capacity building can contribute to overcoming them.
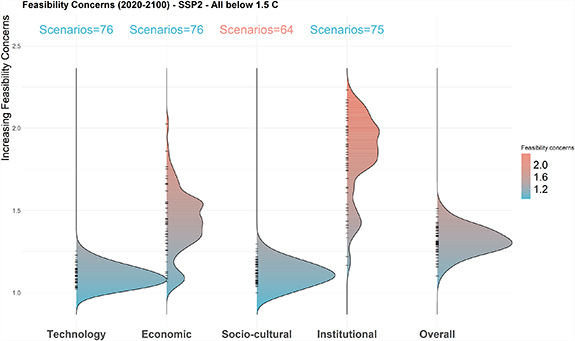
Figure 2. Distribution of feasibility concerns across the 1.5 °C pathways included in the IPCC SR1.5.
Download figure:
Standard image High-resolution imageDeveloped countries have currently pledged to provide $100 bln every year to support countries with low mitigation and adaptation capacity (Pauw et al 2020). However, a recent study suggests that this might be insufficient given that mitigation measures listed in conditional NDCs amount to at least $3 trillion (Pauw et al 2020). Traditionally, foreign aid is allocated based on equity principles, targeting the poorest countries, but tackling climate change might require additional focus on regions and areas where aid can have the highest impact on mitigation efforts. Moreover, while aid measures related to technology were dominating in the past (Kim 2019), it might be necessary to rethink which sectors and measures should get more attention.
Our analysis of socio-cultural proxies highlights the correlation of mitigation capacity not only with good governance but also with high levels of education and gender equality (see SM, sections 5 and 6). We therefore suggest that international cooperation efforts might be most effective with a balanced portfolio of investments and capacity building in low carbon infrastructure, governance, gender equality and education in regions with limited mitigation capacity (Muttarak and Lutz 2014, Hoffmann and Muttarak 2020).
Focusing on economic feasibility, Figure 2 also shows that the overall distribution of mitigation cost profiles is relatively wide in the assessed ensemble of scenarios. This is in part driven by different model types with different macro-economic assumptions (Kriegler et al 2015), but is also due to model sensitivity to economic specifications (Emmerling et al 2019).
Both the technology and the socio-cultural dimensions do not raise major feasibility concerns. This finding is not surprising because many modeling teams focus on incorporating information about technology maturity, costs, and other considerations, especially at the global level (Wilson et al 2013). However, it is important to emphasize that the technological dimension focuses on what is plausible from a technological diffusion perspective and does not incorporate concerns that might arise based on public attitudes and preferences with respect to different technologies.
Socio-cultural feasibility concerns are also relatively low. There are two possible explanations for this finding. First, few scenarios rely on demand-side mitigation strategies, which might face higher socio-cultural challenges due to the required behavioral and attitudinal changes (Creutzig et al 2016, 2018). Second, many models report a limited number of indicators relevant to the socio-cultural dimension. Since in the set of scenarios that we analyze, the socio-cultural dimension has the lowest coverage (only 64 scenarios report at least 5 indicators out of 7), our confidence in the assessment of feasibility concerns in this dimension is the lowest.
4.2. Institutional feasibility and trade-offs across regions
We evaluate institutional feasibility at the regional level, which is critical for assessing where major feasibility concerns might arise and to take into account the context-dependence of this dimension (Gilabert and Lawford-Smith 2012, Jewell and Cherp 2020, Nielsen 2020).
Our assessment shows that institutional feasibility concerns are comparatively modest in the OECD region (see figure 3). Across all pathways, Asia (R5ASIA), the Reforming Economies including Russia (R5REF) as well as the Middle East and African region (R5MAF) show major institutional concerns around mid-century. Institutional feasibility is also more challenging in the short and medium term, as governance is projected to improve in many regions over time (Andrijevic et al 2019). Recent studies highlight the large share of committed emissions in the Asian region and the relatively young coal power fleet (the current average coal fleet age is 11.1 years in China and 12.2 years in India), which increases the challenges of decarbonizing the electricity sector in these regions (Cui et al 2019, Tong et al 2019).
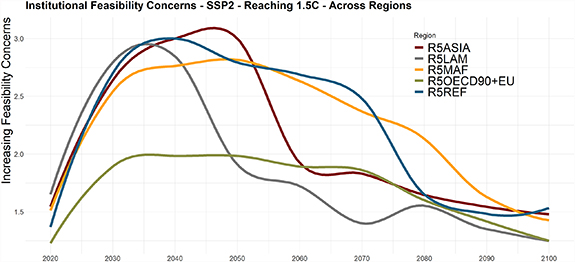
Figure 3. The evolution of regional institutional feasibility concerns of scenarios reaching the 1.5°C temperature target.
Download figure:
Standard image High-resolution image4.3. Trade-offs over time
One of our framework's major advantages is that it allows exploring intertemporal trade-offs and thus contributes to answering the question of when (Jewell and Cherp 2020) to expect major feasibility concerns in the pathways that are under evaluation. In panel A of figure 4, we display the evolution over time of aggregated feasibility concerns across major climate categories. A clear insight of this exercise is that pathways pursuing ambitious climate goals and immediate policy action are associated with a disruptive transformation early on but then present fewer challenges and risks later, as well as less volatility and thus less uncertainty. Additionally, less ambitious climate targets require less radical system transformations and raise fewer feasibility concerns (though they do raise desirability concerns). Reaching 1.5°C with high overshoot raises challenges for most of the century: overshoot pathways require deeper transformation across carbon-intensive sectors in the second part of the century, and present higher reliance on risky negative emission technologies (Bosetti et al 2009, Clarke et al 2009, Krey and Riahi 2009, Bertram et al 2015).

Figure 4. Illustration of feasibility concerns and trade-offs over time for the period 2020–2100. Panel A shows the time evolution of aggregated feasibility concerns across climate categories. Panel B compares 1.5°C scenarios with immediate and delayed policy action. The lines illustrate general trends in scenarios that fall into the category under consideration after performing locally weighted smoothing.
Download figure:
Standard image High-resolution imageIn panel B of figure 4, we compare scenarios that reach the 1.5°C target and are classified as either immediate policy action (i.e. with a global commitment to mitigate as of 2020) or delayed policy action. This comparison highlights the vital role of enabling factors, in line with many studies that have shown the importance of the timing of international cooperation to support global mitigation action. Our framework confirms that jump-starting international climate policy action instead of delaying it for another 10 years can smooth out feasibility concerns. Conducting a simple statistical test, we find that delayed policy action significantly increases aggregate feasibility concerns compared to immediate action. This result is robust to controlling for model family and holds true across different model types (see SM, section 7).
4.4. Trade-offs across scenario archetypes
In this section, we focus on specific scenario 'archetypes', or pathways that are illustrative of a prominent mitigation strategy to reach the 1.5°C target (for more details and see Forster et al 2018). In the following illustration (figure 5), we compare the evolution over time of overall feasibility concerns of four illustrative pathways from the 2018 IPCC Special Report that reach the 1.5°C goal (RCP 1.9): the SSP-2 scenario developed by MESSAGE-GLOBIOM 1.0, which relies on supply-side mitigation and technological carbon dioxide removal (S2/P3); the low energy demand scenario (Grubler et al 2018), which relies on demand-side mitigation and negative emissions only from afforestation (LED/P1); the S1 scenario developed by AIM/CGE 2.0, which represents assumptions from SSP1, the sustainable development pathway with high levels of governance and more resource-efficient lifestyles (S1/P2); and the S5 scenario developed by REMIND-MAgPIE 1.5, which follows SSP 5 assumptions, with high levels of governance but highly resource-intensive lifestyles (S5/P4).

Figure 5. Illustration of feasibility concerns aggregated over all dimensions for the period 2020–2100 for four illustrative pathways from the 1.5 °C scenario ensemble.
Download figure:
Standard image High-resolution image
As mentioned earlier, the evidence about demand-side mitigation options is limited (Grubler et al 2018, Mundaca et al 2019, van den Berg et al 2019). The LED scenario, however, illustrates how a rapid and disruptive demand-side transformation by 2030 might avoid decarbonization challenges later in the century, significantly reducing also long-term feasibility risks and the associated uncertainties of the burden of climate mitigation for future generations. S1/P2, which assumes better governance levels, is less disruptive in the near term, and represents a relatively smooth transformation with low/intermediate feasibility concerns in the medium and long term. Feasibility concerns of S2/P3 are also smooth but slightly higher than in S1/P2, presenting more concerns later in the century due to higher reliance and investments into negative emissions technologies. Finally, S5/P5 presents the most volatile pathway, requiring major disruptions around mid- and late century. This is, similarly to S2/P3, mostly driven by a high level of negative emissions that are deployed in the second half of the century in order to reach the climate target of 1.5°C.
5. Conclusion
This paper fills a knowledge gap by presenting a new conceptual and operational framework with quantitative indicators for the multidimensional feasibility evaluation of IAMs scenarios. We show that a holistic and systematic framework taking into account geophysical, technological, economic, socio-cultural and institutional dimensions and assessing trends over time is essential for understanding the trade-offs that mitigation pathways might entail. Our framework allows highlighting for instance how some scenarios might lie within the boundaries of what is considered feasible from a technological perspective but assume rapid decarbonization in regions with low institutional capacity.
Employing our framework to analyze the 1.5°C scenario ensemble, we find that significant concerns are related to the institutional feasibility dimension. There is scarce empirical work quantifying the role of governance capacity in the implementation of climate policies supporting supply- and demand-driven transformations. This presents an opportunity for future research to systematically explore the role of governance and link it to the discussion on enabling conditions for a faster transition. This finding also highlights the importance of performing feasibility analyses at the regional level. In the future, feasibility evaluations should develop regional thresholds not only for institutional feasibility indicators but also for other dimensions and indicators, taking for instance into account regional technology potentials or contextual socio-cultural constraints to the scale-up of carbon prices. This would constitute another major step to take into due account fundamental contextual factors (Jewell and Cherp 2020, Nielsen 2020).
Our analyses also highlight that scenarios are conservative with respect to their assumptions on demand-side transformations (or the implied behavioral changes), suggesting that the power of demand-side changes might be underexplored in existing IAMs scenarios (Creutzig et al 2018, Grubler et al 2018). Future research should explore demand-side mitigation strategies more systematically, employing robust empirical evidence.
Moreover, our article provides the policy-relevant insight that delaying emission reductions amplifies overall feasibility concerns, postponing and increasing transition challenges rather than avoiding them. Taking into account temporal trade-offs is thus essential and future research should explore whether rapid and disruptive or incremental and persistent transformations are more feasible.
Finally, desirability remains an important dimension to explore. Besides identifying scenarios that might cross feasibility boundaries, it is essential to identify scenarios that impair key societal goals like poverty or hunger reduction and biodiversity protection. Since not all feasible scenarios are desirable, investigating and systematically assessing the trade-offs between feasibility and desirability is also essential.
Acknowledgments
We are grateful to Jarmo Kikstra, Daniel Huppmann and other IIASA team members as well as our partners from the ENGAGE project for their helpful comments on the earlier versions of this draft and presentations during project meetings. We acknowledge the work by integrated model teams that contributed to the 1.5 °C scenario explorer, and especially Daniel Huppmann for setting new standards in the community. This study was partially funded by the European Union's Horizon 2020 research and innovation programme under Grant Agreement 821471 (ENGAGE).
Data availability statement
All data that support the findings of this study are included within the article (and any supplementary files).