

Abstract
Forests are subject to a range of management practices but it is unclear which produce the most rapid rates of regrowth across heterogeneous moisture gradients produced by regional climate and complex terrain. We analyzed recovery rates of satellite derived net primary productivity (NPP) over 27 years for 26 069 individual silvicultural treatments (stands) across the western U.S. at a 30 m resolution. Rates of NPP recovery and forest regrowth were on average 116% higher in wet landscapes with lower annual climatic water deficits (8.59 ± 5.07 gC m−2 yr−2, median ± inter-quartile range) when compared to dry landscapes (3.97 ± 2.67 gC m−2 yr−2). This extensive spatial analysis indicates that hydroclimate is a dominant driver of forest regrowth and that responses can be highly nonlinear depending upon local climate conditions. Differences in silvicultural treatment also strongly controlled rates of regrowth within hydroclimatic settings; microclimates produced by shelterwood treatments maximized regrowth in dry landscapes whereas regrowth following clearcutting was among the fastest in wet landscapes due to enhanced energy availability. Conversely, commercial thinning regrowth rates were insensitive to hydroclimate and relatively consistent across the western U.S. Planting had a differential effect on forest structure and rates of regrowth across hydroclimate with negative effects in wet environments and positive effects in dry environments. In aggregate, this study provides a novel remote sensing approach for characterizing forest regrowth dynamics across climatic gradients and the common treatment options employed.
Export citation and abstract BibTeX RIS

Original content from this work may be used under the terms of the Creative Commons Attribution 4.0 license. Any further distribution of this work must maintain attribution to the author(s) and the title of the work, journal citation and DOI.
1. Introduction
Forest harvest in the United States (U.S.) has a significant impact on the net terrestrial carbon balance (Williams et al 2016). Harvest occurs across an average of 4.4 million ha of forested lands each year in the U.S. and has important implications for local communities, including timber and fiber production, regional water supply and quality and provision of important ecosystem services. As one example in 2011, 362 million m3 of timber was harvested from U.S. forests for industrial products and domestic fuelwood (Oswalt et al 2014). In addition, the forest products industry employs roughly 1 million workers annually, accounting for ∼6% of the total U.S. manufacturing gross domestic product (Oswalt and Smith 2014). Forest harvest intensity varies depending on desired outcomes (Nyland 2016), including maximizing commercial timber extraction or for generation of high light environments (e.g. clear cutting), enhancement of structural diversity to promote microclimates and habitat (e.g. shelterwood cutting), or removal of a portion of trees in a stand to promote development of others (e.g. thinning). Although forests are harvested for a range of management outcomes, it is still unclear how climate and different treatment strategies combine to impact rates of forest regrowth following harvest across large scale moisture gradients.
Forest harvest is known to affect many processes across scales including watershed discharge dynamics (Harr et al 1979, 1982, Jones and Grant 1996, Jones 2000, Buttle et al 2018, Safeeq et al 2020), global carbon stores (Johnston and Radeloff 2019) and soil and riparian microclimates (Moore et al 2005, Stoffel et al 2010). Harvest impacts on water quantity and quality have been studied extensively, and results point towards stream flow (Hewlett and Hibbert 1967, Likens et al 1970, Goeking and Tarboton 2020), stream temperature (Moore et al 2005) and stream biogeochemistry (Feller 2005, Wang et al 2006) impacts that are generally dependent on harvest intensity. There are also ecological implications of harvest, including initial reduction and subsequent recovery of carbon storage (Houghton et al 1999), alteration of forest floor and soil carbon (Nave et al 2010, James and Harrison 2016), changes in soil microbial communities—especially fungi (Hartmann et al 2012) and modification of suitable habitat and migration corridors for biota (Schmiegelow and Mönkkönen 2002, Kline et al 2016). It is critical to quantify the relative recovery rates of hydrological and ecological processes (Moore and Wondzell 2005) as well as their sensitivities to regional climate and varied silvicultural treatments in order to understand the short and long term impacts of harvest. Further, existing regulatory law and policy requires forest regeneration after timber harvest for federal agencies (see NFMA 1976, 2012 Planning Rule 36 CFR 219) and in some cases private landowners.
The regrowth of forests following harvest is a complex process that responds to many factors. Climate, soil properties, nutrients, species composition, pre- and post-harvest forest structure, seedling sources and establishment are considered among the most relevant (Frolking et al 2009, Nunery and Keeton 2010, Bartels et al 2016, Nyland 2016). Forest treatments currently use existing vegetation as proxies for planning future forest structure and composition. These plans are based on static maps for habitat and forest species distribution that may be course in resolution. However, anticipating contemporary forest regrowth is complicated as regional climate changes (Anderson‐Teixeira et al 2013, Luo and Chen 2013) impacting average temperature and precipitation distributions (Dore 2005, Brohan et al 2006), as well as the occurrence of extreme events such as drought (Dale et al 2001, Hirabayashi et al 2013) and processes such as CO2 fertilization (Zhu et al 2016). Despite the large number of processes impacting forest regrowth rates, past research has described rates of forest recovery using field data from plots (Seedre et al 2014, Bartels et al 2016, Stevens-Rumann and Morgan 2019) and recovery is often estimated using tools such as the Forest Vegetation Simulator (Wykoff et al 1982, Dixon 2002). However, it is challenging to translate measured rates of regeneration from individual plot or field level studies to broad regions due to differential definitions of regeneration, different magnitudes of disturbance, determination of regeneration benchmarks and difficulty capturing the heterogeneity of abiotic drivers exhibited across large domains, all of which may lead to different absolute rates of regrowth.
The proliferation of spaceborne remote sensing datasets and computational capabilities have expanded opportunities to estimate productivity (Running et al 2004), detect disturbance (Masek et al 2008, 2013, Schroeder et al 2011) and assess relative rates of recovery post-disturbance (Schroeder et al 2007, Madoui et al 2015, Cooper et al 2017, White et al 2017, 2018). Remote sensing offers considerable advantages in spatial coverage, increased frequency of observations and consistency of datasets over long time series (e.g. Landsat time series range from 1984-present with 16 days imaging frequency). Forest recovery after disturbance has been quantified using change in measured spectra from surface reflectance; metrics such as the difference Normalized Burn Ratio (dNBR; Key and Benson 2006), where the time to recovery (for either harvest and burn) is commonly calculated as a return to a percentage of the pre-disturbance value (Kennedy et al 2012, White et al 2017, 2018). Recent research has focused on corroborating remotely sensed measures of recovery with plot scale data (White et al 2019) thereby improving the potential to estimate post-disturbance forest dynamics in space and time. While spectral indices such as the dNBR provide important insight into temporal dynamics of ecosystems and recovery post disturbance, they do not directly approximate rates of ecosystem regrowth and recovery of primary productivity, an important component of forest regeneration.
A key knowledge gap in our understanding of forest response to harvest is the effect of and interactions between local moisture availability and silvicultural treatment strategy on forest regrowth dynamics. To address this knowledge gap we quantified the relative decline and recovery of forest net primary productivity (NPP) following harvest from 1986 to 2019 across the western U.S. Our approach combined georeferenced forest harvest information from the United States Department of Agriculture (USDA) Forest Service's Forest Activity Tracking System (FACTS) database and trends in NPP derived from Landsat data at a 30 m resolution. We also evaluated the recovery of forest structural characteristics ∼30 years following clearcut harvests using modeled tree height data derived from space-borne light detection and ranging (LiDAR) and Landsat derived percent tree cover. This novel approach allowed us to compare forest regrowth across silvicultural treatments and hydroclimatic gradients in order to evaluate which treatments maximize recovery of forest productivity in different landscapes across the western U.S.
2. Methods
2.1. Study domain
We used the western United States (U.S.) as our study domain for this analysis. We chose this region in part because of the large gradient in available moisture for forest growth and productivity as well as the legacy of forest harvest in the region. We defined the western U.S. as the eastern border of Montana, Wyoming, Colorado and New Mexico (states included are WA, ID, MT, OR, WY, CA, UT, NV, CO, AZ and NM). More specifically, our study domain is restricted to locations that experienced forest harvest by the U.S. Forest Service within the western U.S. Therefore, our analysis is representative of National Forest lands within the western U.S.
2.2. FACTS database
The FACTS is a forest activity database that documents a range of management activities, including harvests, burns, planting, inventory and range improvements on National Forest lands across the United States. We used the FACTS database to determine spatial patterns and temporal occurrence of harvest (figure 1). The FACTs contains many administrative and geographic meta-datasets which were used to filter the geographic and temporal extent of the study. We filtered the database for harvests that were conducted in the western U.S. and completed during 1990, 1991 and 1992. This temporal filter allowed us to compute pretreatment rates of productivity (beginning in 1986; described below) and maintain a 27 year period of record following harvest for our study sites. We removed salvage cutting silvicultural treatments from the catalog because it was unclear when pretreatment NPP was affected by previous disturbance (e.g. insects, fire; see computation of relative NPP below).
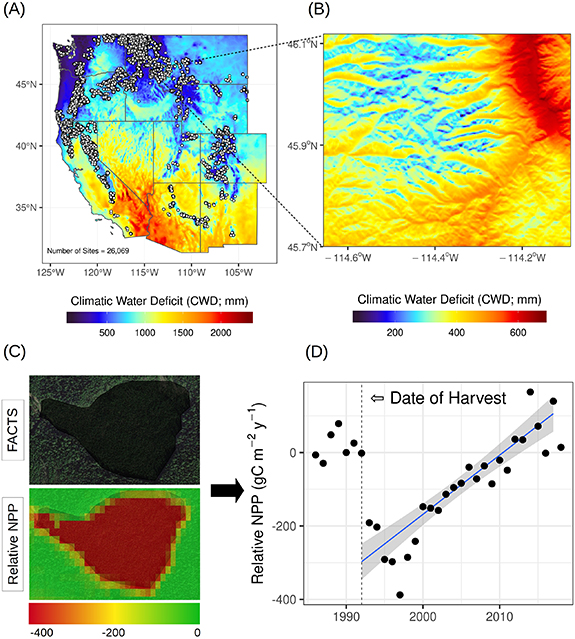
Figure 1. (A) Study domain showing the climatic water deficit (CWD) and the locations of the 26 069 silvicultural treatments considered, (B) an example region showing the elevation and aspect induced gradients in the CWD for the southern Bitterroot Mountains in Montana, (C) a single polygon showing a harvest boundary conducted in 1992 from the United States Forest Service Activity Tracking System (FACTS) database and the associated relative net primary productivity (NPP) for 1997, and (D) site-specific relative NPP timeseries (annual NPP averaged across treatment domain) and the associated regrowth rate regression (blue line) with 95th confidence interval (gray shading).
Download figure:
Standard image High-resolution imageWe evaluated rates of regrowth for the six most common individual harvest treatments—stand clearcut, seed tree harvest, overstory removal cut, commercial thinning, shelterwood establishment cut and patch clearcut—independently as well as combined (considered 'All Treatments'). The six most common treatment types accounted for 68% of the catalog (26 920 of 39 754 total). It is important to note that we filtered this dataset further based on contemporary forest characteristics derived from space-borne LiDAR and Landsat data (described below). The silvicultural treatments considered are described in greater detail in table 1 and their spatial distribution is shown in figure 1. Finally, we determined if a site was planted or unplanted using the FACTS database. Sites that received a 'certification of natural regeneration' in the FACTS database were considered 'unplanted' while sites that were identified as 'planted' were considered 'planted'. Of the total 26 920 sites considered in this analysis, 18 661 (69%) were designated as unplanted or planted.
Table 1. Descriptions of each treatment and summary statistics for each treatment class. All treatment definitions were from (or adapted from) Helms (1998). Average values represent the median ± inter-quartile range.
| Treatment type | Treatment description | Number of sites | Average CWD (mm) | Average elevation (m) | Average area (m2) |
|---|---|---|---|---|---|
| All treatments | All treatments represents the average response of all treatments when combined. | 26 069 | 429 ± 241 | 1440 ± 731 | 73 100 ± 87 500 |
| Stand clearcut | The cutting of essentially all trees, producing a fully exposed microclimate for the development of a new age class. | 13 123 | 380 ± 206 | 1300 ± 759 | 64 300 ± 71 500 |
| Commercial thinning | A cultural treatment made to reduce stand density of trees primarily to improve growth, enhance forest health, or to recover potential mortality. | 3067 | 478 ± 381 | 1520 ± 1270 | 120 000 ± 166000 |
| Overstory removal cut | The cutting of trees constituting an upper canopy layer to release trees or other vegetation in an understory. | 2778 | 551 ± 261 | 1570 ± 579 | 97 800 ± 151000 |
| Seed tree harvest | The cutting of all trees except for a small number of widely dispersed trees retained for seed production and to produce a new age class in a fully exposed microenvironment. | 2741 | 402 ± 146 | 1470 ± 401 | 72 300 ± 76 500 |
| Shelterwood cut | The cutting of most trees, leaving those needed to produce sufficient shade to produce a new age class in a moderated microenvironment. | 2330 | 418 ± 182 | 1530 ± 891 | 99 700 ± 99 200 |
| Patch clearcut | A modification of the clearcutting method where patches (groups) are clearcut in an individual stand boundary leaving trees outside of the patch boundaries. | 2030 | 508 ± 234 | 1590 ± 992 | 40 600 ± 57 200 |
2.3. Forest structure data
We extracted data from the Global Ecosystem Dynamics Investigation (GEDI) tree height dataset (Potapov et al 2020) for each selected treatment polygon to provide information on tree heights in 2019. This dataset provides estimates of tree height at a 30 m resolution by combining space-borne LiDAR with Landsat imagery. Pixel specific forest presence and absence was estimated using a conservative height threshold of 3 m to determine forest distribution in 2019 (Potapov et al 2020). We computed the proportion of each treatment polygon that was classified as forest 29, 28 and 27 years following harvest (for harvests that occurred in 1990, 1991 and 1992, respectively) and the median tree height using Google Earth Engine (GEE; Gorelick et al 2017). We also extracted data describing the percent tree cover in 2016 from the National Land Cover Database (NLCD; Yang et al 2018) and computed the median value for each treatment. We filtered our catalog of harvest treatments for locations with >20% forest in 2019 according to GEDI tree heights (26 069 of 26 920, 97%). This filtering procedure is intended to provide support for the assumption that the results in this research are generally reflective of forest regrowth and regeneration. In total, our final catalog of forest treatments represent 26 069 sites (figure 1, table 1).
2.4. Net primary productivity data
We utilized gridded datasets of annual NPP that were produced for the continental United States at a 30 m grid resolution from 1986 to 2019 (Robinson et al 2018). Modeled NPP is a quantitative metric that approximates general vegetation growth and productivity (i.e. conifers and non-conifers) and enables regional comparisons. NPP (gC m−2 yr−1) was calculated using the Moderate Resolution Imaging Spectroradiometer (MODIS) MOD17 algorithm (Running et al 2004). Gross primary productivity was calculated using the daily fraction of photosynthetically active radiation estimates from Landsat surface reflectance products (Masek et al 2006, Feng et al 2012, Vermote et al 2016), meteorological data from gridMET (Abatzoglou 2013), land cover classifications from the NLCD (Homer et al 2007, 2015, Fry et al 2011), and optimized biome‐specific light use efficiency parameters (Robinson et al 2018). NPP was calculated as the differences between GPP and autotrophic respiration estimates calculated every 8 days and summed over the year (Robinson et al 2018).
2.5. Climate data
The climatic water balance imparts a strong control over the spatial distribution of plant functional types (Stephenson 1998) and is an important driver of ecosystem productivity (Hoylman et al 2019a). We used daily estimates of potential evapotranspiration (PET) and actual evapotranspiration (AET) output from a 8 arcsecond (∼250 m) gridded soil water balance model, evaluated from 1986 to 2015 (TOPOFRIE; Holden et al 2019), to calculate the climatic water deficit (CWD = PET − AET; mm). PET was computed following Penman–Monteith methods (Allen et al 1998) and AET was computed by constraining PET with available soil water; the full description of these methods and input datasets can be found within Holden et al (2019). We then calculated the total annual CWD for each year, which represents the unmet atmospheric demand for moisture, an ecologically relevant metric of accumulated drought stress. This climatic water balance is topographically resolved at a 250 m resolution with respect to elevation effects on precipitation, aspect effects on incident radiation, and shading effects from adjacent terrain (i.e. hydroclimate). The CWD is an advantageous metric from an ecohydrologic perspective when compared to an aridity index (for example annual precipitation (P)—PET or PET/P) because it accounts for temporal asynchrony of energy and water inputs (at a daily time step) which determine plant available water during the growing season. Significantly greater stress to vegetation can occur when P and PET are out of phase during the growing season, when compared to in-phase climatic regimes, despite similar annual measures of PET and P (see Stephenson 1998).
2.6. Statistical analysis
2.6.1. Modeling regrowth rate
In order to compare forest regrowth rates across the western U.S. we normalized the NPP dataset. We computed the pixel specific relative NPP by subtracting the average pretreatment NPP (e.g. NPP between 1986 and 1989, 1986 and 1990 or 1986 and 1991 for harvest year 1990, 1991 and 1992 respectively) from the pixel specific time series of NPP. Relative NPP was computed as:

where Q2 is the second quartile (median) of pretreatment NPP. This normalization centers the pretreatment relative NPP values at 0 (figure 1) and accounts for different harvest years, while maintaining original units (gC m−2 yr−1) for statistical modeling. Next, we extracted the relative NPP time series from 1986 to 2019 and the median CWD value for each site (n = 26 069). This portion of analysis and dataset extraction was conducted in GEE.
We standardized time across the relative NPP timeseries to reflect time since harvest (0 = year of harvest, negative = pre-harvest, positive = post-harvest). Site specific regrowth rates were then computed by fitting a linear model to the post-treatment relative NPP timeseries and extracting the slope of the model (figure 1(d)). Linear models were filtered for significance (p value < 0.05). We then computed the median, 25th and 75th percentiles of slope and the median CWD value for 50 bins of the CWD for each treatment. Bins were computed using 51 breaks determined using quantiles for each treatment specific CWD distribution. Therefore, each median slope, slope percentile and CWD value (scatter points in figure 2) was computed based on the same number of observations within treatments. We then fit a locally estimated scatterplot smoothing moving regression line and the 95th confidence interval to each treatment trend (figure 2) in order to visually assess differences in treatment types across the hydroclimate gradient. This analysis was conducted in the R computing environment (R Core Team 2020).
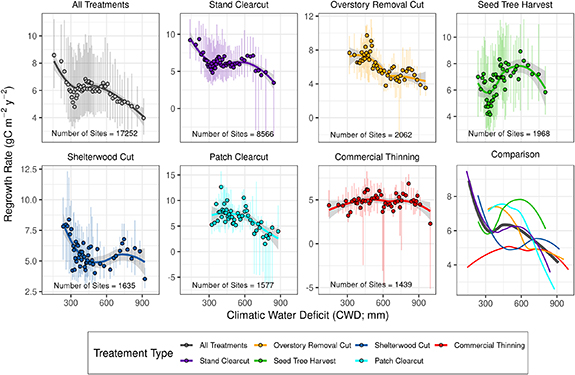
Figure 2. Plots showing the effect of the climatic water deficit (CWD) on rates of forest regrowth for each silvicultural treatment considered (site specific regrowth rates were filtered for significance; p value < 0.05). Scatter points represent the median regrowth rate and bars represent the inter-quartile range for 50 classes of the CWD determined using quantile breaks for each treatment specific CWD distribution. Lines show locally estimated scatterplot smoothing (LOESS) moving regression lines and the gray shading represents the 95th confidence interval for the LOESS regression. A comparison plot (bottom right) shows the LOESS regressions plotted on top of one another.
Download figure:
Standard image High-resolution image2.6.2. Effect of planting
We sought to evaluate the effect of forest planting on rates of forest regrowth and contemporary forest structure. Rates of forest regrowth (as computed using NPP) can account for trees that have been intentionally left on the landscape during harvest (e.g. shelterwood treatments), however any comparisons to forest height or percent forest cover would be biased by trees intentionally left. Therefore, we focused on stand clearcut treatments to assess the effects of planting on forest regrowth and structure to ensure, to the best of our ability, that initial forest conditions following harvest were similar (i.e. unforested). Furthermore, stand clearcut treatments account for 61% of all planted sites in this analysis (n = 11 208), followed by seed tree harvest (12%), indicating that planting was most commonly associated with stand clearcut treatments during the study period.
We estimated the effect of planting using 2019 tree height, 2016 percent tree cover and rates of forest regrowth for the aforementioned 11 208 stand clearcut sites. We present the distribution for each of the three variables as violin plots for the planted and unplanted categories (figure 3 (left), violin width represents the kernel density estimation and the horizontal line represents the median value). Following the same procedure described above, we then computed the median, 25th and 75th percentile value for each of these variables and the median CWD value for 50 bins of the CWD. Bins were computed using 51 breaks determined using quantiles.
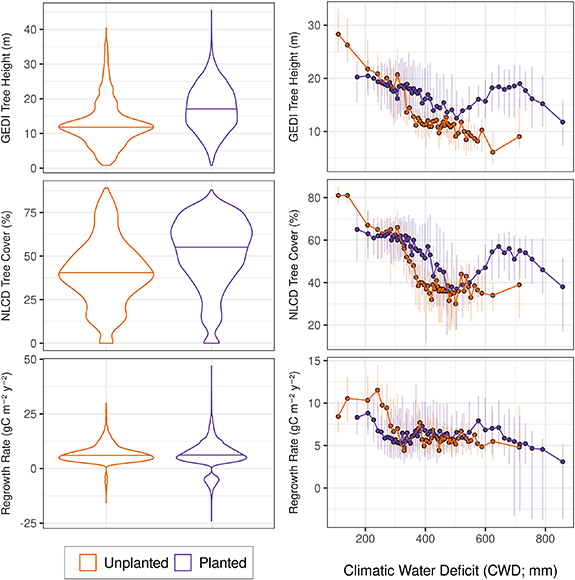
Figure 3. (Left) Violin plots showing the distribution of site-specific median tree heights in 2019, tree cover in 2016 and regrowth rates for planted and unplanted stand clearcut treatments. Significant differences exist for 2019 tree heights and 2016 percent tree cover (Mann–Whitney U test < 0.05), however there was not a statistically significant difference in regrowth rates overall. (Right) The median value of each of these variables and bars representing the inter-quartile range for 50 classes of the climatic water deficit (CWD) for planted and unplanted stand clearcut sites. CWD classes (right) were computed using 51 quantile breaks of the CWD, determined for the planted and unplanted sites independently.
Download figure:
Standard image High-resolution image
To test for significant differences between the planted and unplanted groups, we used two tests. We used the Mann–Whitney U test to compare distributional differences between two independent (planted versus unplanted) groups because the response variables (GEDI tree height, NLCD percent tree cover and the regrowth rate) were not normally distributed. Further, we used Mood's median test to compare the medians for the two samples to assess statistically significant differences between these values.
3. Results
Hydroclimatic gradients had a strong influence on rates of forest regrowth following harvest across the western U.S. (figure 2). There was a general decline in rates of forest regrowth as hydroclimate transitioned from wet (8.59 ± 5.07 gC m−2 yr−2, median CWD = 158 mm) to dry conditions (3.97 ± 2.67 gC m−2 yr−2, median CWD = 912 mm; 'All Treatments'; figure 2), a 116% difference. However there was significant nonlinearity within the span of these trends for the different treatment types. This response to hydroclimate was consistent across treatment types (figure 2), except for seed tree harvest treatments where rates of forest regrowth were maximized in regions with moderate CWD and commercial thinning treatments where regrowth rates were relatively insensitive to hydroclimatic gradients. Shelterwood regrowth rates declined sharply from wet (CWD ∼250 mm) to moderate (CWD ∼500 mm) hydroclimatic conditions and were relatively consistent from 500 mm to 900 mm of CWD. Rates of forest regrowth following clearcut treatments exhibited an insensitivity to hydroclimate in the moderate ranges of the CWD (300 mm > CWD > 600 mm).
Rates of forest regrowth were also strongly related to treatment method (comparison plot, figure 2). In wet hydroclimatic positions we found that stand clearcuts had the fastest rates of regrowth (9.20 ± 5.34 gC m−2 yr−2, median CWD = 140 mm), while commercial thinning had the slowest regrowth rate (4.37 ± 3.04 gC m−2 yr−2,median CWD = 145 mm). In moderate and moderately dry hydroclimatic positions (CWD = 500–750 mm), seed tree harvest had the fastest regrowth rates (green line, figure 2). In dry hydroclimatic positions shelterwood cuts had the fastest rates of regrowth while stand clearcut, patch clearcut and commercial thinning had the slowest rates of regrowth.
Overall, planting caused a significant change in 2019 tree heights and 2016 percent tree cover for stand clearcut treatments (Mann–Whitney U test < 0.05), however there was not a statistically significant change in NPP regrowth rates (violin plots figure 3 (left)). More specifically, planting caused a statistically significant increase in median 2019 tree heights (+5.25 m, Mood's median test χ2 = 781.52, p value < 0.05) and percent tree cover (+15%, Mood's median test χ2 = 567.21, p value < 0.05), however we found no significant change in the median regrowth rate (+0.183 gC m−2 yr−2, Mood's median test χ2 = 3.2157, p value = 0.072). We did observe a strong hydroclimatic control on these effects. Planting had a negative effect on tree height, percent tree cover and regrowth rate in wet hydroclimatic settings with CWD < 300 mm (figure 3 (right)). Planting had a positive effect on tree height, percent tree cover and regrowth rate in hydroclimatic settings with 300 mm < CWD < 500 mm. Finally, we observed a moderate to strong positive effect on tree height, percent tree cover and regrowth rate in moderate dry to dry hydroclimatic conditions (CWD > 500 mm).
4. Discussion
4.1. Water balance effects on rates of forest regrowth
The climatic water balance was a strong driver of forest regrowth rates across the western U.S., particularly in the wet and dry portions of the hydroclimatic gradient. This finding aligns with previous literature showing that wetter landscape positions generally yield greater annual growth rates and accumulated biomass (Weiskittel et al 2011, Swetnam et al 2017, Hoylman et al 2018, 2019a). However, these relationships were highly nonlinear across the western U.S. hydroclimatic gradient (figure 2). While we conducted this analysis across the western U.S. to describe a wide range of regrowth outcomes, it is important to recognize that the CWD is a continuum that varies significantly at the watershed scale (figure 1), strongly influencing local moisture conditions (Dyer 2009, Holden et al 2019). Therefore rates of regrowth vary across watersheds due to local topographic features (largely accounted for in our water balance model, figure 1; see Holden et al 2019) that contribute to variance in microclimates and the climatic water balance (e.g. Hoylman et al 2019b). Our results expand upon previous literature by directly quantifying the relative influence of the climatic water balance on rates of forest regrowth across the large range of hydroclimatic conditions and management strategies that occur across the western U.S. forests (figures 1 and 2).
The CWD provides an integrated metric of water and energy available for plant growth. Our approach combines the effects of regional scale climatic patterns of water and energy (e.g. coastal vs continental interior environments) that are subsequently mediated by local topography. Local variations in aspect, elevation and slope angle impact solar radiation, evapotranspiration and air temperature and interact with the available soil moisture derived from precipitation to determine latent and sensible heat partitioning. Therefore, this dynamic index represents the spatial mosaic of drought stress on plants across complex terrain and has been recognized by many studies as an effective control on vegetation distributions and productivity (Stephenson 1998, Crimmins et al 2011, Hoylman et al 2018). These findings along with our results suggest that a water balance approach captured by CWD can improve managers' assessment of silvicultural options, constrain subsequent expectations and simplify the identification of units that are likely to be the most productive following harvest. In contrast to traditional site productivity indicators (e.g. climate, topography, soils, site index; Skovsgaard and Vanclay 2008), this dynamic approach also enables analysis and prediction of the velocity/rate that suitable habitat may change over space and time (Dobrowski et al 2013) when combined with downscaled climate projections. It is important to note that our measure of the CWD does not account for lateral flows of moisture along topographic gradients; it is likely that accumulation of upslope moisture in locations of topographic convergence (Jencso et al 2009) will mediate climatic effects on forest growth downslope (e.g. Hoylman et al 2018, 2019b).
4.2. Treatment effects on rates of forest regrowth
Silvicultural treatment had a strong influence on rates of forest regrowth (figure 2, comparison plot). Relationships between regrowth rate and the CWD were nonlinear within treatment classes. In many cases the relative influence of treatment type on regrowth rates within a hydroclimate class was comparable to the influence of hydroclimate within a treatment type. For example regrowth rates were 9.20 ± 5.34, 7.00 ± 5.01 and 4.37 ± 3.04 gC m−2 yr−2 for stand clearcut, seed tree harvest and commercial thinning respectively within the wettest hydroclimate conditions considered, whereas stand clearcut regrowth rates ranged from 9.20 ± 5.34 to 3.46 ± 9.00 gC m−2 yr−2 across wet to dry hydroclimatic zones respectively. These results suggest that silvicultural strategy in conjunction with local moisture conditions are both key determinants of rates of forest regrowth (Nyland 2016). This confirms that management decisions are as important for determining the trajectory of forest productivity post-treatment as decisions on where harvest will occur (e.g. across spatial hydroclimatic gradients). Our study explicitly quantifies these interactions and provides important context about which treatment types promote the most rapid rates of regrowth across the continuum of climatic regions in the western U.S. (figure 2). This information, in turn, can be used by U.S. forest managers to assist in making critical decisions about treatment selection and placement within proposed project boundaries by constraining forecasted outcomes. To our knowledge this is the first study to quantitatively link thousands of harvests within the FACTS database to climate and productivity, especially as it pertains to forest regrowth dynamics. However, the nonlinear response of regrowth rate to hydroclimate indicates a complex ecosystem response to moisture availability that is likely influenced by additional factors not considered in this study and undetectable by remote sensing approaches.
Silvicultural treatments that balance the magnitude of timber extraction with expected rates of regrowth can be used to minimize long term changes to the carbon balance in complex mountain terrain. For example in wet regions, intensive stand clearcut treatments were coincident with very rapid rates of regrowth, maximizing harvest potential while minimizing long term reductions in carbon sinks. This reflects the well documented gradient in site productivity as a function of climate (Churkina and Running 1998, Weiskittel et al 2011); wet sites can inherently support greater biomass production. Alternatively, the same treatment in dry climatic regions produced regrowth rates that were among the slowest observed, only 38% the rate observed in the wet climatic class, resulting in long standing reductions in local carbon sinks. However, managing forests to balance carbon fluxes focuses on only one component of a multitude of important ecosystem and commercial services. For example, dry sites might be selected for clearcut because they produce the best biomass (i.e. height and growth) for shade intolerant species (e.g. McDonald 1976). Further, intensive harvesting can have a deleterious impact on wildlife habitat where the effects of clearing cannot be mediated by the abundance of nearby intact forested habitat (King et al 1996, Potvin et al 1999). Our results highlight the strong climatic control on rates of forest regrowth across the western U.S. following clearcutting treatments, and this aligns with the results of smaller scale studies. For example, sites with greater annual precipitation and on northerly aspects generally had faster rates of regeneration in two experimental sites located in Oregon (Schroeder et al 2007). Our results expand on this finding by spanning the climatic extremes of the western U.S., explicitly accounting for the climatic water balance and by spanning various silvicultural methods. Further, our results are applicable both at the regional and hillslope scale, as the CWD strongly varies across complex terrain (figure 1).
Shelterwood cut treatments yielded the most rapid rates of regrowth in the driest portion of our study domain (figure 2). This result underscores the importance of maintaining forest canopy structure during harvest in areas with high moisture deficits if management is focused on forest regrowth and regeneration. Shelterwood treatments have been shown to promote microclimatic conditions, characterized by lesser net-radiation, higher humidity, cooler maximum and warmer minimum air temperatures, cooler soil temperatures and reduced occurrence and severity of night frost when compared to clearcut conditions (Childs and Flint 1987, Holbo and Childs 1987, Valigura and Messina 1994, Man and Lieffers 1999). Further, shelterwoods have been directly associated with increased plant water availability, ameliorating the effects of water stress on conifer seedlings (Dalton and Messina 1995). This biologically important mediation in the near surface microclimate promotes establishment and increased survival probability of conifer seedlings within shelterwood environments (Dunlap and Helms 1983, Childs and Flint 1987, Dalton and Messina 1995). Our perspective is focused on forest regrowth and recovery of productivity, although alternative management consideration must be weighed to promote desired outcomes. For example, shelterwood treatments may not promote the establishment of desired species in dry climates due to their associated low-light conditions. Despite this, our results provide further evidence that shelterwood cuts are a biologically effective treatment in dry climates and may become an increasingly important technique to counteract increasing moisture deficits in the context of climate change.
Seed tree harvests had the fastest rates of regrowth in the moderate and moderate dry climatic classes (figure 2). This important finding suggests that natural seed generation, establishment and regrowth processes are an effective management technique in ecosystems that experience moderate to semi-arid climatic conditions. This technique is considered an inexpensive and easy method to promote forest health, maintain desirable species and control certain diseases such as dwarf-mistletoe or outbreaks of defoliating insects such as spruce budworms (Gray 1990, Miller and Murphy 1990). Further, this method has been identified as a favorable silvicultural practice for stands with Douglas-ir (Pseudotsuga menziesii), ponderosa pine (Pinus ponderosa) and lodgepole pine (Pinus contorta; Gray 1990, Miller and Murphy 1990), common species in this climatic range and geographical province. Our results confirm that seed-tree silvicultural techniques can be an appropriate alternative in conifer dominated forests to promote rapid forest regrowth.
The strong influence of hydroclimate on rates of regrowth was not apparent in commercial thinning treatments; regrowth was relatively constant across the western U.S. This insensitivity suggests thinning may be a viable management option across a wide range of hydroclimatic sinereos, both spatially and as the climate continues to change. Thinning has been shown to promote drought resilience and resistance (D'Amato et al 2013), which may help explain the insensitivity observed in dry hydroclimatic conditions and provide additional benefits to employing this management option. However, this perspective is based on the datasets and methods employed here, and as such, thinning may not be viable in all locations due to considerations not explored in this analysis (see limitations section below).
4.3. Planting effects on forest regrowth and structure
Forest planting had an overall significant and positive effect on forest height and percent forest cover 25–30 years following stand clearcut treatments (figure 3 (left)). Our results indicate forests were on average 5.25 m taller with 15% greater forest cover when planting occurred. However, we did not observe any significant effects of planting on rates of forest regrowth as estimated using NPP trend analysis. This result could suggest that planting does not strongly control overall ecosystem carbon balance dynamics; planting might not inherently enhance ecosystem productivity. Alternatively, the remotely sensed regrowth rates reported here may not fully capture productivity gradients associated with the diverse vertical characteristics of forests. Past research synthesizing 'active' versus 'passive' restoration effects on forest recovery have concluded that active restoration practices, including tree planting, can have mixed results on forest recovery (Meli et al 2017). Our NPP regrowth rate results agree with this conclusion, however this interpretation is dependent on the metric of recovery used.
Interestingly, measures of forest height, percent forest cover and rates of forest regrowth all indicate that planting was not beneficial in wet hydroclimatic conditions (300 mm > CWD). Prior research in energy limited, tropical ecosystems has produced similar results (Crouzeilles et al 2017), where natural regeneration promoted taller forests with greater canopy cover and greater total biomass when compared to actively restored forests. Our results are informed by multiple lines of inference that agree that natural regeneration may be most appropriate in the wet hydroclimate regions of the western U.S. However, future work is needed to identify the physical processes and management strategies that contribute to this effect in wet hydroclimate regions. In moderately dry to dry hydroclimatic conditions (CWD > 550 mm) planting had a strong and positive effect on tree height and percent forest cover, and caused a modest increase in regrowth rate. These results indicate that active reforestation practices can benefit forest recovery and should be considered in these hydroclimatic locations. Perhaps most importantly, our results emphasize that planting has a complex and differential effect on forest regrowth and structure and may not be constantly beneficial if applied uniformly across landscapes with large moisture gradients.
4.4. Limitations and implications
We assumed the NPP trends reported in this study are representative of forest regrowth (i.e. trees) post-harvest. We supported this assumption by only considering sites with >20% forest cover in 2019 as indicated by GEDI tree height estimates. To further evaluate this assumption we computed the average percent tree cover in 2016 using NLCD for all treatments considered (47 ± 28%; median ± inter-quartile range). The treatment with the lowest average percent tree cover was overstory removal cuts (40 ± 21%). However, remote sensing based estimates of NPP can be sensitive to reflectance from understory vegetation and may miss portions of the subcanopy reflectance, potentially producing error and integrating portions of non-forest NPP into the estimate. It is possible that a component of the NPP regrowth reported here may be due to understory vegetation. The algorithm which was used to estimate NPP also has known potential sources of error associated with accurate biophysical inputs (such as landcover classification), meteorology and radiometry (Heinsch et al 2006). Further, we did not consider species-specific responses in this study or differences in harvest patch sizes and topology, which represents an opportunity for future research and improvement of our results. There are also limitations associated with the FACTS database. For example, the Forest Service relies on administrative units to self-report their vegetation management activities, therefore records may not be comprehensive and interpretations of treatments employed can vary. Delineations of FACTS boundaries may also have errors due to differences in planned versus executed activity. Finally, our results reflect the recovery of NPP and forest structure characteristics following silvicultural treatments completed in the early 1990s. Newer, more sophisticated silvicultural treatments are not considered in our study. For example, many contemporary management techniques utilize more complex methods to retain fine-scale mosaic patterns in forests. Such treatments focus on maintaining structural and functional complexity of forests to enhance adaptive capacity (Fahey et al 2018). One example of a resilience-focused silvicultural technique includes the individuals, clumps and openings method (Churchill et al 2013) which is an operational framework that uses knowledge of historical within-stand forest structure to prescribe and develop forest complexity. It is also important to acknowledge that recent advancements in genetic modification of seedlings may also affect the efficacy of regeneration dynamics (Neale and Kremer 2011).
This study provides a regional context to estimate rates of forest regrowth post-harvest. Importantly, these results can be used at the landscape scale where decisions are made to balance expected rates of regrowth with alternative needs of practitioners. Simple maps of the CWD in conjunction with our results can help managers anticipate which silvicultural method(s) may result in rapid recovery of NPP within a climatic region of interest. The CWD in conjunction with other biophysical datasets and expert on-the-ground knowledge could be used to improve silvicultural prescriptions and account for landscape scale changes to the carbon balance. Our climatic water balance approach can account for constantly changing climatic conditions (including changing precipitation distributions and increasing air temperature) due to climate change, making the framework applicable to future conditions. This represents a significant advantage of using a dynamic climatic water balance over more conventional static indices and proxies of hydroclimate (e.g. elevation and aspect). However, it will be critical to evaluate if thresholds in climate-ecosystem-dynamics have been surpassed within the region of interest, which may alter our conclusions based upon historic dynamics as species and ecosystem state shifts occur (Maslin 2004).
5. Conclusion
Our new approach allowed us to compare forest regrowth dynamics across silvicultural treatments and hydroclimatic gradients to identify management strategies across the western U.S. that promote rapid rates of regrowth. Our results indicate that rates of forest regrowth following harvest were strongly affected by hydroclimate and silvicultural treatment type. Variability in the climatic water balance was important for determining rates of regrowth within a silvicultural treatment class. Regrowth rates were on average 116% faster in wet versus dry hydroclimates (8.59 ± 5.07 gC m−2 yr−2 versus 3.97 ± 2.67 gC m−2 yr−2 in wet and dry regions respectively), when considering all silvicultural treatments together. However, different silvicultural treatments within similar hydroclimatic conditions also produced large differences in regrowth rates. Planting had a differential effect on forest structure and rates of regrowth across hydroclimate with negative effects in wet environments and positive effects in dry environments. Thus, management decisions on both where and how silvicultural treatments occur are vital to promote vigor in the western forests of the future. This study provides managers with an additional framework to identify silvicultural treatments likely to result in more rapid forest regrowth across complex terrain of the west.
Acknowledgments
This work was supported by the USDA National Institute of Food and Agriculture, McIntire-Stennis project 1021605 and NSF Grant DEB‐1457749 awarded to Jencso. The authors also thank NSF EPSCoR Track‐1 EPS‐1101342 (INSTEP 3) for support. The authors would also like to thank Dr Justin Crotteau for comments which improved this manuscript.
Data availability statement
The data that support the findings of this study are available upon reasonable request from the authors.