

Abstract
The direct impacts of climate change on crop yields and human health are individually well-studied, but the interaction between the two have received little attention. Here we analyze the consequences of global warming for agricultural workers and the crops they cultivate using a global economic model (GTAP) with explicit treatment of the physiological impacts of heat stress on humans' ability to work. Based on two metrics of heat stress and two labor functions, combined with a meta-analysis of crop yields, we provide an analysis of climate, impacts both on agricultural labor force, as well as on staple crop yields, thereby accounting for the interacting effect of climate change on both land and labor. Here we analyze the two sets of impacts on staple crops, while also expanding the labor impacts to highlight the potential importance on non-staple crops. We find, worldwide, labor and yield impacts within staple grains are equally important at +3 ∘C warming, relative to the 1986–2005 baseline. Furthermore, the widely overlooked labor impacts are dominant in two of the most vulnerable regions: sub-Saharan Africa and Southeast Asia. In those regions, heat stress with 3 ∘C global warming could reduce labor capacity in agriculture by 30%–50%, increasing food prices and requiring much higher levels of employment in the farm sector. The global welfare loss at this level of warming could reach $136 billion, with crop prices rising by 5%, relative to baseline.
Export citation and abstract BibTeX RIS
1. Introduction
The effects of climate change on economic and social outcomes are increasingly well understood and quantified [1, 2]. In poor countries, a 1 ∘C rise in temperature has been estimated to reduce economic growth by 1.3 p.p. [2]. Climate impacts in the agricultural sector have been studied particularly closely because of its sensitivity to weather. The interaction of climate change effects on temperature, precipitation and CO2 concentration are the most relevant and determine new levels of agriculture productivity and adaptation at global scale [3]. Many studies show different effects for staple crops—corn, soy, rice, and wheat—depending on the geographical location and atmospheric CO2 concentrations, e.g. in Latin America yields decline are projected for wheat, soy, and corn [4, 5]. At the same time, the agricultural sector is critical for low-income livelihoods and global food security [6]. This work has, however, focused almost exclusively on the direct effects of climate change on crop productivity, i.e. yields [6–8].
Far less attention has been paid to the human labor necessary to realize these yields. Yet it is well known the effects of climate change on human health as a social outcome [1, 2]. Labor supply and productivity are sensitive to increasing heat stress expected under climate change [9–11], particularly in sectors heavily reliant on outdoor work [12], such as agriculture [13]. Heat exposure reduces the capability for physical activity in across a wide range of working places [11]. The environmental heat exposure level determines how many hours workers are capable to develop their activities. A restricted labor capacity will result in lower wages and output in economic activities, especially agriculture [14]. This relationship is explored by Szewczyk et al 2019 [15] resulting a declined gross domestic production in most vulnerable regions of the World, such as sub-Saharan Africa, China and India [15]. Nevertheless, the relationship we are proposing here has not been addressed, i.e. the effects of climate change in both, agricultural and labor productivities, and their interactions. As far we know, this is the first effort to assess these impacts together at global scale. In addition, the movement of labor across sectors has been shown to be responsive to climate impacts [16]. To develop a more accurate climate impacts assessment accounting for interactions and spillovers between regions [17] we explore the interaction between climate change-induced labor productivity impacts, agricultural yields, and global economic systems.
The physiological basis for assessing heat stress and its consequences for human activity is well understood [12, 18]. Heat stress metrics for a variety of different applications have been used to evaluate heat waves, climate states, and climate change [19–23]. Some studies have assessed projected heat stress damages from temperature alone [24], but heat stress is demonstrated to be strongly modulated by humidity [20, 25–27], and radiation as well, so the well-accepted international standard for heat stress ISO 7243, wet bulb globe temperature (WBGT) includes all three parameters [12, 28, 29]. Prior efforts projecting future heat stress have used highly simplified estimates of WBGT that omit changes in radiation load in the calculation [30–36]. We assess the sensitivity of changes in labor productivity in the future to different formulations of heat stress, including explicit calculation of solar radiation, and to different functional relationships between labor and heat stress.
In this paper, drawing on two diverse sets of literature, we provide an analysis of the consequences of global warming, both on agricultural labor force (People) as well as on crop productivity (Plants), thereby accounting for the interacting effect of climate change on both land and labor. We integrate these estimates of direct impacts into the Global Trade Analysis Project (GTAP) model—a comparative static, general equilibrium model of global trade, production and consumption—in order to assess their relative magnitude and to better understand the economic importance the impacts of global warming on labor productivity. We find that the heat stress impacts on human labor are comparable in magnitude to the far more commonly discussed impact on plants, and they dominate the combined losses in some of the most vulnerable parts of the world—most notably sub-Saharan Africa.
2. Methods
2.1. Experimental design
The economic impacts of temperature changes on cropping activity are projected under four experiments at Global level (figure S16). The first experiment, 'People', considers losses in agricultural labor capacity in the presence of climate change as calculated from the ISO standard heat metric, WBGT. WBGT incorporates both dry (dry bulb temperature) and moist (wet bulb temperature) components of heat stress as well as radiative loading as measured by a globe thermometer. For this experiment, we are considering only staple crops (wheat, rice, maize and soybean). We use two alternate approximations to WBGT, combined with two estimates of the labor response to changes in WBGT that have been used in previous studies (details in the section 2.2 below).
The second experiment, 'Plants', considers the impact of global warming on yields of the four most widely-grown crops (wheat, rice, maize and soybean) based on a meta-analysis of 1010 point-estimates from 56 studies compiled for the IPCC 5th Assessment Report [37]. Estimated yield changes by region include the effects of both warming and CO2 fertilization, some agronomic adaptations, and account for regional variation in warming at different levels of global average temperature change (details in the section 2.3 below and in Moore et al 2017).
Since the vast majority of agronomic studies of climate effects on crop yields concentrate on these four staple crops, rather than attempting to synthesize the very limited estimates of yield impacts for the rest of the agricultural sector, we compare the magnitude of land and labor productivity impacts using the 'People' run. This experiment can be directly compared with the 'Plants' experiment since only staple crop productivities are perturbed in both. We also conduct a ' Combined' experiment in which both the People and the Plants impacts are simultaneously implemented—for staple crops only. Finally, to highlight the potential importance of the impacts on non-staple crops we add a fourth experiment: 'People-AllCrops' wherein labor productivity is perturbed for all crops. The yield and labor productivity changes at different levels of warming (global mean temperatures 1 ∘C through 5 ∘C warmer than today, denoted +1, +3, etc) are introduced into the GTAP global economic model as perturbations to regional agricultural technologies (details in the section 2.4 below).
We aggregate the GTAP database to 16 regions and 14 commodities designed to place emphasis on the agricultural sector, and 5 factors of production: capital, labor—both skilled and unskilled, land, and natural resources. Welfare results account for both the (direct) economic impacts of the productivity changes themselves, as well as the (indirect) impacts of the induced changes in prices, production, consumption and trade as a consequence of agricultural producers' adjustments to the new environment. This includes hiring additional workers as well as introducing labor-saving mechanization.
2.2. Heat stress calculations
Globe thermometer temperatures are not widely observed or predicted within modeling studies, so in most studies WBGT is normally approximated. Two such approximations to WBGT are the simplified wet bulb globe temperature, sWBGT [38] and the environmental stress index, ESI [39]. sWBGT is a function of the vapor pressure which depends on relative humidity as well as temperature (∘C). Relative humidity is calculated from instaneous model output of specific humidity and temperature (see supplemental materials (available online at stacks.iop.org/ERL/16/044020/mmedia)). Importantly, the sWBGT algorithm discards any explicit information about observed radiative loading, although it is calibrated to WBGT assuming moderate Sun and a light wind. Thus sWBGT overestimates heat load at night, morning, or evening, or under cloud cover, and underestimates it in full Sun [38]. This bias has sometimes been accounted for by assuming shaded conditions and then adding a constant, ad hoc correction factor [40].
In contrast to the sWBGT metric, ESI explicitly incorporates shortwave radiation (W m−2) [41]. ESI is calculated following methods from [39]. sWBGT and ESI are often linearly correlated in experimental and observational studies [42], but ESI is expected to more accurately reflect heat stress over a wider range of atmospheric conditions and over the diurnal cycle without ad hoc corrections. In this study we use both methods: sWBGT for continuity with prior work and ESI because it more accurately captures radiative heat load, such as that induced by clouds or time-of-day. More sophisticated calculations for WBGT are available [43] and these WBGT approximations have their own weaknesses [44]. Nevertheless, our work balances improving realism in capturing radiative load in the heat stress calculation, against the availability of appropriate CMIP5 [45] data.
As described above, while it is well established that WBGT is a good metric for predicting safe labor productivity for workers, specific formulations used to calculate labor rates from WBGT differ substantially [30, 35, 46, 47]. Our approach is to use two different relationships so that sensitivity to formulation can be explicitly explored. First, we employ the National Institute for Occupational Safety and Health (NIOSH) labor standards for agricultural workers (400 W) [29, 48], and an associated function for labor capacity, equation (3) of [49]. This formulation treats workers operating on an hourly schedule and is well tested within the context of modern agricultural labor studies, but, as pointed out in empirical studies, workers today often work beyond the NIOSH guidelines [50, 51]. Studies like this have been used to support a less restrictive formulation, for example the 'Hothaps' function of [40, 49] (their equation (4)). But, this approach is not well posed to deal with heat stress calculated using longer time intervals (6-hourly or daily) output by climate models, because it ignores heat storage and the accumulation of heat strain. It assumes that workers' labor capacity asymptotes to 10% (i.e. 6 min per h) regardless of conditions, prior heat storage, or of the feasibility of being onsite not laboring for 54 min out of every hour all day, under high heat conditions. This is not the behavior observed in actual agricultural labor studies, rather workers today under these conditions stop by 10 or 11am even when their livelihoods depend on it [50, 51]. Consequently, we have opted to use the more widely accepted NIOSH standard the basis for one set of calculations.
Given the challenge of adapting hourly approaches often used in modern labor and workplace studies to a very different climate setting, we employ a second approach, the Dunne et al algorithm, which is a designed to work with spatially and temporally coarse resolution climate model output [30]. Because it is designed to work with coarse (8 h) time increments, it implicitly incorporates heat accumulation and thus heat strain, which is not accounted for by the NIOSH approach. The combination of sWBGT and NIOSH (sWBGT-NIOSH hereafter) is typical of the empirical labor capacity studies and provides projections that are more directly comparable to international labor standards and future projections based on them [12, 47, 48]. In contrast, the combination of ESI and Dunne et al [30] (ESI-Dunne hereafter) utilizes information provided by climate models for shortwave radiative loading which should improve actual estimates of heat load and utilizes a labor reduction metric more tailored for longer time increments and larger spatial scales consistent with calculations from climate models. In the absence of perfect knowledge as to which formulation is better, we bound the potential uncertainty by using both the NIOSH and Dunne functions to explore the robustness of our findings to these differences. By using two possible labor response functions, combined with two climate signals: ESI and sWBGT, we demonstrate the effects of structural uncertainty in the response of labor to heat load.
We calculate the heat stress values from 4× daily values of temperature, humidity, pressure (sWBGT), as well as solar radiation (ESI) from 18 CMIP5 models using three time slices: 1986–2005 baseline (Late 20th Century), 2026–2045 (Mid 21st Century), and 2081–2100 (Late 21st Century). Using 4× daily values avoids assuming agricultural laborers only work during the day and allows for the possibility of shifting of work hours into the early morning and evening, an effect already well-documented as an adaptation to extreme heat [9, 14, 50–53]. For every simulation we calculate the change in ESI and sWBGT between the baseline and Late 21st Century and normalize by the global mean surface (ambient) temperature change to establish—for each model—the scaled pattern of change per degree of global warming, a well validated approach [54, 55]. This scaling is derived from the RCP8.5 scenario due to the strong radiative forcing [45], which produces the large climate changes critical for identifying patterns for scaling techniques. Pattern scaling is widely used with temperature for removing the time component from climate simulations to present changes in terms of global mean surface temperature change [37], and additionally captures mean and extreme covariance of temperature and humidity [56]. This pattern scaling technique [57] normalizes comparisons between CMIP5 simulations by removing the effect of different transient climate response of the different models.
2.3. Meta-analysis of yield response to climate change
The yield shocks used in this paper are derived from a database of studies estimating the climate change impact on yield compiled for the IPCC 5th Assessment Report [7, 8]. Previous work has described a meta-analysis of this dataset used to construct regionally-specific, non-linear temperature and CO2 response functions for maize, rice, wheat and soy [37]. The majority of these observations (85%) are from process-based agronomic crop models. A previous systematic comparison found no evidence of a difference between the yield-temperature response obtained from process-based as opposed to empirical crop models [4] and other work has found general agreement in the yield-temperature response estimated from multiple methods [58–60].
Gridded estimates of yield changes for these crops, based on this meta-analysis, are produced by combining the response functions with local temperature changes at different levels of global average warming, relative to the 1986–2005 baseline, based on the CMIP5 mean under RCP8.5 [37, 45, 61].
CO2 concentration at each level of warming is based on fit between temperature change and CO2 concentration observed in the CMIP5 ensemble mean under RCP8.5 [37]. At +3 ∘C warming this gives a CO2 concentration of 728 ppm, substantially higher than CO2 concentrations at an equilibrium temperature of +3 degrees. Yield changes from warming were combined with CO2 fertilization estimates for C3 and C4 crops described in [37] to give net yield changes for each grid cell at each level of warming. Uncertainty in the yield response to warming and CO2 increase based on statistical error in the response functions estimated from the meta analysis were propagated through to the GTAP runs to give error bars shown in figure 5. This analysis keeps growing season precipitation fixed at baseline levels. The original meta-analysis identified a small positive effect of higher growing-season precipitation that was marginally statistically-significant [37]. However, GCM projections of average growing-season rainfall are highly uncertain and since the estimated impact is empirically small compared to temperature and CO2 effects, we omit it for the purposes of this study.
Yield shocks by crop are aggregated up to the region-level based on crop growing areas. The yield-temperature response functions that we employ also account for some agronomic adaptations, most prominently shifts in planting date and adoption of longer growing-season varieties, as documented in Moore et al (2017), which found the adaptive potential of these well-studied adjustments appears to be generally small. However, we are not able to account for other induced technical change in crop production or how that changing technology will affect factors of production in agriculture. Here we use annual average temperature change from the CMIP5 ensemble, but show in SI figure S29 that yield shocks, once aggregated to the regional level, are almost identical to those restricting temperature changes to the crop growing seasons.
2.4. GTAP modeling framework
The standard version of the GTAP model is used in this paper [62]. We employ a closure which imposes equilibrium in all the markets, firms earn zero profits, the individual countries are on their budget constraints, subject to observed borrowing and lending, and global investment equals global savings. Global trade equilibrium conditions determine the world prices for each commodity. In this study, the Global model is run with 16 regions and 14 commodities based on GTAP database v9.2 [63] (details in SI tables S2 and S3). The commodity aggregation is designed to place an emphasis on the agricultural sector. The yield and labor changes are implemented in GTAP as technology shocks in the context of the current world economy. Yield shocks are Hicks-neutral, such that farmers employing the same combination of inputs would experience α% lower output in the presence of an α% climate-driven yield shock. This significantly magnifies the climate impacts, compared to the frequently employed assumption by which yield losses (or gains) are assumed to only affect the productivity of land [13, 64]. The labor shocks are implemented as biased technical change in which case an α% reduction in labor capacity requires an α% increase in number of workers required in order to fully offset the climate impacts absent economic adjustments to the shock. While aggregate employment in the economy is fixed, the equilibrium changes in sectoral employment depend on changes in output level and labor intensity which, in turn, depends on the the relative prices of inputs. As labor costs rise, farms seek to substitute capital for labor based on historically estimated substitution parameters (www.gtap.agecon.purdue.edu/resources/res_display.asp?RecordID=5736).
3. Results
3.1. Labor losses and agriculture employment
Figure 1 reports labor capacities in our baseline period and the scaled response of the 18 CMIP models for 3 ∘C global mean temperature change as measured by two metrics of heat stress impact on labor capacity: ESI-Dunne and sWBGT-NIOSH. Patterns of change are very similar with both approaches predicting intensification of labor loss in regions with climatologically high temperatures and humidity, namely the tropics and monsoonal regions. The combination sWBGT-NIOSH gives systematically higher labor reductions. In both metrics labor capacity in some regions in the deep tropics is reduced substantially, by 30%–50%.

Figure 1. Sensitivity of Integrated Total Labor Capacity to two heat stress metrics (ESI and sWBGT) and two labor algorithms (Dunne and NIOSH) for 20th Century and +3 ∘C of warming. (A) 20th Century ESI Dunne; (B) ESI Dunne; (C) 20th Century sWBGT NIOSH; (D) sWBGT NIOSH. To the right and left of maps are the zonal means (red lines) and global average (straight red lines).
Download figure:
Standard image High-resolution imageBecause of this heat stress, laborers are only able to work for a fraction of the hours they currently work, leading to diminished agricultural output in much of the tropics. To offset what would otherwise lead to a radical decline in food output and rise in prices, agricultural sector employment expands substantially, drawing workers away from the non-farm economy. Under the +3 ∘C scenario, when imposed upon the current world economy, we project an increase of 69 million unskilled farm workers using the sWBGT-NIOSH impacts (38 million for ESI-Dunne) which represents up to 14% of current agricultural employment (smallholder farms and low skilled labor). More than 97% of the global increase in agricultural workers arises in just four regions—South Asia (30% of the total), Southeast Asia (33%), sub-Saharan Africa (28%), and China (7%) (figure 2). These are also the regions where agriculture is currently most reliant on the unskilled workforce. In regions where agriculture is less reliant on unskilled agricultural workers, such as the United States, Canada, and Europe the increase contributes less than 1% of the total. North Africa and the Middle East, where low humidity allows people to work outdoors at higher temperatures, provided they have adequate hydration, contribute just 0.7% to the global rise in unskilled farm workers.
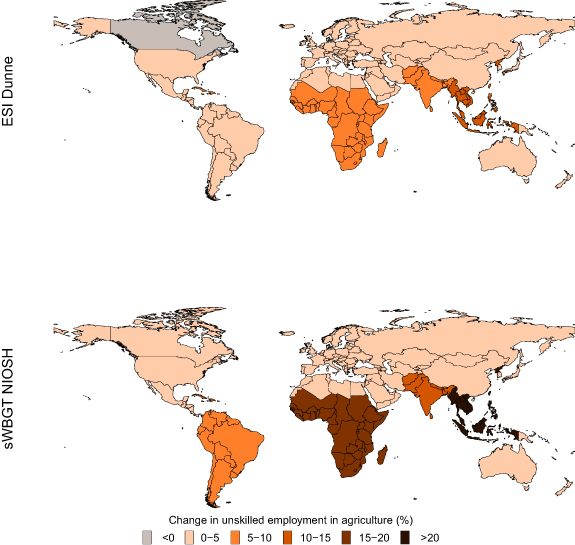
Figure 2. Change of unskilled employment in agriculture at +3 ∘C, People-AllCrops experiment under different measures of heat stress. The values are percentage change in the number of agriculture workers (unskilled) relative to the 2011 regional baseline for all GTAP crops.
Download figure:
Standard image High-resolution image3.2. Global effects: output and prices
Despite employment adjustments in the agricultural sector, diminished labor productivity still results in lower agricultural output and higher food prices. Figures 3 reports the reduction in global crop output, as well as the ensuing indirect impacts on processed foods and livestock products when agricultural workers in all cropping activities are affected by heat stress. Even though these results ignore the direct impacts of climate change on crop yields, the labor productivity shocks generate very significant crop price increases—reaching more than 9% at +5 ∘C warming. Despite the fact that we do not model the direct impacts of climate change on the livestock and processed foods sectors, the indirect effects of higher crop prices work their way through the food supply chain and result in price rises for livestock products and processed foods. Of course, incorporating the direct impacts of climate change on workers and animals in the livestock industry would greatly increase these impacts.

Figure 3. Global output and price for Crops, Processed Food, and Livestock Products under People-AllCrops experiment (sWBGT NIOSH) where the error bars represent a range from minimum to the upper decile of modeled results.
Download figure:
Standard image High-resolution image3.3. Real earnings from agriculture
The impact of diminished labor capacity due to heat stress on the real incomes of workers in the agricultural sector depends on how they adapt to the new work environment. In some regions, there may be scope for adjusting working hours to avoid the hottest parts of the day [14]. However, in much of the tropics, such adjustment has already taken place [53] and there is little scope for extending the agricultural working day without having to work in the dark [14, 65]. The situation is exacerbated by the fact these hot, stressful environments are long-lasting, persisting into the night. The opportunity for accumulating heat strain is much greater in these future climate states. Another important adaptation margin involves diversifying activities to engage in more protected work during the peak hours of the day, or at night [66]. In this way, agricultural workers could maintain their total hours of work in the face of a harsher climate. In figure 4 we report the impacts on agricultural workers' effective average daily real earnings (wages deflated by the cost of living) when they are unable to make such adjustments. In this case, while economy-wide hourly wages rise due to the increased labor demand in agriculture, this is more than offset by the rise in food prices and farm workers' diminished working hours. This decline in effective real unskilled agricultural earnings (real wages adjusted for working hours) exceeds 20% in the Southeast Asia and sub-Saharan Africa regions. One potential labor market outcome in some regions—particularly where farming is more commercialized—is that unskilled farm workers will be able to demand compensation for the hours they cannot work in the field due to heat stress. We explore the implications of this 'wage premium' scenario in the SM (figures S27 and S28). It results in even greater increases in the cost of production and food prices.
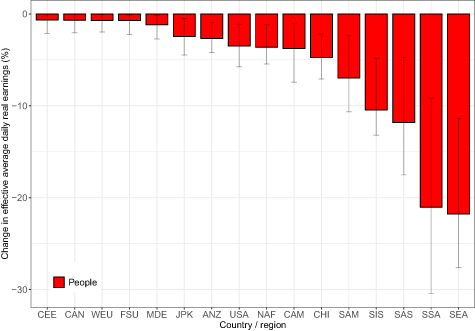
Figure 4. Change in average, daily agricultural real incomes at +3 ∘C under the People-AllCrops experiment (sWBGT NIOSH) for the median case. The error bars represent a range from minimum to the upper decile of modeled results. CEE: Central and Eastern Europe; CAN: Canada and Rest of North America; WEU: Western Europe; FSU: Former Soviet Union; MDE: Middle East; JPK: Japan and South Korea; ANZ: Australia and New Zealand; USA: United States; NAF: North Africa; CAM: Central America; CHI: China plus (China, Hong Kong, North Korea, Macau, Mongolia); SAM: South America; SIS: Small Island States; SAS: South Asia; SSA: sub-Saharan Africa; SEA: Southeast Asia.
Download figure:
Standard image High-resolution image
Figure 5. Impacts of temperature change on global welfare ($B) and welfare change (%) for selected regions. The data points connected by solid lines are the welfare response curves. Yield changes (Plants) are based on our meta-analysis, where error bars represent the 80% confidence interval of the climate-altered yield distribution arising from uncertainty in the crop response to temperature and CO2. The labor capacity shocks (People) are the losses in labor capacity owing to climate change relative to a 1986–2005 baseline using an ensemble of 18 CMIP5 models, where the error bars represent an range from minimum to the upper decile of modeled results. The Combined scenario uses both Plants and People shocks. Note: we omit the error bars for Plants at 4 ∘C and 5 ∘C for better visualization. The same figure with all error bars is available in SM.
Download figure:
Standard image High-resolution image3.4. Plants vs people
To put the consequences of these changes in labor productivity in the context of the far more widely-studied and well understood changes in crop productivity, we turn now to a comparison of the People and Plants experiments. Since most of the studies of climate change impacts on crops have focused on the four major staple crops—maize, soybean, wheat and rice—we follow this lead and leverage a previously published meta-analysis of yield impacts of climate change on these four crops [37]. The experiment in which labor capacity is reduced for these four staple crops only is dubbed People and we now proceed to compare the welfare impacts of these two experiments. The third experiment, Combined, shows the impact of the simultaneous implementation of the Plants and People experiments on the current global economy, allowing us to assess what has been missed in prior studies focusing only on yields.
Global welfare changes, in $US Billion, for the three staple crops experiments are provided in figure 5 as well as the economic welfare impacts (% change relative to the 2011 base year value of crop production in each region) for two key regions (The welfare changes for all regions, measured as equivalent variation, as well the sector results, are provided in figures S22–S25 in the SM).
At +3 ∘C warming, relative to our late 20th century baseline, the loss in global welfare under the Combined experiment is about $136 billion, whereas at the same global mean temperature, and considering only the Plants experiment, worldwide welfare decreases by $78 billion. The impacts on unskilled agricultural workers, who are directly exposed to solar radiation, heat and humidity, exacerbate the global results, almost doubling the losses under the Plants scenario. As temperatures continue to rise, there are much larger welfare losses, reaching $227 billion at 4 ∘C warming and $410 billion at 5 ∘C, under the Combined experiment. These losses represent 27% and 49% of value of the four staple crops in the base year, respectively. At higher temperatures, the welfare impact of yield losses grow non-linearly, widening the gap between those losses and the losses due to diminished labor capacity.
Considering only the effects of global warming on agricultural workers (People), the most affected regions are in the low latitudes, particularly sub-Saharan Africa and Southeast Asia (figure 6(a)). Only the United States shows welfare gains under this experiment, driven by improving terms of trade (export prices rise, relative to import prices) (SM figure S8). In contrast, when only Plant impacts are considered, the welfare losses are concentrated in North Africa, Middle East and South Asia following the loss in crop yields due to climate change as well as adverse terms of trade effects (figure 6(b)).

Figure 6. Welfare changes for 3 ∘C global warming. Changes are relative to the 2011 baseline and employ median estimates of the yield and labor capacity changes. The maps show the total welfare changes reported as equivalent variation for staples shocks as follows: (a) labor only (People), (b) crop yields only (Plants), and (c) combined (both People and Plants). Welfare changes are normalized by the value of crop production of all staple crops. The panel (d) shows the same information in a bar chart where the diamonds report on the Combined experiment.
Download figure:
Standard image High-resolution image
Overall, the Combined experiment shows heightened welfare losses in many of the most vulnerable regions already expected to be hard-hit by climate change impacts on staple crop yields (figure 6(c)). In sub-Saharan Africa and South East Asia for example, labor impacts constitute the vast majority (>75%) of the combined climate impacts on crops. In sub-Saharan Africa, modest gains in yield due to CO2 fertilization at lower levels of warming (<2 ∘C) are largely off-set or reversed once labor impacts are accounted for. Our welfare decomposition (SM figures S8–S10) shows the terms of trade effect (export prices, relative to import prices) can attenuate losses in exporting regions since the world crop prices are increasing and the net agricultural exporters tend to benefit from these changes (e.g. USA, Central America, Latin America). On the other hand, net importers lose from these price changes (e.g. North Africa, Middle East) meaning these regions are doubly affected—both by lower productivity of plants and people in their agricultural sector, and by higher import prices.
4. Discussion
This paper has focused on the impacts of global warming on crop and labor productivity and the implications for human welfare. It has demonstrated that the emphasis placed to date on the impacts of warming on plants misses important parts of the larger picture, as our findings show that the generally-omitted impacts on labor capacity in agriculture are equally important at the global level at 3 ∘C warming, and hit the most vulnerable regions harder than the more commonly explored yield impacts. We have erred in the direction of overstating the impact of climate-driven yield changes on output and economic welfare by assuming that the yield losses reflect a loss in the productivity of all inputs, not just land [37]. It is more common in the literature to treat these impacts as only affecting the productivity of land inputs [67]. Doing so would have generated far smaller output and welfare impacts for the Plants experiment. Future changes in precipitation patterns, which are not addressed here, may also affect crop yields, particularly in rainfed systems, as well as the potential for expanding irrigated area as a possible adaptation option.
Not surprisingly, there are significant limitations to this research. Firstly, while both ESI and sWBGT produce remarkably similar patterns of change with global warming, some exceptions exist, especially in sub-Saharan Africa, where climate models diverge on predictions of moisture and cloudiness and the different weighting of variables that constitute the metrics reflect this divergence differently. Secondly, we have not fully reflected the potential adaptations to increased heat stress on farm workers. With the dramatic reduction in labor capacity predicted for some regions—most notably Southeast Asia—one can expect significant changes in crop production [68]. The most obvious adaptations are those that substitute machinery for people. Agriculture—particularly the cultivation of field crops—has become highly mechanized in the wealthiest countries, and we expect this trend to continue [69, 70]. Our economic model incorporates the potential for historically observed levels of capital-labor substitution in response to the higher labor costs. However, we have not explored the full potential for new technologies targeted specifically to lessening heat stress. To the extent that the number of unskilled workers in the sector can be reduced, and the remaining workers can be operating in a controlled environment (e.g. air conditioning), some of the impacts of heat stress on agricultural productivity can be moderated—although at considerable economic expense.
Even more significant is the limitation presented by focusing exclusively on crops. It is well-known that livestock suffer from heat stress [71, 72] and therefore global warming will result in diminished livestock output in many parts of the world. But more work must be done to develop well-calibrated models for the many different species of livestock around the world before global damages to this sector can be accurately assessed.
Another limitation stems from the fact that we impose these climate impacts on the current economy, as opposed to a projected future economy. Projecting the global economy forward to the late 21st century would introduce tremendous uncertainty into the analysis, as such projections are fraught with challenges. Adding the economic dynamics associated with the temperature trajectories explored in this paper would make it much more difficult to discern the contribution of the labor impacts explored here. For this reason, we follow the lead of earlier studies in analyzing the economic consequences of alternative climate impact scenarios using the current economy as a baseline [37, 73]. We note too that presentation of welfare changes per degree of global warming (e.g. figures 3 and 5) differs from much previous impacts work that typically shows the time-path of impacts under a specified emissions scenario. Presenting impacts as a function of global temperature change is valuable for parameterizing 'damage functions' required by integrated assessment models of climate change [17, 37]. However, it is important to note that warming of 4–5 ∘C above 1980–2005 levels is very unlikely to be realized in the 21st century, even under business-as-usual emissions [74].
A final limitation has to do with the fact that we have only considered the demand side of labor market—namely how farms will have to adjust in light of diminished labor productivity. However, there is also an important supply-side to the heat stress impacts. When faced with extreme conditions in outdoor agricultural labor, workers are likely to prefer to work in other sectors [10]. This will have the effect of shifting labor supply to agricultural backwards, thereby further raising wages and boosting food prices. Assessing the disutility of farm labor at elevated temperatures is an area ripe for future empirical work by economists.
5. Conclusions
We have included scaled climate projections from a multi-model ensemble to project changes in agricultural productivity, sector employment and economic welfare. These projections include detailed calculations of changes in labor productivity due to explicitly modeled temperature, humidity, and radiation changes, and how they interact with expected impacts on the crops themselves. In agreement with most previous studies we find that the direct impact of 3 degrees of climate change on crops is most strongly negative in a swath across North Africa, the Middle East, and the Indian Subcontinent. In contrast, the impact of warming on people's outdoor labor capacity is nearly uniformly negative for +3 ∘C warming and results in much more significant economic losses in Africa, South- and Southeast Asia.
While the aggregate welfare impacts of heat stress on the farm labor force are notable, even more striking is the finding regarding unskilled labor force requirements in agriculture. With higher temperatures, humidity and radiation conspiring to reduce individuals' capacity to work outside, the number of workers required to maintain adequate food supplies increases dramatically in sub-Saharan Africa and Southeast Asia, in particular. Some of these food requirements can be imported from less stressed regions, and we have factored this shift in international trade patterns into our analysis. However, most food is still produced in the countries where it is consumed and we expect this propensity to persist in the foreseeable future. Yet in the most stressed regions, the need for more workers will coincide with agricultural work becoming increasingly unattractive due to heat stress. This will create a challenge for commercial agriculture across much of the tropics in the future.
In closing, it is important to note that our baseline begins from a point wherein 0.6 ∘C of warming, relative to the pre-industrial period, has already occurred. This means that the negative effects from 3 ∘C of warming in our analysis is equivalent to 3.6 ∘C of warming relative to a pre-industrial baseline. This suggests that maintaining Paris agreement goals would avoid the worst impacts on labor in agriculture. However, it is important to note that the most negative impacts are focused on regions that are often poorest and most reliant on exposed, outdoor labor for the cultivation of crops. This distributional effect is likely to reduce effective daily earnings and increase inequality [75, 76], which may in turn enhance the likelihood of conflict [77], increase the social cost of carbon [78, 79], and provide additional challenges to achieving the United Nations Sustainable Development Goals [76].
Acknowledgments
This work was supported by the USDA-AFRI Grant Number 2019-67023-29679 'Economic Foundations of Long Run Agricultural Sustainability'; NSF-CBET 'INFEWS/T2: Identifying Sustainability Solutions through Global-Local-Global Analysis of a Coupled Water-Agriculture-Bioenergy System' (Award 1855937); and NSF 1805808-CBET Innovations at the Nexus of Food, Energy, and Water Systems (INFEWS: US-China): A multi-scale integrated modeling approach to managing the transition to sustainability; and Innovations at the Nexus of Food, Energy and Water Security USDA-NIFA (Award 12225279). Additional computing resources support comes from the Swiss National Supercomputing Centre (CSCS) under Project ID s906. We would like to thank the GLASS group at Purdue for great discussion and ideas, and the four reviewers for their comments.
Data availability statement
All data that support the findings of this study are included within the article (and any supplementary files) (www.gtap.agecon.purdue.edu/resources/res_display.asp?RecordID=5736).