

Abstract
Extreme heat and drought often reduce the yields of important food crops around the world, putting stress on regional and global food security. The probability of concurrently hot and dry conditions, which can have compounding impacts on crops, has already increased in many regions of the globe. The evolution of these trends in coming decades could have important impacts on global food security. However, regional variation and the influence of natural climate variability on these trends remains an important gap in understanding future climate risk to crops. In this study, we examine trends in concurrent hot-and-dry extremes over global maize and wheat croplands since 1950. We find that the mean extent of cropland in a joint hot-and-dry extreme increased by ∼2% over 1950–2009, and this trend has accelerated substantially since the mid-2000s, notably in the tropics. While joint hot-and-dry seasons affected at most 1%–2% of global cropland per year during the mid-20th century, they regularly exceeded this extent after about 1980, affecting up to 5% of global crop area. These results suggest that the global climate is transitioning from one in which concurrent heat and drought occur rarely to one in which they occur over an important fraction of croplands every year. While these long-term global trends are primarily attributable to anthropogenic climate change, we find they have been suppressed by decadal climate variability in some regions, especially ones with chronic food insecurity. Potential reversals in these tendencies of decadal variability would accelerate exposure of croplands to concurrent heat and drought in coming decades. We conclude by highlighting the need for research and adaptive interventions around multivariate hazards to global crops across timescales.
Export citation and abstract BibTeX RIS
1. Introduction
Extreme heat and drought often reduce the yields of important food crops around the world (Schlenker and Roberts 2009, Lesk et al 2016, Vogel et al 2017). Crops respond to drought mainly by slowing net photosynthesis and shortening the growth period, reducing the number and mass of harvested seeds. While high temperatures can stress crops directly by decreasing pollen viability and damaging tissues, they can also reduce yields indirectly by reducing soil moisture and inducing drought conditions (Barnabás et al 2008, Prasad et al 2008, Mueller and Seneviratne 2012, Siebert et al 2017). While there are unique physiological pathways by which each abiotic stress affects crop yields, concurrent extreme heat and drought at the same place and time can cause compounding damages to crop yields (Mittler 2006, Urban et al 2015, Matiu et al 2017, Coffel et al 2019, Rigden et al 2020).
The probability of concurrently hot and dry years has already increased in many regions of the globe, driven primarily by anthropogenic warming (Sarhadi et al 2018, Coffel et al 2019). The trend is projected to continue into the future under plausible greenhouse gas emissions scenarios (Mazdiyasni and Aghakouchak 2015, Sarhadi et al 2018), with possible increments due to changing aridity and coupling between temperature and moisture in the large-scale circulation (Berg et al 2015, Zscheischler and Seneviratne 2017) and land–atmosphere interaction (Seneviratne et al 2006). These findings portend increasing exposure to compounding heat and drought stresses in the global food system.
Anticipating the importance of these trends for regional food production requires an understanding of their long-term and shorter-term components. While temperature trends over recent decades have been dominated by steady, long-term anthropogenic warming, precipitation variability in many regions has oscillated under natural decadal climate variability (Giannini et al 2003, McCabe et al 2004, Hoerling et al 2012, Mariotti and Dell'Aquila 2012, Seager and Hoerling 2014). Such decadal variability has likely influenced recent regional trends in concurrent heat-drought, and will likely continue to do so in coming decades. For example, the severe droughts of the 1980s in the Sahel were followed by a decadal wetting trend that has reduced overall aridity (Giannini et al 2003, Giannini and Kaplan 2019, Herman et al 2020). This wetting trend, however, has occurred alongside global warming, that has made the droughts that do occur hotter. Planned drought and heat risk mitigation strategies in the Sahel and elsewhere are predicated on expected ranges of possible near-term future climates.However, the signature of decadal variability in regional trends in concurrent extreme heat and drought, and its potential influence on their future evolution, remain unclear.
In this study, we demonstrate the role of decadal variability in recent regional trends in concurrent extreme heat and drought among key global cropping regions since 1950. We begin by quantifying trends in global total cropland exposure to concurrent extreme heat and drought, and then examine variation in trends across regions and sub-periods of the past six decades. We analyze the relevance of interannual and decadal climate variability to recent trends and demonstrate that decadal climate variability has masked long-term trends towards a more arid, hot growing environment in many of the world's most vulnerable cropping systems. Finally we illustrate how the envelope of plausible future trends in concurrent heat-drought is strongly affected by decadal variability in some regions, raising the potential for accelerating trends globally, but especially in areas with lowest adaptive capacity.
By identifying where observed trends in joint hot-dry extremes are strongly influenced by decadal variability, our study can help prioritize regions and cropping systems for future research and adaptation regarding concurrent heat and drought. We therefore conclude by discussing some strategies for adapting to emerging compound heat and drought hazards in crop production.
2. Methods
2.1. Data inputs and processing
Although observational data are preferable to model simulations as they involve fewer modeling assumptions, they are unavailable over wide areas for soil moisture. To leverage the strengths of observations as much as possible in estimating the occurrence of joint extreme heat and drought, we use Berkeley Earth global daily maximum temperature observations (www.BerkeleyEarth.org) and simulated soil moisture from GLDAS 2.0 Noah land model over 1950–2009 (Rodell et al 2004). Both products were analyzed on the 1.0° resolution of Berkeley Earth data, and the soil moisture data was coarsened from quarter-degree resolution to match the limiting resolution of the Berkeley Earth data. While other temperature and soil moisture data are available after 1979, they do not cover a sufficiently long period for the assessment of decadal variability (i.e. at least 50 years).
While we treat monthly soil moisture variability as a directly agriculturally relevant variable (Rigden et al 2020), extremely hot daily temperatures in particular are most impactful to crop yields (Schlenker and Roberts 2009, Lobell et al 2011). To capture these extreme temperatures over growing seasons, we compute killing degree days (KDDs) from the temperature input as our heat measure (Butler and Huybers 2013), using an optimal temperature of 31 °C for maize and 26 °C for wheat (Sánchez et al 2014). KDDs are defined as the sum of daily maximum temperatures in excess of these optimal thresholds over the growing season. While regional variation in these optimal temperatures remains an area of active research, there is evidence that they are broadly consistent across disparate climates and cropping systems (Schlenker and Roberts 2009, Lobell et al 2011), so we use fixed global thresholds for each crop given the absence of more regionally specific values. Key results for alternative optimal temperatures, shown in figure S1(available online at stacks.iop.org/ERL/16/055024/mmedia), are in broad agreement with each other. We use soil moisture for the top 1 m layer to balance between reflecting variation in root zone conditions and the moisture reservoir across the broader soil horizon.
We apply global crop calendars from Sacks et al (2010) to aggregate KDD via summing and soil moisture by averaging over the crop growth season. We use a complete planting-to-harvest season for maize and three months before harvest for wheat, to exclude the non-growth vernalization period for winter wheat. Our seasonal computations include growth periods from the previous year in certain regions of the Tropics and Southern Hemisphere where planting occurs in boreal autumn, beginning with the 1950 global harvest. Since GLDAS 2.0 is complete only through 2009, we show data from 2001 to 2016 using GLDAS Noah land model 2.1 (Beaudoing and Rodell 2016) for context. However, since this latter data period includes model revisions to the Noah version 3.3 land surface model and is relatively short, we limit our trend analysis to the single GLDAS 2.0 period through 2009 to avoid biasing trends due to model differences. We defined the extent of cropland area and average yields using maize and wheat harvested area and yield data from Monfreda et al (2008).
2.2. Computation of joint extremes and trend estimation
A certain degree of soil moisture deficit and extreme heat exposure are inherent limitations to mean crop yields over much of global croplands. To capture anomalously extreme heat and low soil moisture, we standardize the seasonal soil moisture and KDD time series using the 1950–2009 mean and standard deviations (σ), and identify univariate extremes using two thresholds of 1.5σ and 2σ, defined for each grid cell. We defined each year in a given grid cell as experiencing a joint extreme when the growing season featured KDD in excess of and soil moisture below the respective 1.5 and 2σ thresholds. This step yielded binary maps of grid cells experiencing joint extreme heat and drought for each year.
The strength of defining joint anomalies as simultaneous exceedances of univariate thresholds is that it provides a spatially consistent and transparent measure with concrete links to fixed univariate thresholds. An alternate definition may employ the bivariate extremeness or z-score of the joint anomaly, which may differ from that of the constituent univariate anomalies, depending on the climatological correlation structure between extreme heat and soil moisture. However, bivariate z-scores may reflect any combination of temperature and soil moisture anomalies, potentially obscuring truly joint occurrences of both drought and heat. While the joint univariate anomaly definition is robust to this potential ambiguity, it limits our ability to examine the impact of changing dependence between temperature and moisture over recent decades, which has been assessed elsewhere (Zscheischler and Seneviratne 2017).
To summarize the incidence of joint heat-drought over time, we sum the area of cropland grid cells experiencing joint extremes at both the 1.5 and 2σ thresholds for each year, both at the global and regional levels. To ease the interpretation of this exposed area time series, we express it as a fraction of total global or regional area, defined as the total area of global or regional grid cells containing nonzero crop area. In other words, we do not weight individual grid cells by harvested area when computing areal extent, but instead consider the total area of all grid cells in which crops are grown. This step avoids skewing our trend estimates to the most intensively cropped portions of the globe or regions of interest.
We estimate rates of change in the fraction of global or regional crop area exposed to concurrent heat-drought as the slope coefficient of a linear ordinary least squares regression relating exposed area to time. We use a bootstrap resampling method to estimate the significance of these trends because the potential for temporal autocorrelation in the time series reduces the reliability of parametric standard error estimates. This bootstrap method shuffles the exposed area time series and recomputes the pseudo trends 1000 times to estimate a null distribution with zero expected mean trend. The two-tailed significance of the real trend estimate is then defined based on its percentile in the null distribution (i.e. 99th percentile indicates estimated p = 0.01), relative to a null hypothesis of zero trend.
2.3. Sub-period variation in trends
To examine temporal variation of the trends concurrent heat-drought, we estimate the trends for four 30 year sub-periods distributed decadally over 1950–2009 (1950–1979,1960–1989, 1970–1999, 1980–2009). We do so both globally and for several subsistence or commodity cropping regions. We characterize the evolution of trends over the sub-periods as either significantly positive in all time periods, not significant then becoming positive, or significantly changing sign. Regions in the latter two categories we identify as potentially exhibiting strong influence of decadal variability.
To examine the distribution of trends in joint hot and dry extremes across cropping systems and productivity levels (figure 2), we recompute trends over grid cells binned based on global quartiles of maize and wheat yield from Monfreda et al (2008). Spatial variation in mean yield within crops depends on management variables such as input intensity, mechanization, irrigation, farmer strategy, and cultivar genetics that together reflect a spectrum of cropping systems from low-input subsistence to large-scale cash cropping. An environmental component due to soil quality and climate also limits potential yields, so our stratification encompasses a broad characterization of productivity factors. We compare joint extreme incidence trends across the yield quartiles in absolute units (percent cropland area per year). While the yield quartiles differ in total crop area and mean crop area under a joint extreme, the trends normalized by mean exposure conserve the broad patterns of variability in trends.
2.4. Statistical projection of future joint heat-drought
To examine the implications of historical decadal variability for future trends in concurrent heat and drought, we use a statistical method to estimate an ensemble of plausible future scenarios for the evolution of joint hot-dry anomalies over the next 50 years in selected regions. We use extrapolations based on a statistical decomposition technique rather than physical climate models, as state-of-the-art climate models are known to misrepresent some processes responsible for decadal variability as well as the magnitude of decadal climate anomalies in regions like Europe and the Sahel (Wang et al 2014, Smith et al 2019, Herman et al 2020). This approach leverages only the statistical properties of historical variability to constrain plausible future evolution, rather than relying on uncertain and incomplete mechanistic representations in climate models.
For this statistical decomposition technique, we use the 0.5σ extremeness threshold level to more clearly represent base-level aridity conditions in a region. This extremeness level generally tracks the incidence of observed 1.5σ and 2σ extremes in a decade, but with a greater sample of non-zero years. We then separate the 0.5σ regional concurrent heat-drought extent time series into three parts: (a) the linear trend, which we refer to as the 'long-term trend', (b) the low-frequency component, which we also refer to as 'decadal variability', and (c) the interannual component. We identify the low-frequency component using a Gaussian filter with kernel density of 3 years. We identify interannual variations as the difference between the complete time series and the low-frequency component, then we remove a linear trend from the time series.
To estimate the envelope of future evolution of concurrent heat and drought based on this decomposition, we generate an ensemble of 10 000 plausible futures using the 'surrogate time series' method as in Schreiber and Schmitz (2000) and Coats et al (2016). In this method, we extract the linear trend, and bootstrap both the low-frequency component of the time series and the high-frequency interannual component using phase randomization following the methods of (Ebisuzaki 1997), which allows us to preserve the power spectral density of the data while generating a plausible climate ensemble (Schreiber and Schmitz 2000). The outputs of phase randomization are time series with the time history randomized and the magnitude, variance, and autocorrelation of the prescribed continuum of variability preserved. Extracting a linear trend over a sufficiently long period (here 60 years) as a first-order estimate of a forced trend is reasonable as most regional land-surface warming outside of southeast Asia is projected to scale linearly with global warming up to at least 2 °C (King et al 2018). However, departure of the long-term trend from linearity, for instance due to hydroclimatic regime shifts (Seneviratne et al 2010, van den Hurk et al 2016), would render our projections conservative.
To succinctly represent the large ensemble of plausible futures, we calculate the linear trend over the first 50 years of each projected ensemble member and choose ensemble members corresponding to the 5th and 95th percentile trends in each region. These members illustrate possible futures with a relatively cooler, wetter climate or a relatively drier, hotter climate in the coming decades. In these members, we identify years where regional crop area exposed to concurrent heat and drought exceeds the historical 95th percentile. We also identify the windows of time preceding the first such event in our extrapolations with black arrows, indicating a 'grace period' before the emergence of hotter and drier conditions. To avoid the impression that our projections provide specific useable information for specific years in the future, we present the projections in terms of arbitrary 'model years', rather than actual calendar years.
2.5. Limitations
We note several limitations of our methods that may serve as avenues for future research. First, we rely on soil moisture data modeled in global land surface models that have known uncertainties, especially where observations are scarce (Berg and Sheffield 2018, Dai et al 2018). Second, while we focus on the top 1.0 m layer of soil, varying depths may be equally or more important in certain contexts. For instance, recently deployed microwave soil moisture observing platforms, which provide a spatially complete dataset for calibrating models, measure a thinner surface layer. However, this horizon is of incomplete relevance to crops, which can access water well below this surface layer (Berg et al 2017). Antecedent soil moisture anomalies preceding the growing season may also merit further attention. Third, while we use KDD as an established measure that captures non-linear temperature impacts on crop yields (Schlenker and Roberts 2009, Butler and Huybers 2013), its computation relies on a threshold temperature which is not calibrated to all cropping systems. We may thus under- or overestimate annual exposure to damaging heat extremes in some regions, and greater spatial specificity in temperature thresholds is needed. Finally, we define cropping seasons using static crop calendars (Sacks et al 2010). Future work on concurrent heat and drought may consider differential trends in sub-periods of the season in which crops are particularly vulnerable (Lobell and Gourdji 2012, Jägermeyr and Frieler 2018) or climatological heat-drought feedbacks are strongest (Seneviratne et al 2010, Miralles et al 2019). In addition, growing seasons may be changing with time to avoid peak concurrent heat and drought risk.
3. Results
Global aggregate incidence of joint hot and dry extremes during maize and wheat growing seasons have increased since 1950 at a rate equivalent to ∼1% of global cropland per 30 years (p < 0.001) for 1.5σ events (figure 1). While trends in absolute area affected are smaller for more extreme 2σ events, they are similar to those in 1.5σ events in relative terms when normalized to mean extent. On a multidecadal period, these trends are predominantly a result of increasing incidence of univariate hot extremes, with a smaller contribution from trends in the dry counterpart (figures 1(b) and (d)).

Figure 1. Trends in the spatial extent of cropland exposed to concurrent hot and dry extremes. (a) Time series of percent global maize cropland exposed to concurrent heat-drought at 1.5 and 2σ thresholds from 1950 to 2009 (using GLDAS 2.0) and from 2001 to 2016 (using GLDAS 2.1). Dotted vertical lines show major El Niño events. (b) Relative linear trends (±SE) normalized to 1950–2009 mean spatial extent. Bars with no hatching denote bootstrap estimated p < 10−3 and hatching denotes p < 0.01 (see section 2). (c), (d) same as (a), (b) but for wheat.
Download figure:
Standard image High-resolution image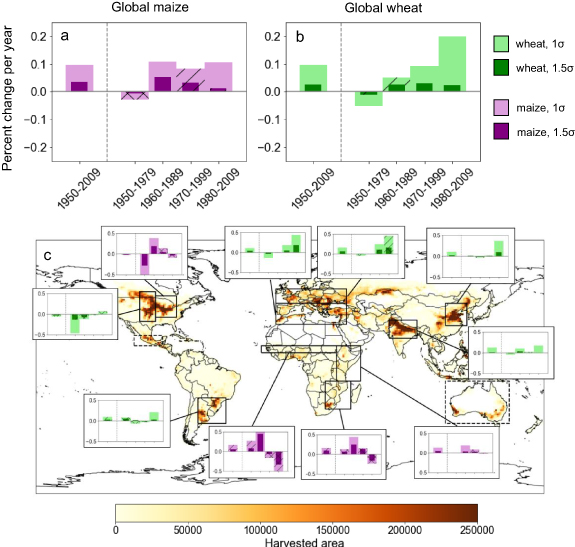
Figure 2. Variability of trends in the percent area exposed to concurrent hot-dry extremes for wheat and maize in each region and globally. Trends in joint hot-dry extremes over the full study period (1950–2009) and over selected 30 year sub-periods for global (a) maize and (b) wheat cropping regions. Panel (c) as in panels (a) and (b) but for key cropping regions. Wider, lighter-colored bars denote joint extremes at the 1σ level and narrower, darker-colored bars denote joint extremes at the 1.5σ level. Bars with no hatching denote bootstrap estimated p < 0.01, single hatching denotes p < 0.05, and cross hatching denotes p > 0.05 (see section 2). Green bars denote trends for wheat, while purple bars denote trends for maize. No significant trends were found in Australia for wheat or Mexico for maize, so regional trends are not shown.
Download figure:
Standard image High-resolution imageGlobal trends in hot and dry extremes manifest clearly with larger peaks and mean values after 1980 (figure 1). While the extent of maize crop area under a joint 1.5σ extreme was <1% on average and never exceeded 2.5% prior to 1980, it was ∼2% on average and exceeded 2.5% six times over 1980–2009 with peaks up to 5%. These changes illustrate a qualitative shift in the incidence of hot and dry extremes, with a tendency towards larger peaks and substantial crop area exposed in any given year. This tendency has been further amplified since 2010, with unprecedented peak area exposure and mean exposure similar to the largest peaks over 1980–2009 (figures 1(a) and (c)). While some important peaks in global extent of hot and dry extremes correspond to large El Niños in 1982–1983, 1998, and 2015–2016 (2%–3% global crop area; Lyon 2004, Anderson et al 2019), many equally large peaks occur in neutral El Niño-Southern Oscillation states.
The overall trend towards a different climate state can be conceptually separated into three components: a long-term trend, decadal variability, and interannual variability. Estimated trends in figures 1(b) and (d) reflect long-term trends across the full study period, but shorter-term variability is visible in the global extent time series (figures 1(a) and (c)). To identify regions with a strong signal of decadal variability, we examine trends computed over 30 year periods and compare the variation of the sign and magnitude of these trends across regions. We identified regions where significant sub-period trends changed signs as regions with a strong signal of decadal variability.
Both global and regional long-term (1950–2009) trends are significant and positive everywhere outside of North America, which has experienced no significant trend (figure 2). Global trends are negative or statistically insignificant during 1950–1979, but positive and significant in every 30 year window thereafter (figures 2(b) and (c)). Regional trends, however, demonstrate significantly greater variability in both sign and magnitude, and tend to follow three patterns: relatively constant (reflecting a dominance of long-term trends), transitioning from insignificant to large and positive, or substantially changing signs (both reflecting potentially important decadal variability, figure 2(a)).
Concurrent heat-drought trends in India and Southeast South America are small but emerge as significantly positive in the most recent period. Meanwhile, the largest positive regional trends over the last 30 years are concentrated in wheat growing regions of Europe, the Mediterranean, and the North China Plain, where trends are an order of magnitude greater than the global average. These regions, which are major breadbaskets of the world, have experienced consistent trends towards more frequent hot and dry extremes in recent decades. Several regions have exhibited sign changes in sub-period trends from significantly negative to positive, or vice versa, suggesting a strong role of decadal variability. In central North America, trends have swung from strongly negative in the 1950–1979 period to near zero in the most recent period. Trends in joint hot-dry extremes demonstrate generally more variation from decade to decade in key maize regions as opposed to wheat regions, with large sign reversals in the US Midwest, the Sahel, and southeastern Africa.
Because cropping systems of varying productivity and intensity differ in their adaptive capacity and susceptibility to climate stresses (Cohn et al 2017), we examine variation in sub-period trends in concurrent heat-drought across yield quartiles over 1950–2009 and for two illustrative sub-periods (figure 3). For maize, trends in 1.5σ hot and dry extremes over the full study period are largest in the lowest quartile (least productive cropping areas), amounting to a 1% increase per ∼20 years compared to ∼30 years in other quartiles (figure 3(a)). Trends over 1960–1989 and 1980–2009 also differ dramatically in magnitude and even sign for the lowest yield quartile (figures 3(c) and (e)), suggesting stronger modulation of trends by decadal and interannual variability. Thus, the lowest yielding maize croplands have experienced the largest trends in concurrent heat and drought over 1950–2009, as well as the greatest decadal variability in these trends. These low-latitude, low-yielding maize cropping systems are more vulnerable to climate change already as compared to more intensive, higher-yielding midlatitude systems (Rosenzweig et al 2014, Cohn et al 2017).

Figure 3. Variation of trends in concurrent hot and dry extremes across croplands by productivity and for differing time periods. (a)–(f) Trends in hot and dry extremes (±SE) over maize and wheat croplands by mean yield quartile for (a), (b) the full study period of 1950–2009, (c), (d) the 1960–1990 subperiod, (e), (f) the 1980–2009 subperiod. (g) Map of mean maize yield quartiles. (h) Map of mean wheat yield quartiles. Gray areas denote non-croplands.
Download figure:
Standard image High-resolution imageFor wheat, trends over 1950–2009 are larger for both the lowest and highest yield quartiles and show a smaller influence of decadal variability in the two sub-periods (figures 3(b), (d), and (f)). Variation in trends across the sub-periods are also reduced for wheat compared to maize except for the third quartile, which represents fairly intensive cash cropping distributed widely across continents and latitudes. Thus, vulnerability implications of decadal variability differ meaningfully for the two crops.
Among the regions we examine in figure 2, we contrast regions with consistently positive trends from those with emerging or decadally-variable trends. However, individual years with extensive joint hot-dry extremes often underlie each of these trend patterns. In figure 4, we show absolute and smoothed time series of the extent of cropped in concurrent heat and drought for several key regions. In the Tropics and the Mediterranean portions of Europe, long-term increasing trends in the extent of concurrent heat and drought are visible both as increasing amplitude and frequency of annual events. In the North China Plain, faster increases in recent periods have been driven by numerous annual events in the 2000s (figure 4(b)), in contrast to earlier periods where no strong increase was found (figure 2(a)). These two regions do not display a strong signal of decadal variability. By contrast, multiple extensive drought-heat events in the Sahel, US Midwest, and Southeastern Africa during the 1980s were followed by a reduction in cropland area under concurrent heat and drought, resulting in increasing long-term trends until the 1980s, with a reversal in trends thereafter (figures 4(c)–(e)).
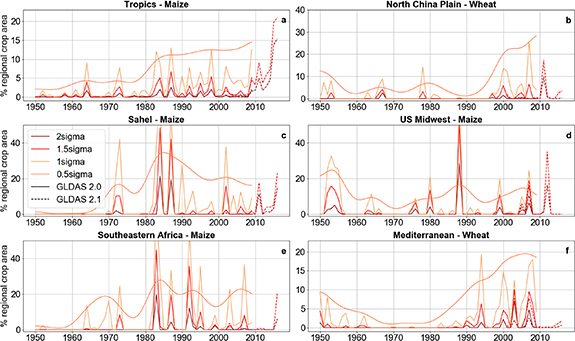
Figure 4. Spatial extent of regional cropland under concurrent hot and dry extremes. Time series of percent regional maize or wheat cropland under concurrent heat-drought at 1, 1.5 and 2σ thresholds from 1950 to 2009 (using GLDAS 2.0) and from 2001 to 2016 (using GLDAS 2.1). 3 year Gaussian kernel smoothed time series are shown for the 0.5σ concurrent anomaly. (a) Tropics, (b) Northern China, (c) Sahel, (d) Australia, (e) Southern Africa, and (f) Europe. The dominant crop for each region is shown. See figure 2 for region boundaries.
Download figure:
Standard image High-resolution imageTwo broad conclusions about the various timescales of variability in these cropping regions depicted may condition expectations for future regional trends in concurrent heat and drought. First, regional time series of concurrent heat-drought extent are strongly influenced by high interannual variability and an important signature of a few specific years with extensive concurrent heat and drought. Second, decadal and interannual variability have interactive contributions to the evolution of concurrent heat and drought over time. These two conclusions about recent trends underscore the importance of interactions between long-term trends and shorter-term variability, which will jointly determine the envelope of plausible near-term concurrent heat and drought exposure.
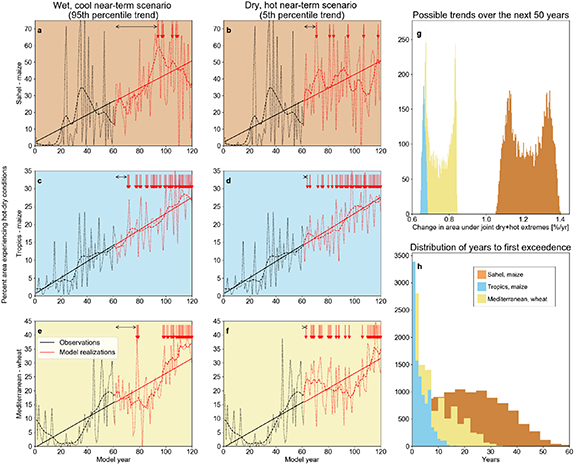
In our illustrative projections, we find that while a rise in concurrent heat-drought with long-term warming is consistent across the full envelope of plausible futures, the spread of near-term trends (figure 5(g)) depends on the relative strength of low-frequency variability in each region. A stronger regional magnitude of decadal variability increases the breadth of the envelope of plausible evolution joint heat-drought in the next few decades (figure 5(h)). In the circumglobal Tropics, where long-term warming dominates recent trends and low-frequency variability is weak (figure 4(a)), >95th percentile concurrent heat and drought years quickly become common within 10 years in both scenarios (red arrows, figures 5(c) and (d)). We note that this projection is consistent with the observed large extent of cropland under concurrent heat and drought after ∼2010 from GLDAS 2.1 (figures 1(a), (c) and 4(a)).
Figure 5. Risk envelope for plausible near-term evolution of concurrent heat and drought extent. Percent of area experiencing joint hot-dry conditions in the Sahel (a), (b), the Tropics (c), (d), and the Mediterranean (e), (f). Ensemble members with the 95th (a), (c), (e) and 5th (b), (d), (f) percentile trends over the next 50 years, which represent plausible drier, hotter near-term climates or wetter, cooler near-term climates, respectively. Observations are used for the first 60 years (black lines), followed by plausible climate realizations (red lines). Solid-, dashed-, or dotted-lines indicate the long-term trend, decadal, and interannual portions of the signal. Red arrows at the top of each panel indicate a year in which the observed 95th percentile is exceeded, while the horizontal black arrow indicates the window of time until the first exceedance. (g) Regional distribution of trends in extreme heat and drought over the next 50 years. (h) Regional distribution of the number of years until the first exceedance of the observed 95th percentile heat and drought extent.
Download figure:
Standard image High-resolution image
By contrast in the Mediterranean and the Sahel, where decadal variability more strongly influences the occurrence of joint heat and drought, this window prior to emergence of frequent extensive concurrent heat and drought can last up to 30 years (figure 5(h)), with the timing dependent on the phase of the low-frequency component (figures 5(a), (b), (e), and (f), black arrows). In particular, >95th percentile concurrent heat and drought years in the Sahel remain less common than in the Mediterranean in the projected 50 year period, even given positive long-term trends. This likely arises from a key difference between these regions, namely that interannual variability in the Sahel is substantially larger than in the Mediterranean. High interannual variability reduces the statistical extremeness of high values of cropland under concurrent heat and drought, making the shift to concurrently hot and dry climate in the Sahel less clear and consistent than in the Mediterranean. Nevertheless, we note that under all scenarios, extensive heat-drought events become common after around 40 years, occurring at least once per decade and as much as almost every year. The plausible envelope of projections excludes a return to mid-century climatology of joint heat-drought.
4. Discussion and conclusions
Our results show that the extent of global croplands experiencing concurrent heat and drought has risen significantly and consistently since 1950, at a rate of about 1% per 30 years (figures 1 and 2(c)). However, trends have varied decadally in many regions, with sub-periods where trends were not significant or even decreasing (figure 2(a)), suggesting a signal of decadal climate variability in the occurrence of concurrent heat and drought. The lowest yielding maize croplands globally have had the greatest and most variable trends compared to higher yielding areas (figure 3), indicating a disproportionate burden of these trends in terms of rate and predictability on farmers that were already the most vulnerable to climate change (Rosenzweig et al 2014, Cohn et al 2017).
Strong decadal variation in trends in some regions like the Sahel, the US Midwest, and southeastern Africa was driven by a relatively small number of extensive annual events (figure 4). This shows how long-term climate trends, decadal variability, and annual extreme events together shape the evolving statistics of concurrent heat and drought. Large El Niño years comprised a modest portion of these particularly extensive events (figure 1). Our projections leverage historical variability on each of these timescales to estimate an envelope of plausible future extent of concurrent heat and drought, and show how large decadal variability (for instance in the Sahel and Mediterranean) makes this envelope wide, encompassing both multidecadal hiatuses in the increasing frequency of extremes and futures where extensive events become common place within a few years. Despite this, in all scenarios concurrent extreme heat and drought become widespread almost annually beyond about 40 years.
4.1. Importance of decadal variability for concurrent heat-drought trends
Our results show the relevance of decadal variability to the evolution of concurrent heat and drought risks during the coming decades. However, the proposed origins and mechanisms of decadal variability are varied and debated, having been attributed to slow oceanic thermodynamic and dynamic processes (Di Lorenzo et al 2015, Newman et al 2016), superposition or modulation of higher-frequency climate modes (Wittenberg 2009, Newman et al 2016), or changes in anthropogenic forcings such as land-use change and aerosol emissions (Clement et al 2015). While modes of decadal variability have been linked to variation in crop yields (Mehta et al 2012, Tian et al 2015, Capa-Morocho et al 2016, Schillerberg et al 2019, Schillerberg and Tian 2020), the precise causes of decadal variability remain uncertain.
Identifying the causes of decadal climate variability is critical because the specific cause informs the plausibility of future trends in concurrent heat and drought. For instance, a drying trend linked to an oceanic climate oscillation may recur at semi-regular intervals, while one linked to long-term aerosol reductions from economic trends will likely not reoccur. Despite the importance of these processes, climate models remain deficient in realistically simulating decadal climate variability in many regions (Wang et al 2014, Smith et al 2019, Herman et al 2020). This presents a methodological challenge to characterizing possible future evolution of climate risks linked to decadal variability. We partially address this by basing our illustrative projections only on historical variability, a method that is agnostic of precise cause. Further, our analysis identifies several key regions where decadal climate variability has been historically important, and thus is likely to influence the envelope of possible futures. To summarize what factors are likely to influence trends in coming decades and what major uncertainties persist, we elaborate briefly on the relevant sources of decadal variability in these key regions.
4.2. Regional dynamics of climate variability
In Africa, both the Sahel and southeastern Africa have experienced significant decadal climate variability in recent decades. Severe multi-year droughts in the Sahel in the 1980s devastated crops and led to widespread hunger in the absence of an adequate humanitarian response. That these droughts were forced by surface temperature (SST) anomalies in the Atlantic Ocean is widely accepted (Giannini et al 2003), although the root cause of those SST anomalies is still debated (Herman et al 2020). One possible culprit is the anthropogenic emission of sunlight-blocking aerosols, which, having declined over the North Atlantic in recent decades, are unlikely to increase again, making a resurgence of such severe droughts in the future unlikely (Giannini and Kaplan 2019). By contrast, if the root cause is natural variability in Atlantic Ocean circulation, then a dry phase of the oscillation could re-emerge in the near future.
In Southern Africa decadal variability has long been identified, and recently hypothesized to be either a combination of interannual ENSO teleconnections and Indian Ocean teleconnections, or low-frequency ENSO-like decadal variability in the Pacific Ocean SSTs themselves (Graham and Goddard 1999, Reason et al 2002, Tyson et al 2002, Hoell et al 2017). Both hypotheses for southeastern Africa are centered in natural variability, so may occur in the future as they did in the past.
In the United States, sign reversals in concurrent heat-drought trends have links to low-frequency SST variations in the Atlantic and Pacific Oceans. These low-frequency SST signals caused low precipitation and high temperatures in the 1950s followed by a cooling and wetting in the 1970s (McCabe et al 2004, Seager and Hoerling 2014). Other processes, however, have also influenced variation in trends, including the cooling effect of irrigation and rising in crop yields after 1960 (Mueller et al 2017, Butler et al 2018). Long-term trends in the Great Plains and the Corn Belt are not towards aridification (Cook et al 2020), but given the historical influence of natural variability in the region, there may yet be aridification in the near-term climate due to natural causes.
Mid-latitude wheat regions have experienced the largest trends towards more frequent dry-hot conditions in the last 30 years as a direct result of anthropogenic climate change. In the case of the Mediterranean portions of Europe, we find both a signal of decadal variability (Hoerling et al 2012, Mariotti and Dell'Aquila 2012) and an accelerating incidence of heat-drought events as a result of anthropogenic warming (Hoerling et al 2012, Seager et al 2019), which leads to not only hotter conditions but also a permanent aridification of these climates (Seager et al 2019) that would significantly threaten wheat production (Zampieri et al 2020). Trends towards warmer drier conditions have also recently emerged in the North China Plain, which was already water scarce, as a result of anthropogenic climate change. Precipitation has varied considerably in the North China Plain over the last 60 years, but the trend towards more frequent hot-dry conditions is largely attributed to temperature increases (Fu et al 2009). All of these mid-latitude wheat growing regions will experience increasingly frequent hot-dry extremes, although the rate at which the climate shifts remains uncertain, as illustrated in figures 5(e) and (f).
4.3. Implications for future trends and adaptation
An overall conclusion we draw from the state of knowledge on regional dynamics of climate variability is that diverse and interacting drivers contribute to decadal evolution of heat and drought incidence. In all of the aforementioned regions—Africa, North America, and the Mediterranean—the range of plausible regional trends in the coming decades depends on the strength of decadal climate variability locally, which can reduce or amplify long-term trends attributable to greenhouse gas emissions. Our results suggest that the global aggregate rise in joint growing season hot-and-dry extremes in recent decades has been suppressed by cooling and wetting trends in Africa and North America. But the incidence of joint heat-droughts in the coming decades in the Sahel, southeastern Africa, and North America will depend on decadal variability. The future potential for decadal climate variability to amplify, rather than dampen, trends towards hotter and drier conditions would both restore increasing trends in low-latitude maize growing regions—those already most vulnerable to climate change (Rosenzweig et al 2014, Cohn et al 2017)—and accelerate trends in the global aggregate (figures 3 and 5(e)–(f)). Cropping in these vulnerable maize regions is primarily carried out by smallholder farmers (Cohn et al 2017, Ricciardi et al 2018) with high direct dependence on harvests for food security.
The potential for increasing trends suggested in our projections is especially salient given the recent considerable increase in the fraction of global croplands under hot-and-dry extremes since ∼2010 (figures 1(a), (c) and 4). The spike in part reflects increasing regularity of exceedance of the KDD thresholds with long-term warming (figures 1(b) and (d)), especially in the tropics where climatological temperature variance is low (figures 4(a) and (c)). Potential non-linear increases in joint hot-and-dry seasons with mean warming combined with compound crop impacts raise the possibility of rapidly worsening risk to the global food system. Most generally, the past two decades indicate that the global climate is transitioning from one in which these joint extremes occur rarely to one in which they occur over an important fraction of croplands every year.
Such a possibility underscores the need to establish the mechanisms of decadal variability and to advance work on adaptation measures, specifically with regard to joint heat and drought. Concretely, our results signal the need for incorporating joint and heat drought hazards into improved forecasts, emergency-relief strategies, and crop management and development. While work towards operational prediction of the near-term climate to complement existing seasonal predictions is ongoing (Goddard et al 2012, Cassou et al 2018, Kushnir et al 2019), the potential for continued increasing prevalence of joint heat and drought will necessitate adaptation of cropping systems, even with improved prediction.
Our study highlights the urgency of considering heat and drought jointly in adapting crops and food systems to climate change. While irrigation could be deployed over presently rainfed crops, its potential is limited by suboptimal techniques and available water in many places (Elliott et al 2014, Jägermeyr et al 2016). Shifting sowing dates has been proposed to avoid seasonal peak heat or drought, and these decisions should account for seasonality of joint stresses as well. Increasing compound stress will likely require breeding crops for greater resilience to multivariate stresses (Bänziger et al 2006, Tack et al 2017), especially for subsistence cropping systems that presently receive insufficient investment and research. Because crop breeding takes decades (Challinor et al 2016), these efforts need to be prioritized immediately. Finally, increasing concurrent heat and drought risk will enhance the need for policy to improve the climate resilience of the food system, including financial and technical support for farmer adaptation (Stringer et al 2020).
Acknowledgments
This material is based upon work supported by the National Science Foundation Graduate Research Fellowship under Grant No. DGE—1644869. W Anderson was funded by the Earth Institute Postdoctoral Fellowship. This work is undertaken as part of the Columbia World Project, ACToday, Columbia University in the City of New York. Thanks to Radley Horton for helpful feedback on the manuscript.
Data availability
The data that support the findings of this study are openly available online from the links in table S1.
The data that support the findings of this study are openly available at the following URL/DOI: https://doi.org/10.5067/9SQ1B3ZXP2C5.
Author contributions
Both authors conceptualized the study, ran the analyses, and wrote the paper.
Conflict of interest
The authors declare no competing financial interests.