

Abstract
Higher levels of soil organic matter improve soil water retention, meaning they could mitigate agricultural yield losses from drought. Yet evidence to support such claims is mixed and incomplete. Using data from 12 376 county-years in the United States of America, we show that counties with higher soil organic matter are associated with greater yields, lower yield losses, and lower rates of crop insurance payouts under drought. Under severe drought, an increase of 1% soil organic matter was associated with a yield increase of 2.2 ± 0.33 Mg ha−1 (32.7 bu ac−1) and a 36 ± 4.76% reduction in the mean proportion of liabilities paid. Similar, yet smaller, effects were found for less severe levels of drought and this effect was reduced as soil clay content increased. Confirmatory pathway analyses indicate that this positive association of soil organic matter and yields under drought is partially explained by positive effects of soil organic matter on available water capacity and cation exchange capacity, but that soil organic matter may be imparting yield protection via mechanisms not fully captured by those metrics. Overall, our results suggest soil organic matter predicts yield resilience at regional scales in the United States. We argue that data on soil organic matter should be used in agricultural policy and financial planning, with our analyses providing quantitative evidence of the co-benefits of soil organic matter believed fundamental to advancing soil health and carbon sequestration initiatives.
Export citation and abstract BibTeX RIS

Original content from this work may be used under the terms of the Creative Commons Attribution 4.0 license. Any further distribution of this work must maintain attribution to the author(s) and the title of the work, journal citation and DOI.
1. Introduction
Rain-fed agriculture, which made up 75% of global cropland use as of 2000 (Portmann et al 2010), is highly susceptible to extreme weather conditions, such as heat and drought. Extreme heat accelerates plant development, effectively shortening growing season length and reducing harvest index, and in extreme instances, extreme heat causes plant reproductive failures, such as kernel abortion in maize, that drastically reduce yields (Sage and Kubien 2007, Craufurd and Wheeler 2009, Hsiao et al 2019). Similarly, drought leads to elevated vapor pressure deficit which can lead to increased transpiration by plants, closing of stomata, and ultimately reduced rates of photosynthesis that slow plant growth and reduce grain yields (Lobell et al 2013, 2014). Climate change is predicted to increase the incidence and severity of droughts and floods (Meehl et al 2007, Luber and McGeehin 2008), thereby increasing the risk of crop failures and yield losses (Urban et al 2012). Conservative estimates for maize suggest yields could drop between 20% and 80% in the US under plausible future climate scenarios (Schlenker and Roberts 2009, Lobell et al 2014, Hsiao et al 2019). Such scenarios threaten global food security and suggest that resilience planning to mitigate these impacts is necessary.
Increasing soil organic matter can increase soil water holding capacity on similarly textured soils (Hudson 1994, Minasny and McBratney 2018) and improve water infiltration (Boyle et al 1989, Elliott and Efetha 1999, Franzluebbers 2002) by supporting greater aggregate formation and, hence, a greater volume of pore spaces (Lado et al 2004). Researchers have argued that soils with higher organic matter can retain more water under vapor pressure deficit, protecting crops from losses induced by extreme heat and drought better than low organic matter soils (Bot and Benites 2005, Iizumi and Wagai 2019, Carminati and Javaux 2020). Yet recent work suggests the actual effect of soil organic matter on plant available water is modest (Libohova et al 2018, Minasny and McBratney 2018), and it is unclear whether these effects on water retention are great enough to reduce drought-induced yield losses. Studies have demonstrated that higher soil organic matter is associated with lower long-term interannual yield variability at regional scales (Pan et al 2009, Williams et al 2016). But lower variability is not necessarily indicative of greater resilience or protection against yield losses and/or crop failure under adverse conditions. Some field-level studies have shown that practices known to increase soil organic matter can protect yields (Gaudin et al 2015, Bowles et al 2020), but these do not explicitly test the relative effect of organic matter and do not provide information at county or regional scales which are arguably most relevant to policy initiatives. Furthermore, these studies did not attempt to quantify how the effect of soil organic matter on yields does or does not scale under different drought conditions.
In light of these evidence gaps, we quantified the impact of soil organic matter on agronomic risk to drought in the United States of America. We analyzed county-level maize (Zea mays L.) yield and crop insurance payouts in the US from 2000 to 2016 in combination with soil characterization data and county-level Standardized Precipitation Evapotranspiration Index (SPEI) data. Data were gathered for 754 counties where maize production was predominantly rain-fed, representing a total of 12 376 county-years, 5945 of which experienced drought conditions over the summer growing season (Kane et al 2020). We hypothesized that counties with higher levels of soil organic matter in surface soils (0–30 cm depth) where most of the fine-root biomass is found, would be less prone to yield losses in drought years given expected positive effects of soil organic matter on crop water availability and that, as a result, a lower proportion of crop insurance liabilities would be paid out in drought years.
2. Methods
2.1. Data collection
2.1.1. Maize yield data
We collected mean maize (Zea mays L.) yield (Mg ha−1) data for all US counties between the years 2000 and 2016 for which maize yield data were available from the United States Department of Agriculture National Agricultural Statistics Service (USDA NASS) (USDA NASS Staff 2018) accessed via the rnassqs package (Potter et al 2019) in the R v.3.6.3 statistical software environment (R Core Team 2020). Data were limited to the years 2000–2016 to minimize the confounding effect improvements in maize genetics may have on yield data and because other data used to estimate drought incidence in each county detailed below were only available beginning in the year 2000. We removed data from counties in which corn was not grown for at least 16 of the 17 years in the study period. Yield data were then detrended on a county basis per the method detailed in Lu et al (2017). Briefly, we fit a locally weighted regression model wherein yield was the dependent variable and year was the independent variable. Models were fit using the R package caret (Kuhn et al 2020) using a ten-fold cross validation approach wherein the span parameter was constrained to a range of 5–10 years and the degree parameter was allowed to be either 1 (linear) or 2 (polynomial). We then added the yearly residuals of these models to the long-term county average yield to estimate detrended yield for each county-year in the study period, and we also divided the observed yield by the predicted yield of these models for each county-year to estimate yield anomaly.
Because soil organic matter might protect yields by improving soil water dynamics, irrigation could mask the effects of soil organic matter on agricultural resilience. As such, we restricted the analysis to primarily non-irrigated acres. We also retrieved data from USDA NASS (USDA NASS Staff 2018) via the rnassqs (Potter et al 2019) on the total number of corn acres harvested in each county-year and the total number of irrigated corn acres harvested in each county-year for the US Agricultural Census years of 1997, 2002, 2007, and 2012. The US Agricultural Census is conducted every 5 years, so data on irrigation within our study period is only available for those years. We then calculated the percent of maize-growing acres that were irrigated in each county for each census year, averaged those figures across all four census years, and filtered yield data to those counties in which corn-growing acres were on average ⩽5% irrigated during the study period and in which average acres irrigated had a standard deviation of ⩽1% across the four census years for which data were retrieved.
2.1.2. Drought data
We retrieved county-level SPEI figures from the Center for Disease Control (National Environmental Public Health Tracking Network 2018). SPEI is a multi-scalar drought index based on the similar Standardized Precipitation Index (Vicente-Serrano et al 2009, 2012). Differences between cumulative monthly precipitation and potential evapotranspiration are calculated for a chosen time scale (i.e. 1 month, 3 months, etc). These figures are then standardized based on a log-logistic distribution so that they are comparable across locations. The CDC dataset we used is based on a 1 month standardization. We summarized SPEI data in each county-year by calculating the mean of monthly SPEI values for the summer growing season months of May to August.
In addition to SPEI, we also retrieved drought data from The National Drought Mitigation Center (The National Drought Mitigation Center 2019c), which reports on a daily basis the percent area of each county that is at each level of their drought index: D0 (no drought)—D4 (severe drought). This drought index is a categorization based on the Palmer Drought Severity Index, Standardized Precipitation Index, soil and streamflow models, and local expert assessment/verification by USDA field agents (The National Drought Mitigation Center 2019b). We then converted these coverage statistics to a daily Drought Severity Classification Index (DSCI), per the instructions of the US Drought Monitor website (The National Drought Mitigation Center 2019a). Briefly, DSCI is a weighted sum of the percent area of each county under each drought index level. We then subset daily DSCI data to the months of May to August, the months that are most crucial to maize growth and yield, and averaged them for each county-year across the study period. DSCI data were not used in our primary analyses but were instead used in a set of sensitivity analyses (supplementary information) to determine the relative importance of how drought is quantified on estimating the mitigating effect of soil organic matter on yields under drought.
2.1.3. Crop insurance data
The USDA Risk Management Agency collates a variety of data on the US crop insurance market on an annual basis, including total liabilities, total indemnities, and cause of loss. These data are available at the county-level via the USDA Southwest Climate Hub's AgRisk Viewer (Southwest Climate Hub 2018). We retrieved data on total liabilities and total indemnities in USD for maize due to loss by drought for the same set of counties for which we retrieved yield data. We then used these data to calculate loss cost (Reyes and Elias 2019), a unitless index based on the ratio of total indemnities to total liabilities in a given county-year. Loss cost implicitly accounts for differences in USD figures across years due to inflation, as well as differences across counties due to differences in total output and coverage patterns.
2.1.4. Soil data
To aggregate soil data for each county in our analysis we first identified those areas in each county that are primarily used for maize production. To do so, we used the 'Corn Frequency' raster available at USDA NASS's CropScape portal, which reports how many years between 2008 and 2017 each pixel was used for maize production (Han et al 2014). We then subset this raster to only those pixels in which maize was produced for two or more years to identify pixels from any field in which maize was grown with relative consistency but not opportunistically (e.g. in a high price year), while also eliminating non-crop areas. This subset of pixels was then used to generate a masking layer used in subsequent steps.
The gSSURGO database is spatially organized as a series of discrete polygons referred to as map units that are composed of different component soil series. Associated with each soil series is characterization data organized by pedological horizon, including soil texture, soil organic matter, and measures of soil biophysical characteristics. As such, we first used the aqp (Beaudette et al 2020) package in R to convert characterization data for each component soil series to a fixed depth increment of 0–30 cm to represent the typical rooting zone of maize. We then calculated a representative map unit value for each soil characteristic soil organic matter (%), clay content (%), H3O+ concentration (mol), cation exchange capacity (meq 100 g soil−1), and available water capacity (%) by calculating a map unit mean weighted by the relative proportions of each component soil series in a map unit. We then converted the data to a raster format and used the masking layer described previously to remove soil data in each county from areas where maize is not consistently grown. Finally, we used these masked rasters to calculate county-level means for all soil properties we then used in our analyses.
2.1.5. Cropping system management
For the purposes of this study we did not include data on the rates of different cropping system management strategies or practices, such as mean fertilizer rate by county or incidence of conservation tillage by county. Such data are not available at the county level or on a timestep that would make them sufficiently useful for our analysis. For example, data on per area fertilizer use is available via USDA NASS only at the state level, and questions on implementation of conservation agriculture practices were only recently included in the agricultural census. Given these inconsistencies in data, we could not account for management effects with a fixed effect for each practice. Instead, we accounted for them by implementing a random effect for state (section 2.2). We argue that since farms in the same state are generally more likely to implement fertilizer rates and management practices similar to other farms in their state than those out of their state, our model accounts to some degree for broad differences in management. Whereas direct estimation of the effect of different management practices would be preferable, sufficient data simply do not exist and use of current, sparser data could lead to flawed inference.
2.2. Data analysis
Initial data analysis demonstrated that the yield response to SPEI begins to saturate above SPEI values of 0, indicating that when the balance of precipitation and evapotranspiration is negative, yields drop below the typical yield potential of a given area. Additionally, we found that when SPEI decreased (i.e. drought conditions became more severe) the impact of soil organic matter was greater on maize yield (Mg ha−1), yield anomaly, and loss cost (supplementary information). As such, we chose to subset our data into different levels of drought severity based on SPEI and then analyze each subset to understand how the effect of soil organic matter on each outcome variable changed as drought severity changed. Drought severity thresholds were calculated based on the global mean and standard deviation of SPEI. Very severe drought was defined as greater than two standard deviations from the global mean (SPEI ⩽ −1.02); severe drought as between one and two standard deviations from the mean (−1.02 < SPEI ⩽ −0.46); moderate drought as between one standard deviation from the mean and the mean (−0.46 < SPEI ⩽ 0.10); and normal conditions as greater than or equal to the mean (SPEI > 0.10).
Within each of these drought subsets we then fit a series of models wherein the dependent variable in these models was either yield (Mg ha−1), yield anomaly, or loss cost. Independent variables across all models included soil organic matter, soil clay content, and soil H3O+ concentration. These variables were chosen by fitting a multivariate linear model with multiple potential independent variables then assessing variance inflation factors to eliminate spurious, highly collinear variables. We also included a random effect of state to account for possible impacts of geographic differences in management and production environment on model outcomes not accounted for in the data we collected. For yield and yield anomaly, linear mixed effects models including all possible interaction effects were fit using a restricted maximum likelihood approach in the lme4 (Bates et al 2020) package in R. For loss cost, a mixed effects Tobit regression model was fit using a Newton–Raphson maximization approach in the censReg (Henningsen 2020) package in R to account for the fact that loss cost was left censored at a value of 0. Prior to model fitting, all observations of each independent variable were standardized so that coefficient estimates would also be standardized. Data standardization was done by subtracting the mean of a given variable from each observation and then dividing that value by 2× the standard deviation of that variable (Gelman 2008).
Finally, we conducted a series of confirmatory path analyses to evaluate to what extent the impacts of soil organic matter on maize yields were mediated by their impacts on soil available water capacity and cation exchange capacity, a proxy variable for soil fertility, under both drought and normal conditions. First, we split data into those observations from normal SPEI years (SPEI > 0.10) and drought SPEI years (SPEI ⩽ 0.10), and then calculated the mean yield (Mg ha−1) for each county under either set of conditions. We then employed a piecewise structural equation modeling approach using the piecewiseSEM (Lefcheck et al 2019) package in R to fit models in which the effects of soil organic matter were either partially mediated or fully mediated by its effects on available water capacity and cation exchange capacity. Briefly, the fully mediated SEM was such that available water capacity and cation exchange capacity were modeled as functions of soil organic matter and yield was modeled as a function of available water capacity and cation exchange capacity. Whereas, in the partially mediated SEM, available water capacity and cation exchange capacity were modeled the same way, but soil organic matter was included as an additional independent variable for modeling yield. To determine the most parsimonious model, we compared models via an analysis of variance and on the basis of AIC/BIC scores. Coefficients were extracted from the final model and standardized to then assess whether or not effects of organic matter on yields under drought were mediated by its impacts on available water capacity and cation exchange capacity. An initial analysis with all data in either SPEI category indicated a negative relationship between cation exchange capacity and yields. When we manually inspected data we found that this result was the consequence of outlying cation exchange capacity values, defined as being two standard deviations greater than the mean (CEC ⩾ 31.9), with extremely high clay content. As such, we removed these outliers for the final path analysis to better estimate effects on typical soils, but include results from a path analysis including these observations in supplementary information.
3. Results and discussion
3.1. Maize yields and yield anomalies
We found that across all county-years and possible weather conditions, soil organic matter content was a strong positive predictor of yield. Soil organic matter had a standardized marginal effect of 0.83 with a standard error of 0.04, meaning an increase of 1% soil organic matter was associated with an increase in yields of 0.83 ± 0.04 Mg ha−1. This observed relationship between soil organic matter and yield is consistent with other studies which show yield increases are associated with higher levels of soil organic matter (Oldfield et al 2019). Our analysis extends these observations by showing that as drought conditions became more severe, the marginal effect of soil organic matter on yields increased (figure 1; table 1). For example, under moderate drought conditions (−0.46 ⩽ SPEI < 0.12) an increase of 1% soil organic matter was associated with an increase in yields of 0.76 ± 0.07 Mg ha−1, and under very severe drought conditions (SPEI < −1.02) a 2.2 ± 0.33 Mg ha−1 increase. Interaction effects of other soil properties with soil organic matter also emerged across the severe, moderate, and normal drought categories (table 1). Sensitivity analyses of these interaction effects revealed that in many cases outlying observations were responsible for the interaction. When those outliers were removed, the size and significance of interaction effects and corresponding main effects were diminished (supplementary information (available online at stacks.iop.org/ERL/16/044018/mmedia)). However, interaction effects of soil organic matter and clay content were robust to outlier observations and indicated that the effect of soil organic matter on yields remained positive at higher levels of clay but was diminished relative to lower clay soils. This result is consistent with broad-scale studies which demonstrate the primary importance of clay on the water holding capacity of soils and the diminished impact of organic matter when clay is high (Libohova et al 2018, Minasny and McBratney 2018). Nonetheless, our results show the effect of soil organic matter is still positive, regardless of clay content, and improves maize yields, and that soil organic matter was the only soil property that consistently buffered yields against drought conditions.
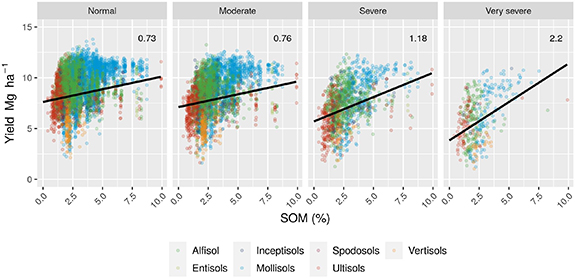
Figure 1. Maize yields increase with soil organic matter content (%), with the effect becoming more pronounced with increasing drought severity. Drought levels are based on the following ranges of SPEI: Very severe < −0.99; Severe ⩾ −0.99 < −0.44; Moderate ⩾ −0.44 < 0.12; Normal ⩾ 0.12. Numbers on each panel represent the marginal effect of soil organic matter for the corresponding drought level and trendlines represent predicted yields based on that marginal effect.
Download figure:
Standard image High-resolution imageTable 1. Results of linear mixed effects models across multiple levels of drought severity relating yield (Mg ha−1) to soil organic matter (SOM, %), clay (%), and H3O+ concentration (mol). Coefficients for terms are standardized. Sample numbers for each drought level are as follows: Very severe, n = 410; Severe, n = 1537; Moderate, n = 3998; Normal, n = 6431. Conditional coefficient of determination for each model is as follows: Very severe, R2 = 0.53; Severe, R2 = 0.45; Moderate, R2 = 0.51; Normal, R2 = 0.59.
| Drought | Term | Coefficient | Std. error | p |
|---|---|---|---|---|
| Very severe | SOM | 2.1976 | 0.3339 | <0.0001 |
| Clay | 0.4999 | 0.3355 | 0.1371 | |
| H3O+ | 0.5665 | 0.6013 | 0.3467 | |
| SOM:Clay | 0.6549 | 0.6312 | 0.3001 | |
| SOM:H3O+ | 0.0426 | 0.9302 | 0.9635 | |
| Clay:H3O+ | 1.0140 | 0.9089 | 0.2653 | |
| SOM:Clay:H3O+ | 0.9120 | 1.6866 | 0.5890 | |
| Severe | SOM | 1.1820 | 0.1270 | <0.0001 |
| Clay | −0.1776 | 0.1340 | 0.1852 | |
| H3O+ | −0.3637 | 0.1716 | 0.0342 | |
| SOM:Clay | 0.8457 | 0.2340 | 0.0003 | |
| SOM:H3O+ | −0.5317 | 0.2429 | 0.0288 | |
| Clay:H3O+ | −0.0274 | 0.2900 | 0.9249 | |
| SOM:Clay:H3O+ | −1.6099 | 0.5223 | 0.0021 | |
| Moderate | SOM | 0.7616 | 0.0687 | <0.0001 |
| Clay | 0.3132 | 0.0718 | <0.0001 | |
| H3O+ | −0.3794 | 0.0949 | 0.0001 | |
| SOM:Clay | 0.6793 | 0.1189 | <0.0001 | |
| SOM:H3O+ | −0.2837 | 0.1264 | 0.0249 | |
| Clay:H3O+ | −0.2869 | 0.1549 | 0.0640 | |
| SOM:Clay:H3O+ | −0.5372 | 0.2941 | 0.0678 | |
| Normal | SOM | 0.7266 | 0.0514 | <0.0001 |
| Clay | 0.2085 | 0.0577 | 0.0003 | |
| H3O+ | −0.5189 | 0.0856 | <0.0001 | |
| SOM:Clay | 0.5992 | 0.0985 | <0.0001 | |
| SOM:H3O+ | −0.1456 | 0.1219 | 0.2322 | |
| Clay:H3O+ | −0.2103 | 0.1445 | 0.1456 | |
| SOM:Clay:H3O+ | 0.1430 | 0.2600 | 0.5822 |
To more fully evaluate whether this greater relative yield advantage under drought is because soil organic matter protects against drought-induced yield losses, we also evaluated the relationship between soil organic matter and annual yield anomaly, the ratio of observed yield to expected yield estimated from long-term trends (Lu et al 2017). Under very severe drought conditions (SPEI < −1.01) an increase of 1% soil organic matter content was associated with a mitigation of yield losses of 12 ± 0.03%, under severe drought conditions (−1.01 ⩽ SPEI < −0.46) this effect decreased to a 5 ± 0.01% mitigation, and under moderate drought (−0.46 ⩽ SPEI < 0.10) the effect was non-significant (table S2).
Further examination of yield anomaly data revealed that counties with lower soil organic matter content have high interannual variability, outperforming historical yield trends in favorable conditions but experiencing greater losses relative to historical trends under adverse conditions. Whereas counties with high soil organic matter have low interannual variability and consistently yield near expected yields based on historical trends, even under adverse drought conditions. For example, in counties with greater than 2.5% soil organic matter content, the mean of soil organic matter content across all counties in this study, the interquartile range for yield anomalies was 98%–107% of expected yield under normal conditions and 91%–104% under all drought conditions. By contrast, counties with lower than 2.5% soil organic matter ranged from 99% to 114% of expected yield under normal conditions and 82%–104% under all drought conditions. This pattern is consistent with previous studies demonstrating that higher soil carbon is associated with lower long-term interannual yield variability (Pan et al 2009, Williams et al 2016). Our findings offer additional insight by demonstrating that those reductions in interannual variability are partly explained by the association of higher soil organic matter and lower yield losses under drought conditions.
3.2. Crop insurance
Given the decrease in yield risk associated with greater levels of soil organic matter, we expected that lower yield risk would be reflected in crop insurance payouts to farmers. Specifically, we expected that counties with higher soil organic matter would have lower loss cost (Reyes and Elias 2019), a metric based on the ratio of total indemnities to total liabilities. Our results support this expectation, showing that soil organic matter is associated with reduced loss cost under drought conditions and that the marginal effect of soil organic matter increases as drought severity increases (figure 2). Under very severe drought conditions (SPEI ⩽ −1.02), an increase in soil organic matter of 1% was associated with a 36 ± 4.76% reduction in loss cost (table S3). Similar to yield anomaly, though, this effect decreases sharply as SPEI approaches normal. Soil organic matter was associated with an 8.4 ± 1.41% reduction in loss cost under severe drought conditions (−1.02 < SPEI ⩽ −0.46) and just a 4 ± 0.73% reduction under moderate drought (−0.46 < SPEI ⩽ 0.10). Nevertheless, given the expectation of increasing frequency of severe droughts (Adams et al 1990, Meehl et al 2007, Hayhoe et al 2010), our results suggest that it would be strategic for rain-fed US agriculture to directly incorporate differences in soil properties into policy and insurance planning for yield resilience.
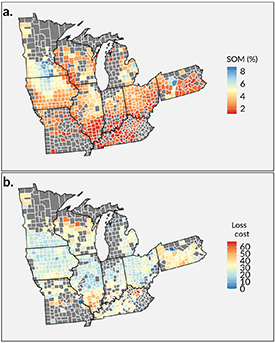
Figure 2. Higher levels of soil organic matter were associated with lower loss cost, the unitless ratio of crop insurance indemnities to liabilities, under drought conditions. Figure 2(a) is a map of mean soil organic matter content across counties (n = 730) within a subset of states (PA, WI, MI, MN, IL, IN, IA, OH, MO, and KY) included in this study. Figure 2(b) is a map of mean loss cost under all drought conditions in those same counties. The marginal effect of soil organic matter on loss cost under all drought conditions is −6.47 (σ = 0.84, p < 0.001).
Download figure:
Standard image High-resolution image3.3. Path analyses
The fact that we found that soil organic matter appeared to impart such effective protection against yield losses under severe drought appears inconsistent with results from recent studies using large soil databases into how soil organic matter influences the plant available water capacity in soils. Briefly, the ability of soils to provide water to plants is often estimated as 'available water capacity', which typically is the difference in water content of saturated soil samples dried on pressure plates at −1500 kPa and −33 kPa (Soil Survey Staff 2015, Cassel and Nielsen 2018). These analyses have suggested that the net impact of soil organic matter on available water capacity is relatively modest and contingent on soil texture (Libohova et al 2018, Minasny and McBratney 2018). To investigate potential discrepancies in conclusions between these past studies and our work, we performed a series of confirmatory path analyses (Shipley 2009, Lefcheck 2019) to investigate the extent to which soil organic matter associations with yields under drought and non-drought conditions are related to its influence on available water capacity and cation exchange capacity, used here as a proxy measure of soil fertility. We found that soil organic matter was strongly associated with cation exchange capacity but only weakly associated with available water capacity, and under both drought and non-drought conditions, cation exchange capacity and available water capacity were positively associated with yields (figure 3). However, our confirmatory path analysis also suggested that soil organic matter had an independent, unmediated positive effect on yields under both drought and non-drought conditions (table S4).

Figure 3. Increases in yield under drought associated with increasing soil organic matter appear only partially mediated by increases to soil available water capacity induced by higher soil organic matter. Figure 3 is a diagram of a structural equation model of best fit developed during a series of confirmatory pathway analyses. Numbers on each arrow represent standardized coefficients of the relationship between the variables connected, and the direction of arrows indicate variable dependence. Solid lines indicate statistically significant (p ⩽ 0.05) relationships and dotted lines indicate non-significant relationships.
Download figure:
Standard image High-resolution image
These results confirm that soil organic matter has a positive influence on yields via its effects on available water capacity and soil fertility. But it also suggests that soil organic matter likely influences plant water availability and soil fertility in ways not captured by how those properties are commonly measured. Although our analyses cannot resolve these additional influences, we do know that soil organic matter affects other important soil biophysical properties, such as porosity, bulk density, and water infiltration (Boyle et al 1989, Franzluebbers 2002, Lado et al 2004, Libohova et al 2018). Favorable changes in all of these properties may increase the soil volume from which plants can draw water and may effectively increase the supply of water to plants between rain events. In addition, soil organic matter is also an important source of key nutrients for plant growth. Under drought conditions, water transpiration and radiation efficiency in maize plants increase with increasing nitrogen fertilizer use (Teixeira et al 2014) and nitrogen fertilizer can be important for maintaining key metabolic functions and increasing yield (Zhang et al 2007). Further work is required to ascertain whether soil organic matter has similar, nutrient-mediated effects under drought conditions.
3.4. Broader implications
Our analyses are based on subcontinental-scale variation in soil organic matter and yield outcomes. As such, they cannot be used to argue directly that field-scale increases in soil organic matter achieved through conservation agricultural practices such as cover-cropping or reduced tillage, will lead to the same level of meaningful yield protection under drought. More specifically, the demonstrated increases in soil organic matter such practices often achieve is smaller than the relative range of soil organic matter content represented in this study, and the magnitude of the effect of a soil organic matter demonstrated here may not be maintained at the field scale. Similarly, our results are specific to the 'corn belt' region of the US and we only examined the impact of soil organic matter under drought on maize. Much of this region comprises relatively high organic matter soils, and maize is a drought sensitive crop. Last, our results likely mask substantial variation in management practices (i.e. fertilizer regimes, tillage, cover crops, etc) that could also impart resilience on rain-fed maize systems. Additional farm-scale evidence is required to understand whether increases in soil organic matter over time are associated with resilience to drought conditions at the farm scale, whether or not management practices can impart similar resilience, and whether or not these results are generalizable to other geographies, agro-ecological zones, and crops.
Nevertheless, our results do appear to have the potential to directly inform agricultural financing programs and policy in the US. At present, knowledge of risk is incorporated into US Federal Crop Insurance Programs (FCIP) only indirectly. Premiums are based on the Actual Production History (APH) of a given area and farm, and current policy dictates that APH be calculated based on a 10 year trend excluding years in which yield losses were extreme (Bryant and O'Connor 2017). While differences in soil organic matter and other biophysical limitations to resilience are arguably endogenous to these yield data, APH may become less predictive of risk under future climate scenarios where drought frequency is predicted to increase. It may therefore be more strategic for policy planning for agricultural resilience to explicitly consider differences in soil properties, such as organic matter levels, across counties. For instance, if maize yields in counties with low soil organic matter are particularly vulnerable to drought, it may make more sense to incentivize a transition to crops that are more appropriate to soil and predicted climate conditions in those counties, than to focus exclusively on economic protection through insurance.
Furthermore, while more extensive evidence is needed to understand if the trends we identified at the aggregate-level scale down to the farm, we argue that our findings generally support the notion that large-scale efforts to restore soil organic matter levels at regional/continental scales should improve the resilience of agricultural systems. Such a notion is key to soil health initiatives aimed at increasing agricultural resilience by rebuilding soil organic matter (Bradford et al 2019) and initiatives such as 4 ‰ that argue the co-benefits of increased soil organic matter are an important additional incentive to advancing soil carbon sequestration (Lal 2016, Chenu et al 2019).
4. Conclusions
Our analyses demonstrate that counties with higher mean soil organic matter content are associated with lower maize yield loss due to drought, that this relationship is strongest under severe drought conditions, and this increased yield protection translates to lower crop insurance payouts under drought conditions. Furthermore, we demonstrate that these impacts are not solely mediated through the impact of soil organic matter on conventional measures of plant available water, but likely occur through additional pathways that influence soil water supply and use by plants, which appear to collectively provide the yield protection benefits we document here. At least at the county level then for US rain-fed maize agriculture, soil organic matter content appears to be an important predictor of resilience to the type of drought conditions that are likely to occur more frequently under future climate scenarios. Further work should investigate whether similar benefits of soil organic matter for yield protection are afforded by agricultural managements that build organic matter in agricultural soils worldwide. In the interim, our analyses highlight the potential value of integrating soil information into resilience planning as agricultural outcomes become more uncertain with the increasing incidence and severity of extreme weather events.
Acknowledgments
This research was conducted as part of the Managing Soil Carbon working group with the Science For Nature and People Partnership. DK was supported by a Yale School of the Environment Fellowship, and a 2017 Soil Health Institute Literature Review grant from the Soil Health Institute was important in supporting early work that led to the development of this article.
Data availability statement
The data that support the findings of this study are openly available at the following URL/DOI: https://doi.org/10.5063/F1M61HN6.
Author contributions
D K, E F, and S W conceived the original project idea. D K and E F developed initial datasets and data processing code. D K and S W developed and verified the analytical methods. All authors contributed to analysis and interpretation of results and development of the final manuscript.