

Abstract
Tackling climate change and human development challenges will require major global investments in renewable energy systems, including possibly into large hydropower. Despite well-known impacts of hydropower dams, most renewable energy assessments neither account for externalities of hydropower nor evaluate possible strategic alternatives. Here we demonstrate how integrating energy systems modeling and strategic hydropower planning can resolve conflicts between renewable energy and dam impacts on rivers. We apply these tools to Myanmar, whose rivers are the last free-flowing rivers of Asia, and where business-as-usual (BAU) plans call for up to 40 GW of new hydropower. We present alternative energy futures that rely more on scalable wind and solar, and less on hydropower (6.7–10.3 GW) than the BAU. Reduced reliance on hydropower allows us to use river basin models to strategically design dam portfolios for minimized impact. Thus, our alternative futures result in greatly reduced impacts on rivers in terms of sediment trapping and habitat fragmentation, and result in lower system costs ($8.4 billion compared to $11.7 billion for the BAU). Our results highlight specific opportunities for Myanmar but also demonstrate global techno-ecological synergies between climate action, equitable human development and conservation of riparian ecosystems and livelihoods.
Export citation and abstract BibTeX RIS
1. Introduction
Low-carbon and renewable energy generation will need to increase up to five-fold globally by 2050 to meet climate and sustainable development goals [1]. This increase in renewables is often assumed to include a 50% expansion in hydropower nameplate capacity, fueling a future boom in hydropower dam construction [2]. Given the environmental externalities of dams, such a major expansion of hydropower would hence lead to severe impacts on global river ecosystems [3–5], and riparian [6, 7] and coastal [8] livelihoods.
Rapidly declining prices of wind, solar, and energy storage now make non-hydro renewables (NHRs) cost-competitive alternatives to large hydropower [9–11]. Together with existing energy assets and dams that are strategically placed for low impact, NHRs could promote equitable energy systems with broad socio-economic and climate benefits [12, 13] that avoid environmental impacts of large dams. Yet, while NHRs could make specific dams obsolete [14], few studies have explored the potential to systematically replace high-impact dams with NHRs [10, 15].
Addressing this research and policy gap requires integrating river basin and energy planning, covering both entire river basins and national or regional energy systems. One key challenge with such an approach is that energy expansion models do not commonly provide detailed environmental impact assessments for energy assets [16]. Thus, results of energy expansion models show optimal solutions to meet energy needs at low costs [17] but they typically lack data and approaches to represent negative social and environmental externalities of energy generation. As a result, energy system models alone cannot make strategic selections between different available energy generators that minimize costs as well as environmental externalities.
On the environmental impact side, such strategic planning is crucial for minimizing dam impacts on rivers and to determine river-specific limits for low-impact hydropower [18–21]. However, to date, implementations of strategic hydropower planning [19–21] have rarely studied the energetic and economic systems implications [10] to evaluate if proposed least-impact dam portfolios are economically feasible and meet societal goals.
To close that gap, we herein propose a high-level framework to screen renewable energy futures that provide reliable and least cost electricity while minimizing cumulative impacts on rivers. We develop and demonstrate that framework for Myanmar, which has both rapid economic growth, rampant energy shortages, rivers that stand out globally for their conservation value [4], and a great undeveloped potential for both hydropower [22] and NHRs [13, 23–25].
We propose energy systems that would allow Myanmar to achieve least impacts on rivers while providing reliable, affordable, and low-carbon energy for domestic use and export. We first use a capacity expansion model to simulate different futures for Myanmar's electricity generation. We then determine dam portfolios, i.e. groups of prospective dams, that can meet the hydropower demand for each future with least impact on Myanmar's great rivers, the Salween and Irrawaddy. We measure cumulative dam impacts in terms of sediment continuity and river fragmentation. We select sediment continuity as an objective for two reasons. First, the well-documented cumulative impacts of multiple hydropower dams [26] on sediment can be only minimized by network-scale planning [19, 20], highlighting the need to adopt a strategic large-scale perspective on hydropower impacts. Second, sediment drives ecosystem functions along Myanmar's rivers and coasts and is of major importance for livelihoods in the country [27–29]. We also analyze river fragmentation [30] as a proxy for additional dam impacts, e.g. on biodiversity and fisheries [3, 31].
Our results demonstrate opportunities to meet Myanmar's energy needs with much less impacts on rivers, livelihoods, and climate than the 'business as usual' plans. For Myanmar, we developed a framework which is informed by freely available geospatial and economic data, enabling similar screening analysis in other data-scarce settings with a large hydropower potential (e.g. the Amazon, Congo, Mekong, or in the Balkans) [2, 5]. The proposed approach can be readily expanded to involve additional environmental objectives and energy policy scenarios and results for Myanmar highlight global opportunities for combined river basin and energy planning.
2. Case study
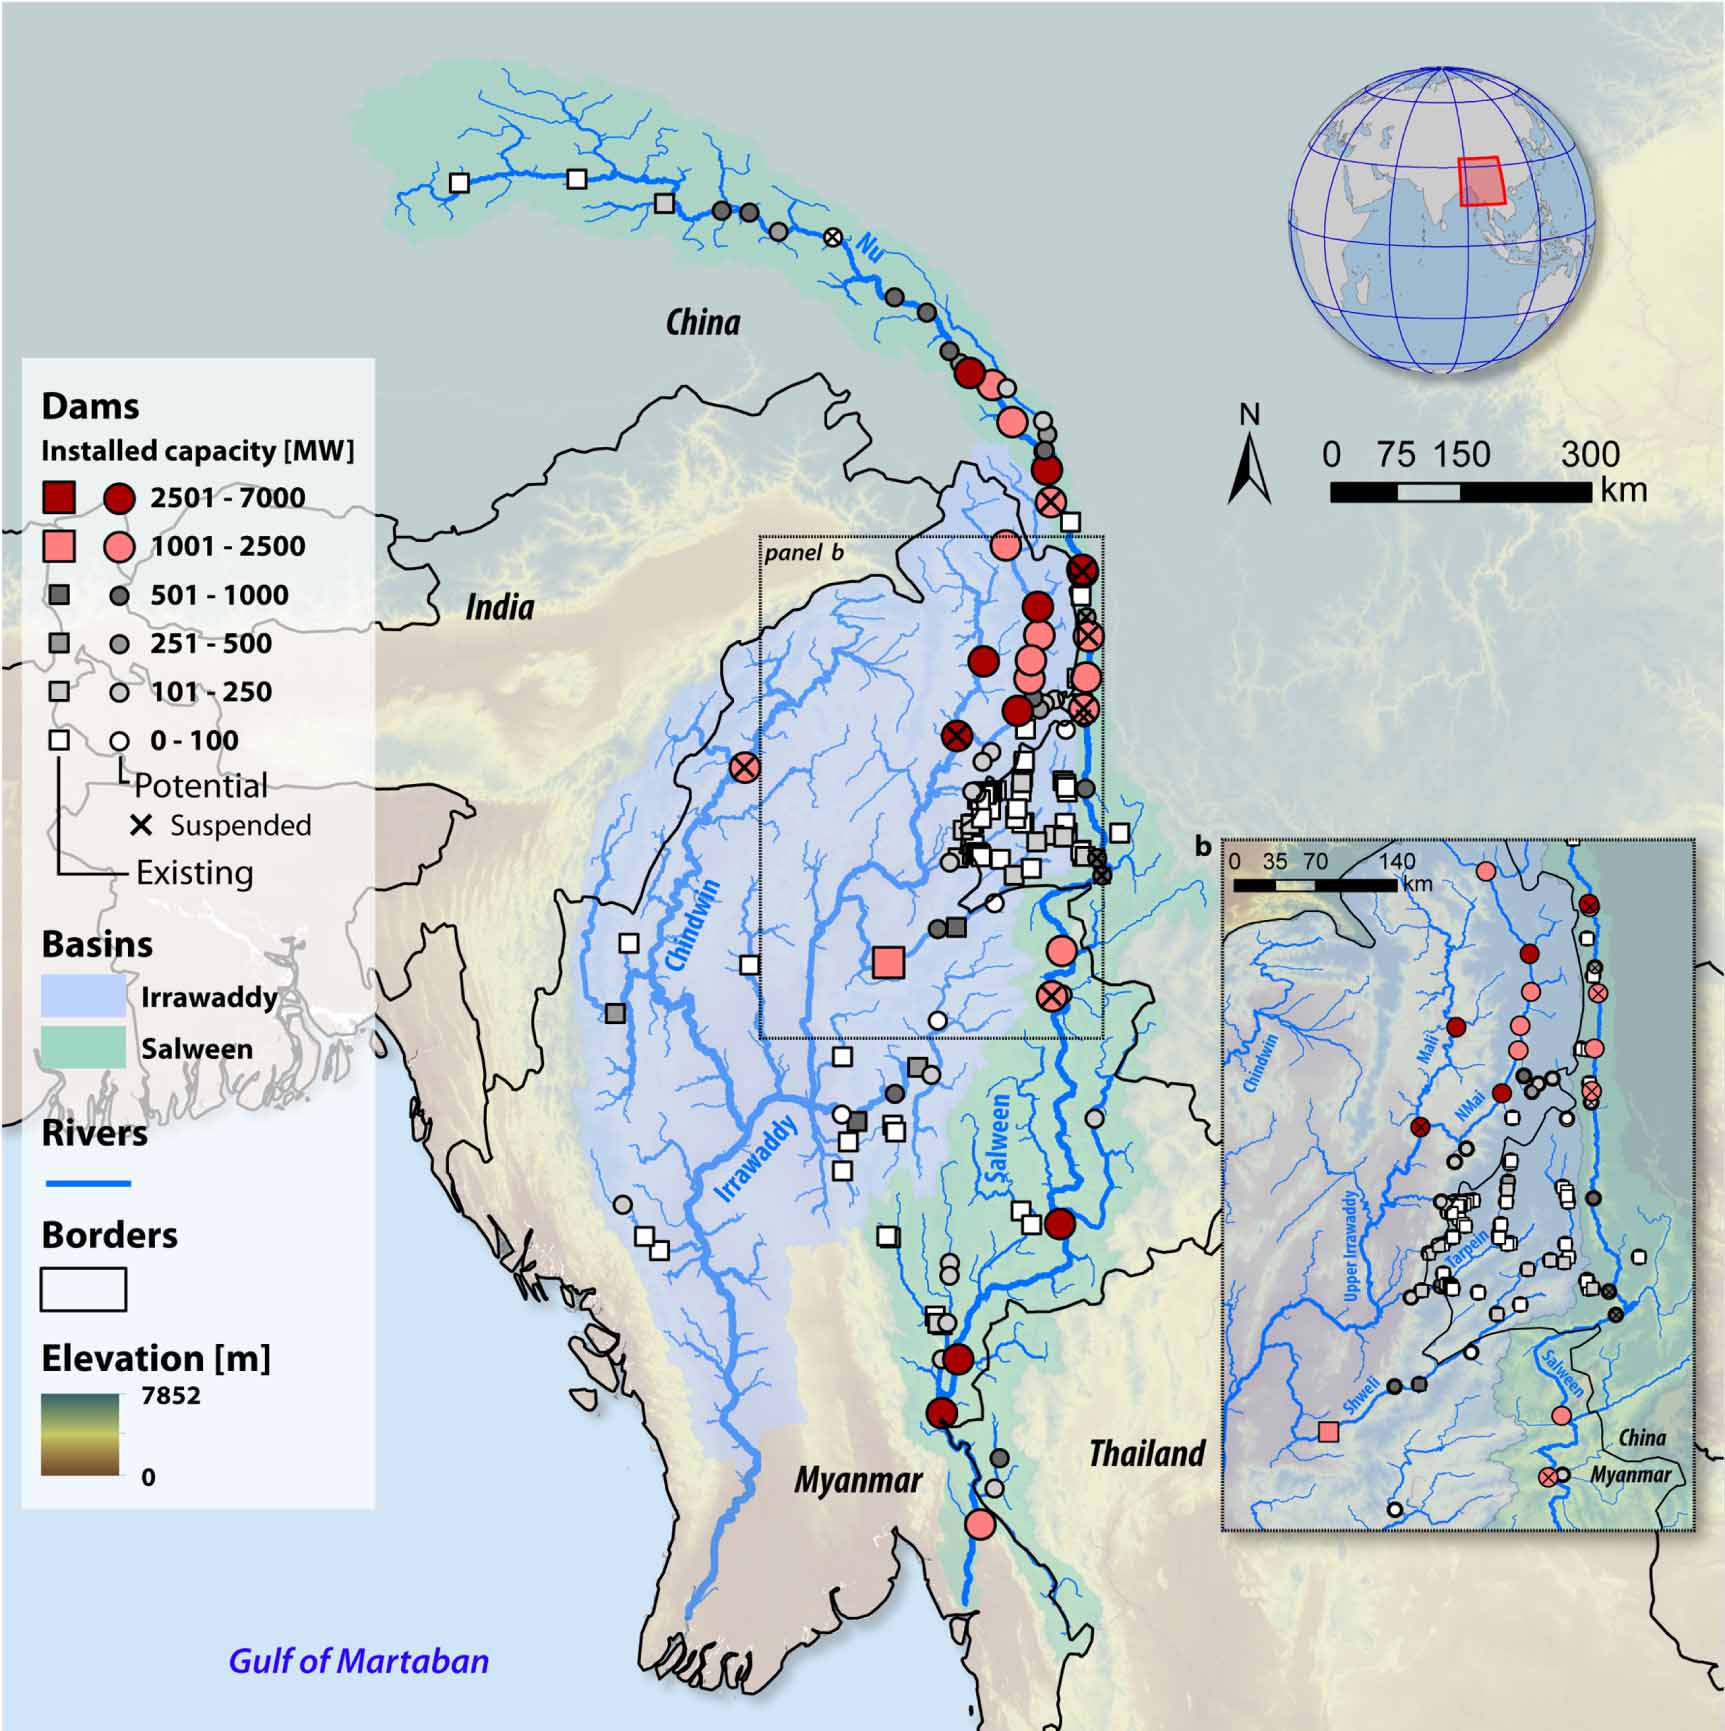
We focus on Salween and Irrawaddy River systems, two major South East Asian rivers (figure 1), which drain most of Myanmar's territory. These rivers are mostly unimpacted by human activities [3, 4] and of great value for conservation and traditional river-dependent livelihoods. At the same time, both rivers offer a combined potential 90 355 MW of hydropower, of which only a small fraction is commissioned currently (table 1) [22].

Figure 1. Future dams in the Salween and Irrawaddy would greatly impact so far little impacted rivers. Most of the existing dams (squares) are small and mostly located on smaller tributaries. In contrast, very large dams (red circles) are proposed on the mainstem of the Salween and on important tributaries of the Irrawaddy (a). Both rivers are so far mostly unimpeded by dams, making them unique amongst most subtropical rivers and especially rivers in the region that have been heavily dammed (e.g. Yangtze, Mekong). (b) Zoom into a hotspot region of future dams, the upper Irrawaddy and its tributaries. Red colors mark dam sites with more than 1000 MW capacity. Small crosses mark dams that are classified as cancelled or suspended in our database. Note that also most large dams in the Chinese part of the Salween, the Nu River, are now cancelled [32].
Download figure:
Standard image High-resolution imageTable 1. The Salween and Irrawaddy basin hold the potential for more than a ten-fold expansion in installed hydropower, most of which in Myanmar. Existing and possible future hydropower potential in the Salween and Irrawaddy Rivers [22] are herein evaluated by basin and country. Nearly all potential dam sites are in China and Myanmar. There are some dams in Thailand, thus numbers are slightly higher for the per-basin than for the per-country evaluation. We classified candidate dam sites with a projected commissioning year as 'near future' and sites without such a date as 'potential'.
| Installed capacity (MW) | |||||
|---|---|---|---|---|---|
| Country/basin | All sites | Commissioned | Near future | Potential | Suspended |
| Myanmar | 52 985 | 4170 | 32 624 | 7791 | 8400 |
| China | 36 338 | 3824 | 4797 | 17 937 | 9780 |
| Total | 89 323 | 7994 | 37 421 | 25 728 | 18 180 |
| Irrawaddy | 33 691 | 7105 | 17 995 | 1391 | 7200 |
| Salween | 56 664 | 889 | 19 426 | 25 369 | 10 980 |
| Total | 90 355 | 7994 | 37 421 | 26 760 | 18 180 |
That hydropower potential is split between Myanmar (52 985 MW) and China (36 338 MW). Of 90 355 MW total potential, less than 10% (7994 MW) is already built, roughly split between China and Myanmar, and mostly clustered in tributaries in the eastern Irrawaddy basin (figure 1). Sixty percent of the remaining capacity is in Myanmar, with most potential dam sites in the Irrawaddy, clustered in the north-eastern part of the basin. Potential projects in the Salween basin include very large mainstem dams, with five major projects alone accounting for 21 265 MW, one fourth of the total remaining potential in the two basins. China's remaining potential is mostly in the upper Salween River (Nu River in China), but hydropower development on the Nu River has been suspended [32].
3. Methods
3.1. Energy planning model
We developed and utilized a screening model for capacity expansion. The model explores pathways to expand electricity investments while optimizing costs, resulting in different energy futures for Myanmar [33]. We use the energy plans proposed in JICA's (Japan International Cooperation Agency) 'Myanmar Power Development Plan' [34] as a baseline, as it is the latest country-wide energy masterplan. Our model then assumes different electricity demand projections and generates viable pathways to meet different estimates of future energy demand with different technology mixes. The model is lumped, representing the country as a single load zone. This could be a limitation in settings where different load zones with different demand and supply profiles are present in a country. Because of its lumped nature, the model can also not account for the different spatial distribution of energy sources, demand centers, and existing transmission infrastructure. However, Myanmar can be considered a single load zone given its highly centralized transmission network (supplemental figure 8 which is available online at stacks.iop.org/ERL/16/054054/mmedia), and we account for the different spatial aspects using detailed auxiliary geospatial analyses (supplemental methods 3–5, supplemental results 3, supplemental figures 8–10).
Variable costs and benefits, e.g. electricity tariffs in Myanmar and international fuel prices, are included in the optimization of a least-cost generation mix. We assume average capacity factors for each generation technology. Similar to other nation-wide energy models [35], derivation of those data is based on a review of either Myanmar-specific or regional studies (supplemental tables 1 and 2). The capacity factors represent the maximum number of hours in a year that a particular technology can run, divided by the total number of hours in a year (8760), thus accounting for intermittency of wind and solar (supplemental table 1). A peak contribution factor further limits the contribution of wind and solar during pre-defined peak load hours, thus accounting for a possible mismatch between hours of peak renewable generation and hours of peak demand [33] (supplemental table 1). The model then makes year-by-year investment decisions that minimize the costs for expanding electricity generation while matching the projected demand for each year. The model also determines the dispatching (i.e. the actual generation) from each technology in each year.
Investment decisions are made based on cost considerations. The least-cost generation mix is determined by a linear optimization (parameters are defined in supplemental tables 3 and 4, parameter values in supplemental tables 1 and 2):
With:
Subject to:

The inputs for each generation technology include lifetime (years), initial capital cost ($2019/kW), fixed operation and maintenance cost (O&M) ($2019/kW), variable O&M cost ($2019/kWh), carbon emissions (tCO2/MWh), fuel costs ($2019/MWh), initial efficiency (%), capacity factor (%) and electricity tariff ($2019/kWh).
To derive realistic costs, we obtained cost estimates for planned and existing power plant projects in the region where available. Where such data were not available, we derived estimates from peer-reviewed regional and global case studies. By using learning rates for electricity generation technologies, we account for future cost declines and economies of scale (supplemental table 2). We apply a conservative range of capital cost but assume that solar PV, small-scale hydropower, and wind generator costs decrease according to technological learning rates from literature estimates [36].
The optimization framework determines the final energy mix for each scenario based on a set of constraints or preconditions (e.g. for the business-as-usual case, the planned hydropower and thermal capacity in the JICA [34] plan is assumed to be built). Finally, the model produces estimates of how much electricity from which source must go online each year to match demand, thus resulting in 'futures' with different mixes of energy generation. Our futures extend to the year 2030 to match the planning horizon in the JICA [34] and the National Energy Master Plan [35]. Based on the capacity factors, the model also determines how much electricity each technology generates (in GWh yr−1) each year.
For hydropower, the model determines how many GW of hydropower must be installed each year and how much total installed hydropower is required by 2030, i.e.  (hydropower demand by 2030) described in the following section. However, the energy system model neither prescribes which dams to build to meet the hydropower demand nor considers the cumulative impacts of the resulting hydropower portfolio.
Using this model, we developed two alternative electricity scenarios ('futures') based on the data on costs and availability of NHRs and different projections for domestic electricity demand and export opportunities. In contrast to the BAU, which is based on extrapolating the unusually high growth rates of the mid-2010s (up to 13% pa) [35], the first electricity future is based on more realistic but still high assumptions of demand growth (8% pa) ('Myanmar Domestic Demand', MDD), similar to growth rates proposed in the Asian Development Bank's 2015 'Myanmar Energy Master Plan' [35]. The third future aims to maximize export revenues and meet even most optimistic scenarios of demand growth [37] through a strong boost of installed transmission capacity and export opportunities ('Regional Export Opportunities', REO). Background information and assumptions for each future are provided in the supplemental materials (supplemental methods 3).
The energy model does not consider project-specific transmission costs. However, to compare transmission costs of NHR portfolios with those of hydropower, we propose a novel geospatial analysis to estimate technology-specific distance (and thus transmission costs) from the existing high voltage grid. For solar PV, we also perform a spatial optimization to estimate land demand for different scenarios, and compare results to previous estimates of Myanmar's potential for low-impact solar on already degraded land [23] (supplemental methods 4 and 5).
As an additional measure of costs and externalities, the model includes social costs of carbon, for which we assume emission factors of 0.8 kg CO2e/KWh for coal and 0.39 kg CO2e/KWh for natural gas [38]. We then multiply these values with the annual generation from each technology [KWh yr−1] for the year 2030 derived from the energy model, and social costs of carbon of 46 $/tCO2 [39].
3.2. Regional cost trajectories for different generation technologies
From reviewing data on costs and learning rates of alternative renewable energy in the region, we find that advances in natural gas, small-scale hydropower, solar photovoltaics, wind, and battery storage all can provide reliable electricity supply at lower cost than large-scale hydropower and coal [40], which dominate regional power development plans [34]. By 2020 the initial capital cost of solar PV dipped below $1000/kW. As a global average, costs for large hydropower plants (>100 MW installed capacity) were between $1200/KW and $1700/kW over the past decade with an increasing trend [41]. By reviewing price data for 130 dams in the Mekong Basin, we found an average capital cost of 2023 ± 640 $/KW for large dams (>100 MW) and 2700 ± 1700 $/KW for all dams [42]. Wind and photovoltaic solar are now less costly than large hydropower, with capital costs of around $1100/kW and $1500/kW [43]. NHRs are also likely to see major cost reduction [36], in contrast to hydropower.
3.3. Optimizing dam portfolios
We use a separate river system model to predict how sediment budgets and associated ecosystem functions would be impacted by dams in the Salween and Irrawaddy. We then couple these models to the BORG multi-objective evolutionary algorithm (MOEA) [44] to identify dam portfolios, i.e. combinations of the potential dam sites (figure 1), with optimal trade-offs between three energy and river health objectives. Of the objectives,  denotes the installed hydropower (MW),
  the sediment flux to the mouth of the Irrawaddy (Mt yr−1) and
 the sediment flux to the mouth of the Salween (Mt yr−1). The Borg MOEA then solves a decision problem of the form:
where u is a binary vector, consisting of  decision variables indicating if a dam site is selected as part of a portfolio (existing dams in China and Myanmar are included in all portfolios). The results are Pareto-optimal (PO) portfolios, each creating an optimal trade-off between the three objectives.
3.3.1. J1: Installed capacity
The installed capacity provided by portfolio  ,
,  [GWh yr−1] is calculated as sum of the tabulated installed capacity [22],
  , of all dams in portfolio
where  are all dam sites included in portfolio
  .
.
3.3.2. J2 and J3: sediment flux in the Irrawaddy and Salween
Sediment flux in the two rivers for each dam portfolio is determined using the CASCADE sediment routing model [20]. The spatial framework of the CASCADE model is defined by the river networks, which we derive from a 250 m DEM using a threshold of 500 km2 for channel initialization. The networks are represented as directed graphs, i.e. sets of nodes and edges. Each node is assigned a specific sediment supply rate, based on estimates of the spatial variability in sediment yield.
CASCADE tracks sediment along the flow path from its source to the river mouth. Each of these paths, referred to as a sediment cascade, represents the sediment transport from a specific sediment source through the river network and finally to the river mouth. Let  denote the most downstream node of each river network, i.e. the river mouth, then the total sediment delivery to
  is
is
where  is the set of all sediment cascades that are connected to
  , and
, and  is the sediment flux from source
  to the outlet of the river network.
Let  be a specific source node in the river network. Then,
  is the sediment flux from that source to the river outlet.
  is derived from spatially distributed estimates of sediment yield in the river basins as
where  is the sediment yield at the location of
  (t/km2/yr) and
  is the direct catchment area draining to
  . Estimates regarding sediment yields from the different sub-basins of the Irrawaddy and Salween are derived from geochemical sediment budgets [45] and estimates of total load from both rivers [46] (supplemental figure 1 and supplemental methods 1).
If one or multiple dams are built between a sediment source and  , the sediment flux is reduced according to the trap efficiencies,
  , of the dams. Assume that
  is the set of all dams for portfolio
  Then,
Then,  is the subset of dams located between sediment source
  and the river mouth
  for portfolio
  . The resulting modified sediment flux to the river mouth from source
  is
is
The modified sediment flux to the river mouth is finally calculated as the modified sediment flux from all sources for portfolio 
Trap efficiency is calculated using the Brown formula [47], for each dam  , where
 is the total storage (dead and live storage from tabulated data) of each dam [m3], and
  is the drainage area [km2] derived from flow accumulation on digital elevation model. For dams without information regarding storage we estimated the storage from the DEM [20]. To reduce dimensionality in the plots, we report combined sediment delivery,
  , from the Irrawaddy and Salween to the Gulf of Martaban. This is also justified as most of the sediment delivered by the Salween is redistributed by strong tidal currents and thus contributes, together with sediment from the Irrawaddy, to building shorelines and delta land in the Gulf of Martaban [48].
3.3.3. Selecting dam portfolios
Each dam portfolio generates a different level of hydropower. The selection of dam portfolios is based on the foreseen demand for hydropower under the different futures,  generated by the energy expansion model. We denote the hydropower demand for a specific future as
  . We then compare
  to all PO dam portfolios derived from the optimization (figure 2). It is unlikely that there is any dam portfolio
  for which the installed capacity,
  , is exactly equal to
  . There are various ways of matching
  and
and  , the simplest being to select the portfolio for which installed capacity is closest to
  . In reality, dam portfolios could be chosen not only according to their proximity to
  but also according to additional criteria not considered as objectives in the optimization, e.g. practicality of construction, proximity to existing grid transmission lines, or impacts on, e.g. fish migration or displacement of people.

Figure 2. Matching energy and river basin optimization to select specific dam portfolios.(a), among all PO portfolios ((a), white circles), portfolios can be selected initially based on their proximity to the hydropower demand for a specific future,  ,
,  is prescribed by the energy expansion model (a, grey circles). Amongst this initial selection a specific portfolio can be chosen based on different criteria or constraints (b)–(d). E.g. (b) with the least number of dam sites, (c) a generation most closely matching
  , (d) or the least number of dams on the mainstem rivers. (e) Analyzing the probability with which a dam site is included into the initial selection shown in (a) (or in subsets, such as (b), (c), or (d)) can indicate how relevant a specific dam site is for energy objectives. For this paper, we tried to select portfolios that are within a 10% range around
  while not reducing sediment delivery from either river by more than 50%.
Download figure:
Standard image High-resolution imageAll of the dam portfolios create Pareto optimal trade-offs between the three independent objectives. However, even Pareto optimal portfolios can be inequitable, in the sense that impacts may be concentrated in one river, an aspect that was less relevant in previous studies focusing on single basins [19, 20, 49]. To identify portfolios with a relatively equitable distribution of impacts between the Salween and Irrawaddy, we identified dam portfolios that would result in less than a 50% reduction in sediment transport on either river. For the portfolio selection we then select first all PO dam portfolios in a  10% range around
  . Of those candidate portfolios we then considered only those with less than 50% sediment trapping in either river. From those candidate portfolios we selected the portfolio with an installed capacity as close as possible to
  . If there was no portfolio with less than 50% trapping in the
  10% range, we selected the portfolio with
  closest to
  . For selecting a dam portfolio for the REO future we added a last step and preferred portfolios preferentially including dam sites from the MDD portfolio such that the MDD portfolio could be expanded into the REO portfolio at a future time if there should be increasing opportunities for energy export.
4. Results
4.1. Least-cost futures for Myanmar's energy sector
Compared to the BAU with its focus on large hydro (+38 800 MW) and fossil fuel (coal: +12 200 MW, natural gas: +1100 MW) (figure 3(a), top), the alternative energy futures rely on a wider mix of biomass, solar, wind as well as small and large hydro. The MDD future would require 9400 MW of solar and wind and 2300 MW of Biomass, complemented by 6700 MW of hydropower, very little coal and some natural gas (+285 and +1164 MW) (figure 3(a), center). For the REO future the energy model predicts a massive expansion of solar (+66 900 MW). Hydropower is expanding, too, but much less (10 300 MW) than under the BAU (figure 3(a), bottom). For all futures, year by year expansion and resulting generation mixes are shown in supplemental figures 5–7.

Figure 3. Large increase in installed hydropower, impacts on sediment budgets and unequitable distribution of impacts for the BAU, but not for the alternative energy futures. (a) Each of the bar charts shows the energy mix for a different energy future (top: Business as usual, BAU. Center: Myanmar domestic demand, MDD. Bottom: Regional export opportunities, REO). (b) Trade-offs between energy and sediment budget for PO dam portfolios (grey and white markers). Additional filtering highlights dam portfolios with less than 50% reduction in the sediment budget of either river and thus a more equitable distribution of impacts between the Salween and Irrawaddy (square markers). Colored lines indicate hydropower demand from the three energy futures. Colored markers indicate which portfolio was chosen for each future. Figure 5 shows the selected dam portfolio for each energy future. Supplemental figures 5–7 show the expansion in generation and incremental and total installed capacity year-by-year for each future until 2030.
Download figure:
Standard image High-resolution imageThe MDD and REO futures not only require less hydropower, but also yield cheaper energy thanks to their reliance on less-costly solar and wind sources. The cost estimate for the BAU pathway is $11.7 billion USD, with an average system cost of $40.4/MWh, over a 15 year time horizon, assuming the system would generate at least 289 TWh over that period. Unit costs would be higher if generation was lower, e.g. because optimistic assumptions about demand growth do not materialize. For the MDD future, the model results in lower-bound costs of $8.1 billion USD. By 2030, the average system cost of electricity in this scenario is $37.3/MWh if the system generates at least 216 TWh over a 15 year period. For the REO future, lower-bound costs are $8.4 billion USD, with average system cost of $38.4/MWh if the system generates at least 218 TWh over a 15 year period. Thus, energy costs for the BAU are 8%–9% higher than under the alternative futures. Moreover, the BAU would require 37% higher up-front capital investment than the MDD and REO futures, because the alternative futures can take advantage of more flexible investments over time and dropping prices for NHRs.
Costs for the BAU would further increase when considering externalities of rivers and global climate. Social costs of carbon would be $3.6 billion for the BAU ($3.4 billion from coal, $260 million from gas), and $385 million from the MDD and REO ($155 million from coal, $230 million from gas). This does not yet include greenhouse gas emissions from hydropower reservoirs, which can be substantial but would require a dam-by-dam assessment because of the great variation in relative emissions [50].
In terms of transmission, we find that Myanmar has significantly more solar than hydropower resources in close proximity to its highly centralized high voltage grid, thus indicating that solar PV has very likely a transmission cost advantage over hydropower. This is because most hydropower potential lies in more remote parts of the country while the best solar resources are in the center of the country, close to existing transmission lines and demand centers (supplemental results 3, supplemental figures 8 and 9).
4.2. Optimal dam portfolios to meet Myanmar's energy needs
The hydropower demand for each future could be matched by different dam portfolios, i.e. different sets of potential dam sites that provide a similar generation but that might vary widely in their cumulative impacts. Using the river basin models for the Salween and Irrawaddy, we identified many PO dam portfolios covering hydropower expansion from the current level to the full development of all hydropower resources (figure 3(b)). Being PO, each portfolio minimizes the trade-offs between installed hydropower and impacts on sediment budgets.
Each data-point in figure 3(b) thus indicates the trade-offs between dam impacts and benefits for a Pareto optimal dam portfolio. Square markers in figure 3(b) identify dam portfolios that meet the 50% threshold (i.e. not more than 50% reduction in the sediment budget of either river). The 50% threshold is only met for dam portfolios with installed capacity not exceeding 37 000 MW. Even with optimized dam portfolios, installing hydropower beyond that threshold would lead to major impacts on the Salween river (figure 4), because such portfolios require some major mainstem dams on the Salween. For instance, the portfolio selected to meet the BAU demand would reduce sediment flux from both rivers to around 300 Mt yr−1, around 50% reduction in combined sediment export from both rivers. However, most of that reduction would be in the Salween, where mainstem dams would reduce the sediment budget by more than >90% (figure 4(a)).
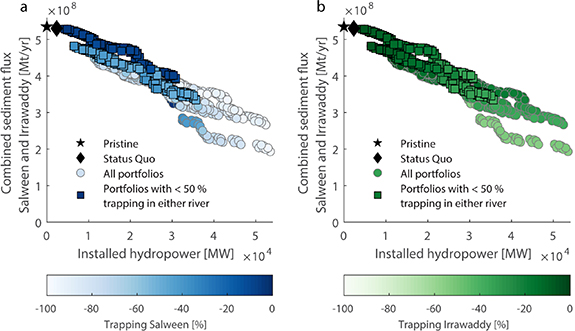
Figure 4. Energy plans with high demand for hydropower are incompatible with an equitable distribution of impacts between the Salween and Irrawaddy rivers. Sediment flux from both rivers is aggregated in a single measure (y-axis), while the sediment trapping rates in either river are reported by the blue (for the Salween in (a)) and green (for the Irrawaddy in (b)) colors. Lighter colors indicate more sediment trapping and thus less sediment delivery to the coast. Square markers identify portfolios with less than 50% sediment trapping in either river.
Download figure:
Standard image High-resolution imageThe worst performing PO portfolio meeting the BAU demand could reduce the total sediment budget to as little as 200 Mt yr−1, resulting from an around 80% reduction in sediment transport in the Salween (figure 4(a)) and 60% reduction in the Irrawaddy (figure 4(b)). The BAU future would also lead to a major reduction in river connectivity and associated impacts on biodiversity (supplemental figure 2). By contrast, the MDD and REO futures would maintain sediment transport above 500 and 450 Mt yr−1, respectively, and could match demand with dam portfolios that do not have disproportionate impacts on either river (figures 3(b) and 4). It should also be noted that dam development proceeds often in a non-strategic, project by project manner [20] and impacts of all futures on rivers could be much worse if dams where not chosen from the PO portfolios but just site-by-site. Thus, our estimates of impacts, even for the BAU future, can be regarded as best-case estimates.
Under the BAU future, even optimized dam portfolios include a significant number of mainstem dams (figure 5(a)), especially on the Salween. The MDD future omits all mainstem dams from the hydropower portfolio (figure 5(b)). Thus, the Salween and Irrawaddy remain free-flowing and hydropower demand is met from projects in tributaries and in already disconnected parts of the river network upstream of existing dams.

Figure 5. Dam portfolios for alternative energy futures allow foregoing most mainstem dams on the Salween and Irrawaddy. Dam portfolios for meeting hydropower demand for the business as usual (BAU, (a)), the Myanmar domestic demand (MDD, (b)) and regional export opportunities (REO, (c)) future. Each portfolio corresponds to one of the colored markers in figure 3. Red diamond markers indicate dams that are included in each dam portfolio in addition to existing dams (black circles). Grey square markers indicate dam sites which can be omitted in a given energy future. Larger markers indicate dam sites on mainstem rivers and large tributaries (drainage area > 40 000 km2).
Download figure:
Standard image High-resolution image
The MDD future also avoids most dams in politically unstable tribal areas in Northern Myanmar, where dam development might have repercussions on human rights [51] and where hydropower projects have led to armed conflict in the past [37] (figure 5(b)). Compared to the BAU, the MDD future assumes a more modest domestic growth and fewer energy exports. With that regard, the REO future provides opportunities to satisfy most optimistic future export opportunities and would allow Myanmar to play an important role for the decarbonization of the region.
Under the REO future, the portfolio from the MDD future would be expanded to include most dams in the hydropower cascades of the Nmai and Myitnge rivers (supplemental figure 1 for river locations) but most mainstem dams could still be avoided (figure 5). Supplemental figure 4 shows a probabilistic analysis of all dam portfolios in the  10% range around the prescribed hydropower demand (supplemental results 2). This analysis indicates that the presented dam portfolios are representative for the respective generation levels. For example, dam portfolios for the MDD and REO futures have a very low probability to ever include major mainstem dams, whereas mainstem dams have a high probability to be included in portfolios meeting the BAU demand.
Lastly, we note that we do not have project specific data on total or marginal transmission costs (i.e. in $ or $/MW) for each hydropower dam. However, our geospatial analyses shows that the dam portfolios selected for the MDD future would require less transmission length than the BAU (supplemental results 3, supplemental figures 10 and 11). In terms, of required transmission capacity (km times required transmission rating in MW) the MDD future has significantly lower requirements than the BAU future (supplemental figures 10 and 11). Thus, there is strong evidence that the MDD and REO future would likely incur lower transmission costs than the BAU, first because alternatives include more NHRs that are located closer to the existing transmission grid (supplemental figures 8 and 9), and second, because included dams are closer to the grid (supplemental figures 10 and 11).
5. Discussion
For decades, hydropower's scalability and generation costs were unmatched by NHRs. Hydropower impacts on rivers were hence a hard-to-mitigate externality for generating low-carbon energy. As we demonstrated here, this is unlikely to be the case for the future, as innovations in generation and storage of renewable electricity are disrupting the energy sector world-wide [9, 10, 15, 52] and specifically in Myanmar [13, 24, 35].
Developing Myanmar's full hydropower potential could devastate some of the world's least-impacted large rivers [4] and greatly impact livelihoods along Myanmar's rivers and coasts. While not as low-lying as the nearby Mekong Delta, the Irrawaddy Delta is vulnerable to massive storm surges. The surge following Cyclone Nargis in 2008 claimed 138 000 lives and caused 10 billion dollars in damage, making it one of the most deadly tropical cyclones in human history [53]. Myanmar's coastal populations thus depend on their rivers to continue building delta land against rising sea levels [29], especially as the nation's institutional capacity to address delta vulnerability through engineering or adaptation measures is low [54].
Strategic planning of dam portfolios alone can reduce conflicts in hydropower planning [19–21, 49] but NHRs are crucial to limit hydropower to within the carrying capacity of river ecosystems. For Myanmar, BAU hydropower development would greatly exceed the rivers' carrying capacity and benefits of strategic hydropower planning alone would be limited. Only increasing the planning domain from hydropower to the whole energy system enabled us to find dam portfolios with equitable trade-offs between hydropower impacts on the Salween and Irrawaddy, while still meeting anticipated energy demand. In turn, strategic assessments of dam impacts should be included in all renewable energy assessments that include hydropower. Even an energy system mostly based on NHRs can have high impacts if dam sites to meet remaining hydropower demand are not selected for low cumulative impacts.
A key finding is that Myanmar's renewable energy potential is sufficient to forego high-impact and controversial mainstem mega dams, including the controversial Myitsone project. We do not include a full resource and impact assessment of wind and solar PV, but the potential for low-impact solar PV alone has been estimated to be up to 685 TWh yr−1 [23] (more than six times our highest estimated demand, supplemental figure 7(c)). Much of the PV potential is in the central dry zone (supplemental figure 3), which has potentially less sensitive ecosystem values, and is closer to demand centers and existing transmission, than hotspots of hydropower potential (supplemental figures 8–10).
Available evidence also indicates that relying less on hydropower will also have multiple benefits for Myanmar's energy system. For example, overcoming dry-season blackouts is a priority in Myanmar. As solar PV peaks in the dry season, it could largely compensate for reduced hydropower capacity at that time of year [24, 35, 55]. Accordingly, intermittency of solar PV is not a major concern of stakeholders in Myanmar's energy sector [24, 55]. Challenges of intermittency and seasonality could be further reduced with an array of technologies, e.g. battery systems and pumped storage hydropower, for which Myanmar has a good potential with rather low costs [56].
Compared to hydropower, solar energy systems are also less vulnerable to climate and land use change [57, 58]. This vulnerability is particularly relevant, as climate change might increase variability in dry season discharges in Myanmar [59] and thus create challenges for hydropower in low-discharge, high-demand months. Together with major cost overruns documented for many large hydropower projects [60], these drivers of uncertainty and future economic risks seem to favor gradual development of smaller and decentralized energy projects over large investments in mega dams. Replacing thermal generators, and to a certain extend also hydropower, with solar, greatly reduces social costs of carbon associated to Myanmar's energy sector.
Our research was based on publicly available data, e.g. for sediment transport, dam projects, and transmission infrastructure. Thus, the proposed approach can be applied as a screening analysis to many river basins world-wide. It may be especially suited for lower-income countries, where future dams are in greatest conflict with riparian biodiversity and ecosystem services [3–5] and where data are typically scarce.
While our analyses are thus a first step towards a sustainable low-impact energy future, more detailed research is needed into Myanmar's energy options. This research should cover both the energy systems and ecosystem service perspective. For example, more detailed analysis of seasonal hydrologic and demand variability could highlight sub-annual challenges for Myanmar's energy system and how those might change under different trajectories of climate change and economic growth. Our energy futures are based on broad assumptions regarding socio-economic development and cost trajectories of different technologies. Of course, exact numbers might change, e.g. because of shifts in export opportunities or positive or negative economic shocks. However, we propose that the relative magnitude of demand for different technologies in each future and the relative ranking of energy and hydropower demand between futures is robust.
More detailed data and models on origins and transport of sediment in the Salween and Irrawaddy [61] and on coastal processes [62] would yield better insights into how individual dams would change sediment transport dynamics and how dams will cumulatively impact coastal processes and livelihoods. Including more detailed analysis of project-level solar PV potential [16] and its impacts, and including more impacts of dams on, e.g. fisheries, would enable more detailed and realistic trade-off analysis. However, such analyses will require concerted efforts by local stakeholders to collect data and to embrace national energy planning.
Our work demonstrates the value of a combined energy-system and hydropower analysis on a screening level. While none of the previous energy system plans [34, 35, 51] has been enacted in Myanmar, our results highlight remaining great opportunities to embark on a nation-wide energy planning process in the country, which could build on those previous attempts. Myanmar has a unique opportunity to operationalize such a process because most dam sites in the Salween and Irrawaddy are within its borders, a sharp contrast to challenges posed by international river basins, e.g. in the neighboring Mekong River [20].
Our findings highlight that Myanmar could become energy independent and even a major exporter of low carbon energy in South-East Asia without sacrificing some of the last free-flowing rivers of Asia. Thus, Myanmar could become a sentinel for strategic renewable energy planning which, if streamlined globally, could take emerging economies out of the dilemma of choosing among energy security, low carbon footprints, and maintaining riparian livelihoods and ecosystems.
Acknowledgments
D M K gratefully acknowledges support from the US National Science Foundation CyberSEES program (#1539585), and the NSF Innovations in Food, Energy & Water Systems program (DGE #1633740).
Data availability statement
The data that support the findings of this study are available upon reasonable request from the authors.