

Abstract
Climate teleconnections (CT) synchronize and influence weather features such as temperature, precipitation and, subsequently, drought and fuel moisture in many regions across the globe. CTs thus may be related to cycles in wildfire activity, and thereby help fire managers to anticipate fire-prone weather conditions as well as envisaging their future evolution. A wide number of CTs modulate weather in the Iberian Peninsula (IP), exerting different levels of influence at different spatial and seasonal scales on a wide range of weather factors. In this work, we investigated the link between the most relevant CT patterns in the IP and fire activity and danger, exploring different spatial and temporal scales of aggregation. We analyzed a period of 36 years (1980–2015) using historical records of fire events (>100 ha burned) and the Canadian Fire Weather Index (FWI). Cross-correlation analysis was performed on monthly time series of CTs and fire data. Results pointed towards the North Atlantic Oscillation (in the western half of the IP) and Mediterranean Oscillation Index (along the Mediterranean coast) as the key CTs boosting burned area (BA) and fire weather danger in the IP. Both CTs relate to the relative position of the Azorean anticlone, fostering hazardous fire weather conditions during their positive phases, i.e. low rainfall and warm temperature leading to low fuel moisture content. The Scandinavian pattern index also played an important role in the western half of the Peninsula, linked to a decrease in rainfall during its negative phases. Nonetheless, the association between the CTs and BA (up to 0.5 Pearson's R p < 0.05) was weaker than the observed between CTs and FWI (up to 0.75 Pearson's R p < 0.05).
Export citation and abstract BibTeX RIS

Original content from this work may be used under the terms of the Creative Commons Attribution 4.0 license. Any further distribution of this work must maintain attribution to the author(s) and the title of the work, journal citation and DOI.
1. Introduction
Modes of sea surface temperature (SST) and associated climate teleconnections (CT) are known to influence and synchronize weather from sub-continental to local scales [1], including temperature, precipitation and, subsequently, drought [2–4]. These weather features have a strong impact on the occurrence and behavior of wildfires, by altering fuel moisture and ignition probability or triggering lightning fire events [5–9]. The role of climate-related factors is expected to strengthen in the future, setting a context in which CTs are expected to amplify their effects [10–12].
Several authors have conducted research into CT patterns and their relation with climatic variables at different temporal and spatial scales worldwide [13–16] and, specifically, in the Iberian Peninsula (IP [17–21]); one of the most fire-affected regions in Mediterranean Europe [22]. A wide range of CTs influence weather factors in the Western Mediterranean basin [23], namely the North Atlantic Oscillation (NAO), the Atlantic Multidecadal Oscillation (AMO), the East Atlantic (EA) teleconnection pattern index, the 'Niño' 3.4 SST index (ENSO), the Mediterranean Oscillation (MOI), the Pacific Decadal Oscillation (PDO), the Scandinavian pattern (SCAND) and the Western Mediterranean oscillation (WeMOi). For instance, the annual amount of rainfall was significantly linked to the WeMOi, EA, NAO, ENSO, whereas blocking episodes in the IP were linked to SCAND patterns [24]. The seasonal and spatial variability in mean temperature was also associated to the different phases of CTs. The NAO and EA patterns were positively correlated with annual mean temperature in the IP. In turn, the correlation between WeMOi and temperature depicts a gradient, being negative in the north but positive over the Mediterranean coast [18]. Moreover, the AMO has been reported to control the variability in summer length over Europe, particularly after 1979 [25].
Extensive research has been devoted to unravelling the link between CTs and fire activity, showing how changes in weather mediated by CTs can directly impact burned area (BA) in many regions across the world [23, 26–34]. The analysis of the effects of CTs on weather, fire danger and activity is not straightforward [35] as they are non-stationary and associations may vary over space at sub-continental scales. Likewise, methodological approaches vary depending on the pursued goals. Correlation and regression analysis using time series [23, 33–35] and t-test [36] were frequently applied when dealing with 'local' spatial patterns, while more sophisticated techniques (wavelet coherence or superposed epoch analysis) have been used to provide in-depth insights at sub-continental scales [32, 37–39]. Some studies opted by analyzing the influence of climate on fires based on circulation-weather patterns [5, 6, 40] or local-scale weather forcing conditions [41]. Recent advances in Global Climate Models (GCMs) offer an alternative to statistical approaches [42] though uncommon in the literature [38, 39]. However, raw GCM's outputs cannot be directly used for quantitative wildfire evaluations. Systematic biases of the models from to the observed climate leads to significant deviancies of its statistical properties [43]. Furthermore, their coarse spatial resolution is usually not suitable for addressing the local fire-weather conditions [42].
However, studies addressing CTs and wildfires in the Mediterranean Europe are scarce, even though the understanding of the climate-fire dependent relationships would allow anticipating fire danger, thus improving prevention and preparedness (e.g. strategically arrange suppression resources or reduce fuel loads).
Multiple factors may exert an influence in fire activity and fire weather. As a consequence, the IP is quite diverse in terms of fire regimes and its underlying drivers, which vary across time and space [44–46]. A recent work by [23] reported noticeable correlation between SCAND, NAO and MOI/WeMOI in Spain and Portugal, though their CT-related analyses were conducted at the national (countrywide) and yearly scales in different time frames (starting in the 70s until 2017). Nonetheless, there is evidence of CT interactions modulating and exacerbating weather variability [32, 36, 37], subsequently influencing fire activity [47]. However, there is not a clear picture of the effects of CT on fire activity in the IP, and specifically on the coupled effects of CTs, on fire activity at multiple temporal scales of aggregation.
Therefore, with this paper we intend to fill the referred lacunae, aiming at identifying the influence of the most significant SST modes and CTs, individually or coupled, affecting fire danger and activity in the IP. We developed a novel framework to unravel the spatial patterns of the most influential CTs while identifying synergies and temporal scales modulating their signal. We further extend over former analyses by digging into the spatial distribution of the links between wildfires and CTs, providing a transboundary assessment using homogeneous fire regime zones, deeper insights into monthly and seasonal associations, and incorporating wildfire danger rating indices into the assessment. Specifically, we address the following research questions: (a) how do CTs relate to meteorological fire-weather rating indices and fire activity? (b) do CT-wildfire relationships vary over space? (c) are there coupled effects among CTs leaning towards a temporal window with higher fire danger and/or activity? (d) is the effect of CTs indices on fire danger and fire activity lagged in anyway?
2. Materials and methods
2.1. Data
2.1.1. Fire data
Historical fire data was retrieved from the Spanish EGIF ('Estadística General de Incendios Forestales') [48] and Portuguese DECIF ('Dispositivo Especial de Combate a Incêndios Florestais') [49] official fire databases. We compiled a harmonized dataset gathering fire records from both databases. According to Pereira et al [49], fires below the 100 ha threshold were not compiled consistently during the 80s. To ensure the homogeneity (missing records, lack of information, etc) in the final fire dataset, we selected only those fire events larger than 100 ha in the period 1980–2015. Additional information including the starting location (at NUTS3 level) and the date of ignition was also retrieved from fire databases to enable further analyses.
Fires were organized according to their pyroregion of origin (see figure 1) as outlined by Trigo et al [44], who defined four macro regions with homogeneous fire regimes (N: North, NW: Northwest, SW: Southwest and E: East). Then, fire events were aggregated on a monthly basis in terms of BA.
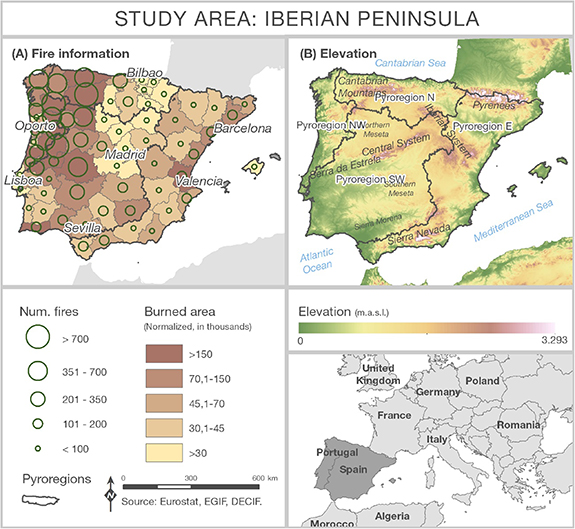
Figure 1. Description of the study region. (A) Spatial distribution of number of fire events and normalized burned area (burned area divided by region size) at NUTS3 level, 1980–2015; (B) physical map of the Iberian Peninsula.
Download figure:
Standard image High-resolution image2.1.2. Fire weather danger
We used the Canadian Fire Weather Index (FWI) as an indicator of fire-conducive weather conditions. The FWI [50] is a numerical rating system that summarizes the chances of a fire to ignite and propagate, widely used to monitor and foresee hazardous conditions (e.g. the European Forest Fire Information System). It is based on a combination of components built-up from raw weather information such as relative humidity, accumulated rainfall in the last 24 h, temperature and wind speed. The FWI data were generated by the European Center for Medium-Range Weather Forecasts from the ERA5 reanalysis dataset [51]. Daily grids of FWI at 0.25° resolution were retrieved from the Copernicus Climate System (C3S), later aggregated into monthly time series as the mean FWI per month and grid cell. Note that the grid cell served as spatial unit of analysis in FWI analyses whereas BA was addressed at region level.
2.1.3. Climate teleconnections
We chose the most important CT patterns (at monthly level) in the Western Mediterranean Basin based on previous studies ([2, 24, 44, 49, 50]; table S1 (available online at stacks.iop.org/ERL/16/044050/mmedia)): NAO, AMO, EA, ENSO (El Niño), MOI, PDO, SCAND, and WeMOi.
The NAO pattern has been quantified by means of the dipole-like standardized surface pressure difference between the North Atlantic Subtropical High (whose data can be taken from Ponta Delgada-Azores, Lisbon or Gibraltar) and a second station close to the Icelandic Low (Reykjavik) [52]. The positive phase involves a substantial development of a low pressure centre in Iceland and a high pressure centre over the Azores, which is associated to below-normal rainfall over southern Europe. The opposite pattern is found during negative phases, when the Icelandic Low and the Azores High are weaker than usual. The EA is structurally similar to NAO. It consists of a north–south dipole of anomaly centers spanning the North Atlantic from east to west [53]. The positive phase of EA is associated with a warm conditions in Western Europe and below-average precipitation across southern Europe. The AMO pattern is defined as a detrended average of SST anomalies in the North Atlantic [54]. The positive phase of the AMO is associated with increased mean surface air temperature, especially pronounced over North America and Europe during summer [55]. The SCAND consists of a primary circulation center over Scandinavia, with weaker centers of opposite sign over western Europe and eastern Russia/western Mongolia [54]. The positive phase of SCAND is associated with above-average precipitation across central and southern Europe. The MOI was defined in order to explain opposing atmospheric dynamics between the western and eastern sectors of the Mediterranean basin. The MOI is marked as the normalized pressure difference between Algiers and El Cairo [53]. A second version of this index can be calculated as the difference of standardized pressure anomalies at Gibraltar and the Israeli meteorological station of Lod. The WeMOi pattern is calculated as a standardized pressure difference between northern Italy (Padua) and southern Spain (San Fernando). The positive phase is characterized by the anticyclone over the Azores and a low-pressure centre over the Gulf of Genoa; the negative phase comprises the Central European anticyclone located in the north of Italy, and low-pressures in the Gulf of Cadiz [24]. The ENSO/'Niño' 3.4 SST index was calculated from the HadISST1 as the average of SST anomalies over the region from 5° S–5° N to 170–120° W [56]. The PDO is most frequently referred to as a long-lived El-Niño like pattern of the Pacific climate variability. The PDO pattern is derived as the leading principal component (PC) of monthly SST anomalies in the North Pacific Ocean, poleward of 20° N [57].
2.2. Statistical analyses
2.2.1. PC analysis
PC analysis (PCA) of monthly time series of CTs was applied to address potential synchronic effects or interactions between them, and to build a smaller subset of CT indices. PC were selected according to the Kaiser criterion, i.e. retaining those PCs with standard deviation higher than 1 [56]. The contribution of each CT to each PC was addressed via varimax rotation [58]. PCA loadings and scores were subsequently compared to monthly time series of BA, analyzing each region separately.
2.2.2. Cross-correlation time series analysis
The core of our statistical analysis is based on the calculation of Pearson's cross-correlation R coefficients at multiple temporal and spatial scales. Paired monthly time series of BA, CTs and FWI were explored to investigate the lagged association of BA and CTs, and FWI and CTs, respectively. Four different timing windows of FWI and BA were investigated (April–June, AMJ; May–July, MJJ; June–August, JJA; and July–September, JAS) to account for potential differences between early to late summer conditions (figure 2). Several lag intervals (i.e. synchrony, from 0 to 6 months before) and scales of aggregation (from 3 to 6 averaged months) of CTs with BA and CTs were analyzed (see figure 2).
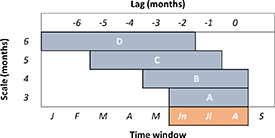
Figure 2. Illustration of temporal scales of aggregation. Orange indicates the temporal window for FWI or BA (JJA in the example). (A) 3 month aggregation (scale) of CTs, with lag 0 (synchronic to FWI/BA); (B) 4 month scale, lag 0; (C) 5 months scale, lag −1; (D) 6 month scale, lag −2.
Download figure:
Standard image High-resolution imageStationarity in the time series was tested before the correlation analysis was performed using the Augmented Dickey–Fuller test [57]. Those series found non-stationary were detrended by subtracting the trend component after applying a Seasonal-Trend decomposition [59]. Correlations between BA and coupled CTs were addressed at regional level, calculating the correlation between 3 month averaged BA (to account for a season-like time span) and PCA's scores. BA assessments were conducted in the four fire regions (figure 1) separately. Correlation outputs for BA were organized based on the combination of region and time window, reporting the most correlated lag and scale (table 2). Correlations between FWI and individual CTs were calculated at FWI pixel level (0.25°). Correlations were summarized as a set of maps reporting the most and second most correlated CT per pixel (figure 4) and its corresponding time window, lag and scale of aggregation (figure 5).
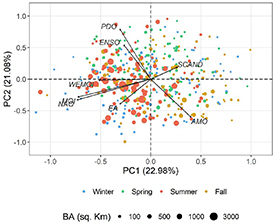
Figure 3. Interaction between CTs (PC1 and PC2) and seasonal distribution of burned area in the Iberian Peninsula (1980–2015). Color indicates season whereas size relate to burned area. Each dot represents the BA in an individual month.
Download figure:
Standard image High-resolution image
Figure 4. Spatial distribution of most influencing CTs on FWI. Top most (A) and second most (B) correlated teleconnection. Bottom, Pearson's R correlation coefficient for most (C) and second most (D) correlated CT. All correlation values were significant at p < 0.05.
Download figure:
Standard image High-resolution image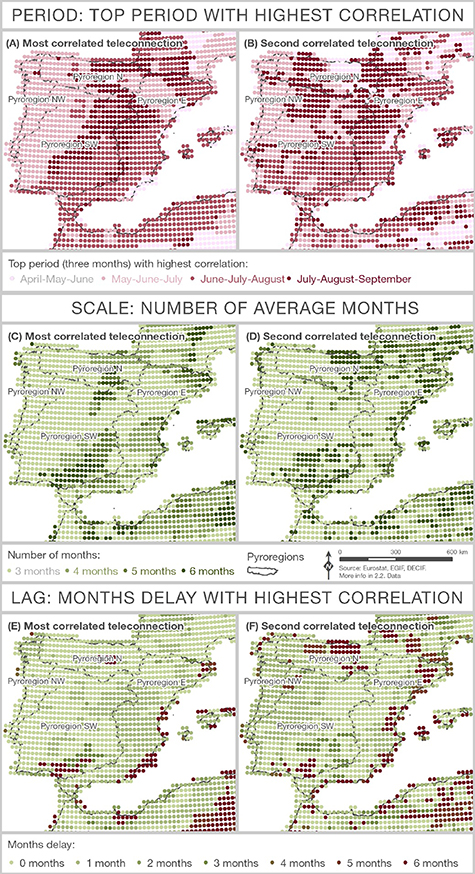
Figure 5. Spatial distribution of temporal parameters of most influencing CTs on FWI. Top period with highest correlation for the most (A) and second most (B) correlated teleconnection. Mid, scale (number of averaged months) with highest correlation for the most (C) and second most (D) correlated CT. Bottom, lag (months delay) with highest correlation for themost (E) and second most (F) correlated CT. All correlation values were significant at p < 0.05.
Download figure:
Standard image High-resolution image
Table 1. Summary of principal component analysis. Sd, standard deviation; Exp. Var, explained variance; Cum. Var, accumulated variance. Boldface indicates significant loadings in Varimax rotation. Loadings higher than 0.4 were highlighted in gray.
| Summary | Loadings | ||||||||||
|---|---|---|---|---|---|---|---|---|---|---|---|
| Sd | Exp. var | Cum. var | AMO | EA | MOI | NAO | ENSO | PDO | SCAND | WeMOi | |
| PC1 | 1.36 | 0.23 | 0.23 | 0.30 | −0.23 | −0.54 | −0.54 | −0.20 | −0.23 | 0.20 | −0.38 |
| PC2 | 1.30 | 0.21 | 0.44 | −0.47 | −0.31 | −0.22 | −0.25 | 0.42 | 0.61 | 0.15 | −0.02 |
| PC3 | 1.06 | 0.14 | 0.58 | 0.36 | 0.56 | −0.07 | 0.04 | 0.58 | 0.15 | −0.06 | −0.44 |
| PC4 | 1.05 | 0.14 | 0.72 | −0.16 | −0.30 | −0.04 | 0.15 | −0.08 | 0.01 | −0.79 | −0.47 |
Table 2. Correlation coefficients per region, time window, lag and scale between burned area and CTs. Columns headers denote the temporal window for burned area aggregation: AMJ, April–June; MJJ, May–July; JJA, June–August; JAS, June–September. E, East region; N, north region; NW, northwest region; SW, southwest region. Bold values indicate significant correlations (p < 0.05). N indicates the number of fires analyzed.
| AMJ | MJJ | JJA | JAS | ||||||||||||||
|---|---|---|---|---|---|---|---|---|---|---|---|---|---|---|---|---|---|
| Region | R | Lag | Scale | N | R | Lag | Scale | N | R | Lag | Scale | N | R | Lag | Scale | N | |
| PC1 | E | 0.49 | 3 | 5 | 213 | −0.41 | 4 | 3 | 640 | −0.45 | 5 | 3 | 1092 | −0.48 | 6 | 3 | 1118 |
| MOI/WeMOi and NAO | N | −0.56 | 6 | 3 | 312 | −0.42 | 6 | 4 | 258 | −0.37 | 1 | 5 | 752 | −0.34 | 3 | 3 | 1384 |
| NW | −0.50 | 3 | 5 | 247 | −0.28 | 4 | 3 | 896 | −0.33 | 3 | 3 | 2956 | 0.42 | 6 | 5 | 3917 | |
| SW | 0.20 | 6 | 4 | 422 | 0.28 | 5 | 5 | 1745 | −0.26 | 4 | 5 | 3665 | −0.21 | 5 | 3 | 4231 | |
| PC2 | E | −0.34 | 6 | 5 | 213 | 0.24 | 6 | 5 | 640 | −0.28 | 5 | 3 | 1092 | 0.32 | 0 | 5 | 1118 |
| PDO and ENSO | N | 0.38 | 0 | 3 | 312 | 0.43 | 1 | 3 | 258 | −0.31 | 5 | 4 | 752 | 0.43 | 0 | 3 | 1384 |
| NW | −0.26 | 6 | 3 | 247 | −0.19 | 4 | 4 | 896 | 0.33 | 2 | 4 | 2956 | 0.23 | 6 | 5 | 3917 | |
| SW | −0.31 | 1 | 3 | 422 | −0.22 | 4 | 3 | 1745 | 0.37 | 3 | 3 | 3665 | 0.32 | 4 | 3 | 4231 | |
| PC3 | E | 0.39 | 6 | 5 | 213 | 0.19 | 0 | 4 | 640 | 0.36 | 0 | 3 | 1092 | 0.40 | 1 | 3 | 1118 |
| ENSO. EA and AMO | N | 0.32 | 5 | 4 | 312 | −0.28 | 5 | 3 | 258 | 0.31 | 2 | 3 | 752 | −0.20 | 4 | 3 | 1384 |
| NW | 0.30 | 4 | 5 | 247 | 0.47 | 0 | 5 | 896 | −0.41 | 0 | 3 | 2956 | −0.42 | 1 | 3 | 3917 | |
| SW | −0.23 | 1 | 4 | 422 | 0.38 | 1 | 3 | 1745 | −0.27 | 6 | 3 | 3665 | 0.23 | 4 | 4 | 4231 | |
| PC4 | E | 0.26 | 6 | 5 | 213 | −0.34 | 6 | 4 | 640 | −0.24 | 0 | 3 | 1092 | −0.39 | 0 | 3 | 1118 |
| SCAND and WeMOi | N | 0.41 | 5 | 3 | 312 | 0.40 | 6 | 5 | 258 | −0.24 | 1 | 3 | 752 | −0.45 | 0 | 4 | 1384 |
| NW | 0.32 | 2 | 4 | 247 | 0.28 | 4 | 3 | 896 | −0.29 | 2 | 5 | 2956 | −0.38 | 6 | 3 | 3917 | |
| SW | 0.59 | 5 | 5 | 422 | −0.27 | 0 | 4 | 1745 | −0.41 | 6 | 5 | 3665 | −0.31 | 5 | 5 | 4231 | |
3. Results
3.1. Association between CT patterns and BA
We retained four PCs (labeled from PC1 to PC4) according to the Kaiser criterion, explaining 72% of the original variance. Each PC depicted a specific pattern of association with CT teleconnection patterns (figure 3; see https://cts-ba-ip.netlify.app [60] for additional outputs) that was characterized according to the loading contribution of each individual CT projected to each component (table 1). Below we describe the four main components attending to the most relevant CTs:
- PC1: synchronic MOI, NAO (both show a close loading value and sign, −0.54) and WeMOi (−0.38) opposed to the AMO phase (0.30). The highest the PC's score the lower the association with MOI/NAO/WeMOi. Likewise, high scores point towards a low AMO index.
- PC2: this PC summarizes the influence of PDO and ENSO (loadings 0.61 and 0.42, respectively) opposed to AMO (−0.47). The highest the score the highest the PDO/ENSO. High scores relate to −AMO phase.
- PC3 represents synchronic (similar loading value) ENSO/EA/AMO opposed to WeMOi. High scores of the PC indicate high ENSO/EA indices; low scores depicted low WEMOI. High values relate to +AMO phase
- PC4: conjunction of SCAND (−0.79) and WeMOi (−0.47) phases. The highest the PC's score the lowest SCAND/WeMOi index value.
PCA revealed interesting patterns of association between CTs and the seasonal distribution of BA size (figure 3; see figure S1 in supplementary materials for additional biplot combinations). MOI, NAO, WeMOi and, to a lesser extent EA, were positively linked to summer BA (mainly in PC1), i.e. the main fire season in the IP. Likewise, AMO showed an inverse association, though slightly linked to BA during fall.
Nonetheless, spatial and temporal differences were observed at region level since pressure centers affect differently the different areas of the IP in terms of precipitation and therefore that is reflected in terms of drought and vegetation development (table 2). PC1 (MOI/NAO/WeMOi) showed significant associations with BA in all regions, except in the SW area. Positive phases of either NAO or MOI fostered increased BA. This association was observed consistently at multiple temporal scales though it was more intense at 4–6 months (lag) before June. The conjunction of positive ENSO and PDO (PC2) was related to an increased BA in early and late summer in the N (MJJ and JAS) and, with the main fire season in the SW (JJA). An immediate association (lag 0) was reported in the N whereas the signal was slightly delayed in the SE (3 months lag). Synchronic (lag 0) low WeMOi index under positive phases of EA and ENSO (PC3) was associated with a larger BA in the E region. The western half of the peninsula (NW and SW) showed contrasting associations between early and late summer. BA in the MJJ period behaved like the E region while the strongest association in JJA and JAS depicted inverse correlations in the NW, thus BA correlation was negative ENSO and EA phases and positive with WEMOI. Finally, PC4 (SCAND + WEMOI) showed negative short-term (lag 0 and scale 3) correlations with BA in late summer in all regions except in the SW area. Conversely, high WEMOI and SCAND during the winter prior summer was associated with an increased BA in AMJ.
3.2. The influence of CTs on fire weather danger
In order to complete the analysis of historical fire incidence we investigated the potential association between CTs and FWI (figure 4; see https://cts-fwi-ip.netlify.app [61] to see the individual maps of CTs' correlation patterns). The most influential CTs were MOI, SCAND, NAO, PDO and AMO. MOI, NAO and AMO displayed a positive relationship, i.e. the higher the index the higher the fire weather danger. These CTs relate to sustained anticyclone conditions during their positive phases. Conversely, SCAND and PDO showed an inverse association pattern, possibly linked to the lack of precipitation during their negative phases. The spatial distribution of the most correlated CTs revealed a dissimilar pattern across the IP. The MOI dominates the Mediterranean coast (E) and the eastern half of the SW region (R > 0.6, p < 0.05), intermingling with smaller enclaves of AMO in the south and SCAND in the northeast. The seasonal evolution of these CTs, appraised in the supplementary materials, reveals a strong and persistent influence of AMO from June to September, with SCAND being stronger during the central summer months (JJA). In the western half of the Peninsula (SW and NW), NAO (R > 0.5, p < 0.05), PDO and SCAND (R < −0.6, p < 0.05) modes were the most correlated. The first was main operating in early summer (MJJ at scale 3) whereas the latter exerted increasing influence from early to late summer, especially the PDO, which affects JJA and JAS the most (see https://cts-fwi-ip.netlify.app).
In the west and north, the highest association was found with late spring/early summer (MJJ). FWI in the eastern half (especially the E region) was better associated with months within the main fire season (JJA), excluding the Ebro valley. The hinterlands (i.e. inner region away from the coast) depicted the highest correlation with late summer months (JAS). Overall, synchronic interactions (lag 0–1) at lower scales (3–4 months) denoted the strongest association expect for those enclaves in the eastern side associated to NAO and those in the west linked to Mediterranean indexes (figure 5). Nevertheless, the relationship between CTs and FWI clearly operate at smaller temporal scales than BA does, which implies near synchronic responses for the first (i.e. short-term weather responses fostering hazardous conditions) and winter-related (i.e. sustained conditions able to affect fuel moisture content) connections in the latter.
4. Discussion and conclusions
The link between certain CTs patterns and wildfires is significant, though noticeably stronger in fire weather danger (FWI) than BA. That was something to be expected since BA is subjected to human intervention (e.g. suppression) and FWI is a numerical weather danger rate summarizing fire-prone weather conditions. Results suggest that the connection between CT and BA (table 2) operates at longer scales than CT–FWI (figure 5), thus requiring persistent CT patterns, often related to winter conditions, to envisage a significant effect in BA. On the other hand, summer FWI can be successfully forecasted at 1 month lead time in some parts of southern Europe [42]. The interplay between Atlantic, Mediterranean and Eurasian pressure centers governs fire activity in the IP. The MOI, the NAO and the SCAND are the most influential CTs in terms of strength and spatial extent of association. Furthermore, their association was observed with both BA and FWI (figures 3 and 4). The effects of EA and ENSO were weak compared to the remaining analyzed CTs.
The conjunction of MOI/WeMOi and NAO (PC1) relates to larger summer BA in most of the IP, just excluding the SW that is better linked to SCAND (PC4, R = 0.59). BA is largely associated with MOI/NAO positive phases in these regions (R≈ −0.41 to −0.56) and, thus persistent winter-spring (lag 4–6 and scale 3–5) anticyclonic conditions leading to sustained dry spells [62]. However, low NAO plus MOI during winter seems to promote BA in AMJ in the E (R = 0.49), hence moist winters tend to led to larger spring fires in the Mediterranean. PC3 (ENSO–EA) points toward positive synchronic signals and increased BAs, with positive phases of EA relating to high pressure conditions at Mediterranean latitudes. The inverse association observed in the IP between PC4 (SCAND–WeMOi) and BA in late summer (JJA and JAS) points toward abnormally moist winters in the western half (NW and SW lag 6 and scale 3–5; R = −0.38 and −0.41) and springs in the east (lag 0 scale 3–4; R = −0.39 and −0.45) possibly linked to increased fuel availability. Conversely, early spring-summer fires (AMJ and MJJ) displayed positive correlations with PC4 (R between 0.40 and 0.59) at long temporal scales, thus dry autumn and winters are required to promote BA during this season. Our findings are in line with the most recent literature in the region. Royé et al [23] reported significant correlations between CTs and BA in Spain (MOI; R = 0.48), Portugal (SCAND; R = −0.32) and both (EA; R = 0.46 and 0.49). However, other Mediterranean-type regions such as California depicted stronger links with pressure centers operating in the Pacific region ([32]; AMO and PDO), which do not seem to contribute in the study region.
The influence of NAO and SCAND on FWI seems to be stronger during late spring (AMJ; R<−0.50) while MOI better associates (R > 0.50) to the main fire season in the east (JJA [52, 55];). Overall, the MOI dominates the eastern half while the NAO/SCAND exert a large influence in the western end, likely due to the positon of their main pressure centers (southern vs northern latitudes, respectively). The NAO is known to play a crucial role in the climatic variability over the IP and, particularly, in the intra-annual distribution of rainfall [63–65]. Positive correlation between winter dry spells and the winter NAO index have been reported, linked to below-normal pressure across the high latitudes of the North Atlantic [66] whereas negative phases of NAO bring precipitation towards the Western Mediterranean [67]. Rios-Cornejo et al [18] indicated that the NAO influences mainly mean temperature in spring. Also, they found the influence of NAO on temperature decays from NW to SE. Favá et al [20] found a positive relationship between the summer NAO and daily maximum temperatures in northwest of the IP. Likewise, the NAO has been reported to influence trends in temperature [68]. Several studies indicated the relation between the Mediterranean oscillation patterns (MOI and WeMOi) and mean temperature in the Mediterranean coast of the IP [18]. Actually, both NAO and MOI/WeMOI responses are coherent with high-pressure centers over the IP during their positive phases, thus promoting warmer conditions and hence higher fire danger [6]. On the other hand, Rios-Cornejo et al [18] found the WeMOi has strong influence on the mean temperature from April to September (except August). Thus, the more positive the NAO phase, the greater the presence of the Azorean anticlone, less western winds, and therefore less precipitation and higher temperature, and vice versa [19]. Likewise, during the positive phase of the MOI, less precipitation and higher temperature is expected [24]. On the other hand, we found negative correlation with the SCAND and the FWI (R ranging between −0.50 and −0.64). During the positive phase of the SCAND positive height anomalies dominate western Russia and Scandinavia, fostering above-average precipitation and below-average temperature over southern Europe [16].
The positive phases of AMO have been reported to be associated with higher fire frequency in western US, linked to drought episodes [29, 34] and strong winds. Contrary to what was expected, the AMO showed an antiphase correlation with BA (table 1, PC3; R > 0.39), though it is consistent with other studies in the Mediterranean [33].Conversely, it strongly promoted higher FWI rates in the southern Mediterranean (R > 0.50). The study period starts in a negative AMO phase, reaching a positive one by 2015. The trends in BA in the IP are known to show an overall decline, especially along the Mediterranean coast due to increased fire suppression effectiveness over time [69, 70]. In turn, FWI has been reported to steadily increase over time [71, 72]. That could explain the negative link AMO–BA and the positive association AMO–FWI. Notwithstanding, same as the PDO, the AMO is a multidecadal oscillation and it might be the case that the analyzed time span was slightly short.
Nonetheless, our findings were obtained for a subset of fire events (>100 ha), thus we cannot generalize any relationship below that threshold. Likewise, focusing on larger fires may denote stronger associations. As a rule of thumb, the larger the fire the more hazardous the weather conditions. It is possible that the connection between fires and CTs operate at different scales (both temporal and spatial) than the ones we explored, which are the most commonly addressed in the literature [37]. Finally, our study is based on statistical approaches, without performing any numerical experiment (e.g. using a GCM) that enables further insights into wildfire response with and without teleconnections embedded.
Overall, we can safely conclude that monitoring NAO, SCAND and MOI modes and their interplay may allow to foresee hazardous fire-weather conditions and, to a lesser extent, BA size. Nonetheless, regional and temporal differences on their influence do exist across the IP, with NAO being stronger in the Atlantic side and MOI in the Mediterranean coast. Likewise, the Mediterranean side tends to display longer associations (in terms of scale and lag) than the western half. Our findings on the synchrony between CTs, fire weather danger and fire activity will allow managers to identify adverse temporal windows throughout the year with expected high large wildland fire occurrence and danger in advance. Fire agencies should consider CTs in the seasonal assessment of expected fire behavior and danger for strategical decision-making and planning.
Acknowledgments
We would like to thank FCT (Fundação para a Ciência e a Tecnologia, Portugal) under project IMPECAF -PTDC/CTA-CLI/28902/2017, and project UIDB/50019/2020—IDL.
Data availability statement
All data that support the findings of this study are included within the article (and any supplementary files).