

Abstract
The pressure on scarce freshwater resources from intensifying human activity is rising across the globe. This study presents the case of Jatiluhur—Indonesia's largest reservoir, where unregulated aquaculture expansion has contributed to environmental degradation and associated conflicts with other water-users. Aiming to identify a strategy to improve the sustainability of cage aquaculture within Jatiluhur reservoir and other freshwater bodies facing similar challenges, this study consisted of an initial analysis of time bound satellite images of the reservoir and a systematic survey of 112 aquaculture farms. The results revealed that, with more than 45 000 production units in 2020, more than half of which are placed outside government-approved aquaculture zones, the carrying capacity of the reservoir is exceeded. An analysis of the farm-level production practices, pertinent to environmental regulation, indicated the existence of three main production strategies, with significant differences in eutrophication potential among them that would lead to better articulated policy actions. A feed manufacturer-focused policy to reduce total phosphorus levels in formulated diets by more than half, but still within the optimal level for fish performance, would have the most impact. Enforcement of registration and removal of illegal production units supported by satellite-based monitoring of compliance are key recommendations to support intensive cage culture remaining an important economic activity.
Export citation and abstract BibTeX RIS

Original content from this work may be used under the terms of the Creative Commons Attribution 4.0 license. Any further distribution of this work must maintain attribution to the author(s) and the title of the work, journal citation and DOI.
1. Introduction
Multipurpose freshwater reservoirs in populous fish-eating regions of Asia have become major centres of intensive, cage-based aquaculture development [1, 2]. However, the coexistence of aquaculture in such structures together with reliable supply of clean water, and support for sustainable hydropower and agriculture has been questioned, even when it can significantly contribute to nutritional security whilst remaining within local and planetary environmental boundaries [3]. Early technical and economic success of cage culture has tended to drive rapid adoption leading to exceedance of carrying capacity and causing eutrophication of water [1, 2]. A failure of governance to control nutrient enrichment, actually caused by a host of human activities, such as agriculture, land conversion, urban and industrial discharge occurring in surrounding catchments [4], has led to responses ranging from outright bans of aquaculture, such as in most of China [2], to on-going chronic conflicts around poor water quality and costs associated with its remediation [4, 5]. Rational management approaches that include aquaculture are urgently required [6] in locations such as the Citarum river basin, one the largest watersheds in West Java [7], that is of great strategic, economic and food security importance to Indonesia [8], supporting generation of some 20% of the country's gross domestic product [9]. One of the main pillars of the rapid urbanisation and industrialisation of the region has been the cascade of reservoirs Saguling, Cirata and Jatiluhur (see figure 1) constructed along the course of the river between 1965 and 1987 [10]. Whilst the inundation of the reservoirs has opened up new opportunities for income generation, more than 100 000 people were displaced from traditional agriculture-based livelihoods in the process [10].
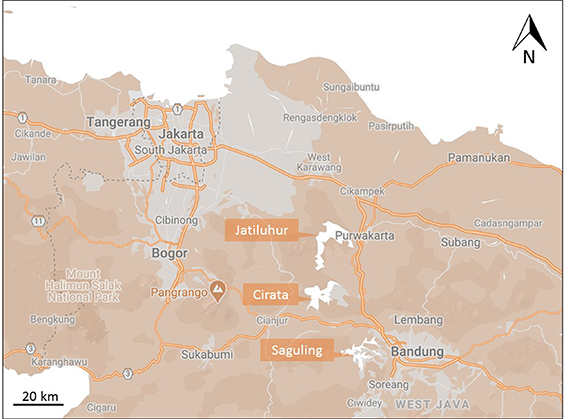
Figure 1. Location of three cascading reservoirs: Saguling, Cirata and Jatiluhur. Own elaboration. Source: Map data ©2021 Google.
Download figure:
Standard image High-resolution imageCommercial floating net-cage aquaculture, was introduced as a livelihood alternative in Cirata and Saguling in the 1980s with the support of the World Bank and the International Center for Living Aquatic Resources Management, local universities and government [11]. Over the years, financial incentives, combined with lax formal governance arrangements, have led to a proliferation of farms in both reservoirs before the practice spread into Jatiluhur, operated by an increasing number of users from the locality and more distant parts of the country [12]. This uncontrolled expansion has contributed to eutrophication of the three reservoirs and a sharp decline in yields [13]. Increased occurrences of 'fish kills' and conflicts with other aquatic resource users, together with its visibility have made the practice a focus for criticism [13, 14]. A propensity for deep water bodies to suffer from irregular turnover, where nutrient-rich, oxygen-poor deep water is bought the surface underlies many of these acute events [15]. However, rising volumes of untreated domestic, agricultural and industrial wastewater entering the system [16, 17], deforestation [18] and climate change [8], have all contributed to making the Citarum river 'one of the most polluted in the world' [17]. In parallel, fresh water demand has grown, both locally and in Jakarta, which depends on the system to supply nearly 80% of its water [17].
This paper focuses on Jatiluhur—the largest (surface area: 8300 ha; mean depth: 36 m) and oldest of the three reservoirs [13]. Constructed primarily for power generation and water supply, the reservoir also supports tourism, irrigation, fisheries and aquaculture, often with conflicting user interests between and within uses [13]. By 2006 the growing proportion of net-cage operators from outside the region, under what were at the time open-access arrangements created tension between 'locals' (including many of the originally displaced families) and 'outsider' fish farmer groups [19]. The Ministry of Fisheries (MoF) responded by introducing officially designated MoF zones for net-cage aquaculture and a standard surface production-unit size of 7 × 7 m, however farms supported by influential lobby groups, continue to operate in non-designated areas ('External zones') where the activity is not legally permitted, mapped in figure 2.
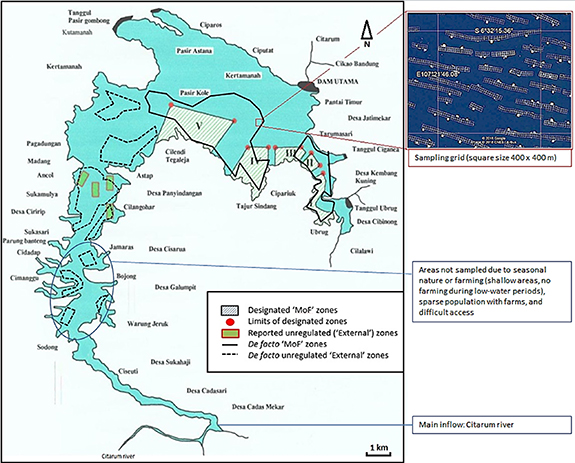
Figure 2. Map of Jatiluhur, showing zonation and fish farms as of 5 January 2017. Own elaboration on a MoF map from 2015.
Download figure:
Standard image High-resolution imageIn order to assist with a move towards a more sustainable management of the water resources of Jatiluhur and the broader Citarum watershed, the overarching objective of the study was to identify a strategy to improve the sustainability of cage culture within Jatiluhur reservoir through: (a) characterising current practice and development trends of aquaculture, (b) identifying and evaluating the principle farm-level management factors contributing to eutrophication and (c) suggesting policies to reduce the eutrophication potential of aquaculture.
2. Materials and methods
2.1. Study design
Field work was carried out between 15 May and 3 July 2015. A two-phase exploratory sequential mixed-methods approach, consisting of a scoping and an in-depth phase, was used [20]. During the first (scoping) phase secondary data were collected, and semi-structured interviews conducted with key informants including cage-operators, input suppliers, fish buyers, local-government agencies, fishermen and boat operators. The objective of the interviews was to describe and understand the variability in the system to better design a structured questionnaire and sampling frame for the second in-depth phase of the study. The questions focused on farm size, ownership type, production practices, zoning regulations and value chain relations. GoogleEarth images from July 2014, selected due to their high-resolution and coverage of the entire water body, were used to derive the actual number of cage farming units (7 × 7 m) in the reservoir 3 . The figures were subsequently updated with images from March 2016 and from July 2019 to September 2020 4 .
In the subsequent in-depth research phase, a farm survey was conducted using a structured questionnaire 5 . The questionnaire design was informed by the scoping phase outcomes and was piloted with 10 respondents before use. It targeted the collection of quantitative data on production strategies in the last completed production cycle for each class of production units and each species encountered on the farm, supported with qualitative explanatory data where necessary. The results of the survey were used to model the farm-level eutrophication potential and link that to production strategies. Farm sampling was stratified on the primary factors of zone (MoF and External) and farm scale based on a hypothesis that these two factors were likely to capture the most significant heterogeneity in the sample with respect to environmental-eutrophication performance. Farms were categorised into Large (L: ⩾50), medium (M: ⩾21 and ⩽49) or small (S: ⩽20) based on the total number of units/farm (7 × 7 m) as suggested by the farmers themselves in the scoping phase. Size of farms was validated at the time of farm visits because of the possibility that a farm could consist of more than one block of cages. The sampling locations were selected by overlaying a virtual geographical grid (with square size of 400 × 400 m) over the area of the reservoir covered by net-cages (figure 2). Owner-operators or senior employees were interviewed at as many farms as possible within each randomly selected square through an interpreter. A total of 112 interviews were included in the analysis, 74 in MoF zones and 38 in External zones, together representing an estimated 6% of the total production capacity in the reservoir. On four occasions, interviews could not be conducted because of the lack of personnel at the farm or a decline to be interviewed. Two interviews delivered 'unrepresentative' data (unusual harvest as perceived by the farm operator e.g. because of lack of finance, disease occurrence) and were excluded from analysis. The structured questionnaire data were recorded in English, coded where applicable and organised as a relational database using Microsoft Access 2010® for analysis using embedded query functions.
Commercial feed samples (100–150 g) from all brands and products encountered on farms were collected at the time of interview and analysed for total phosphorus (TP), using inductively coupled plasma mass spectrometry [21].
2.2. Data analysis
2.2.1. Eutrophication potential model
Environmental performance was measured as eutrophication potential as a limiting-factor for aquaculture and other resource uses [5]. Eutrophication potential was estimated as TP loading from the fish farms 6 , the 'limiting nutrient' in most freshwater systems [22]. An adaptation of the mass-balance model proposed by Beveridge [23] was used here to estimate TP loading. According to Beveridge [23]:

Where  is the TP lost to the environment,
  is the TP in feed inputs and
  is the TP in the fish biomass harvested, over a defined period.
To account for the multi-net layer multi-species cage system employed on Jatiluhur (described in section 3), on a farm f,  and
and  were estimated by (2) and (3), respectively:


where for each species of fish s farmed in a cage with dimensions d of a layer l,  is the commercial pelleted feed input (kg),
  denotes the number of active (stocked over the last one year period) cages,
  the number of production cycles for this cage type per year,
  is the fingerling input (kg)
7
, and
is the fingerling input (kg)
7
, and  is the harvested biomass (kg) at the end of the production cycle; while
  and
and  are the TP content of the feed and fish tissue, respectively (g kg−1).
Therefore,
where  for a farm f is measured in g of TP per kg of biomass harvested, which can then be converted to kg/tonne.
The above equation can be re-written as:
In addition:

 denotes the ratio of the total amount of pelleted feed used on a farm per year over the total biomass produced per year for all species and all cages of farm f.
Substituting (6) into (5) gives equation (7):

2.2.2. Latent class analysis
LCA is a cluster analysis approach applicable to continuous and categorical variables designed to uncover 'latent' (unobserved) classes of similar cases in multivariate datasets [24]. Commonly used in marketing and strategic management [25–27] the method was used to segment the sample population into discrete classes based on shared multi-factorial attributes. The resulting classes can then potentially be addressed by individually targeted policies.
The variables selected for LCA analysis (table 1) were hypothesised to be closely associated with eutrophication potential [25] as well as for their ease of observation as indicators by regulators. Segmentation was performed using Q Research Software®. The BIC (Bayes Information Criterion), the main fit statistic in LCA, which reflects how well the model fits the data with lower values reflecting greater optimisation of the number of classes, was used to aid model selection [27].
Table 1. Variables included in latent class analysis (LCA) model.
| Variable | Type | Criteria/units | Comments |
|---|---|---|---|
| Farm scale | CAT | Large (L), medium (M) or small (S) | Categorisation suggested by farmers and based on the total number of farming units of 7 × 7 m owned: S: ⩽20, M: ⩾21 and ⩽49, L: ⩾50. |
| Zone | CAT | MoF or External | Farm located in designated for aquaculture by the Indonesian Ministry of Fisheries (MoF) zone or outside of it (External), see figure 2 |
| Owner origin | CAT | Local or other | Local villages defined as being located within 3 km from the reservoir shore |
| TP discharge rate | CON | Kg t−1 biomass gain | Calculation method presented in supplementary materials |
| Common carp share in annual biomass output | CON | Ratio ranging from 0 to 1 (0 = no Common carp production, 1 = only Common carp is produced) | As the primary fed and most intensively farmed species, it was hypothesised that the degree of specialisation on common carp could be a primary eutrophication determinant |
| Tilapia/pangasius feed type | CAT | Formulated diet; farm-prepared feed; a mix of both or no feeding | Specifying one of the four feeding strategies encountered for the production of tilapia and pangasius |
| Tilapia/pangasius feeding intensity | CAT | Intensive, semi-intensive or extensive | Based on feed conversion ratio (FCR) of formulated commercial and/or farm-prepared feed inputs as an indicator of farming intensity whereby: extensive FCR = 0 (i.e. no direct feeding); semi-intensive FCR > 0 and ⩽1 (i.e. some direct feeding); intensive FCR > 1. |
| Tilapia/pangasius net layer | CAT | Inner/outer or single | Inner/outer—specifying the location of tilapia and pangasius rearing when multi-layer net cage system was used (essentially net-cages 'nested' within each other). Single refers to cages with only one net layer |
| Farm net layer strategy | CAT | Single or multiple | Farms composed of only single-net cages or of multiple-layer cages |
CAT—categorical, CON—continuous.
2.2.3. Hypothesis testing
A one-way ANOVA (Minitab® 18) was conducted to test whether significant differences existed in the rate of TP discharge between the different farming classes identified through LCA. Significant results (p ⩽ 0.05) were followed by Tukey post-hoc pair-wise tests. The assumptions for normality within classes and homoscedasticity were verified using Anderson–Darling and Levene's test, respectively. Similarly, two sample t-tests were conducted to check for significant differences (p ⩽ 0.05) in performance between the two zones 8 .
3. Results
3.1. Industry development trends
Google Earth images confirmed a high level of uniformity in production facilities across the reservoir, consistent with a statutory standard surface production-unit size of 7 × 7 m. The total number of such units in Jatiluhur as of March 2016 was 47 662, covering a total area of 234 ha, or 2.8% of the total surface area of the reservoir (figure 3). Some 38% of the units were located in External Zones. The total number of farms had continued to grow in both zones over the period 2014–2016. However, recent figures from 2019 to 2020 reveal a slight decline to a total of 45 692 units. The decline is due to a reduction in MoF Zones, by some 24% between 2016 and 2020, particularly noticeable in the fraction of large farms. This trend is, however, largely offset by growth in External zones, amounting to a total increase of 29% over the period 2016–2019.
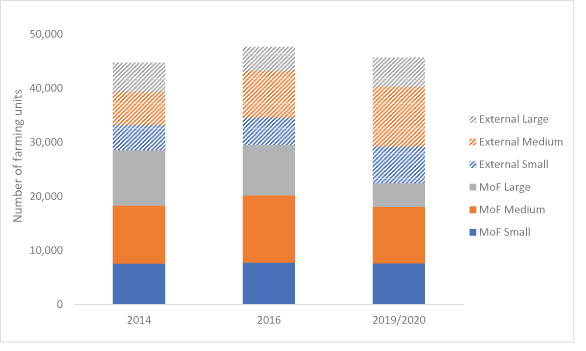
Figure 3. Number of farming units (surface area 7 m × 7 m) by farm size and zone (MoF or External). Counted using Google Earth images from March 2016, July 2014, July 2019, September 2020. Small: ⩽20, medium: ⩾21 and ⩽49, large: ⩾50.
Download figure:
Standard image High-resolution imageSurvey data 9 showed that the number of farming units per farm, ranged widely between 4 and 520 with an average farm size of 51 units (SD ± 64). MoF zones were occupied by a mix of 'outsider' and locally-owned farms, while External zones were predominantly occupied by 'local' farmers. Locally-owned farms were significantly smaller (p < 0.05) than farms whose owner resided beyond the 3 km 'local village' zone, with an average of 41 (SD ± 42) units versus 82 (SD ± 98) units, respectively.
3.2. Production strategies 10
The majority of farms (88%) adopted a multi-layer net-cage system, with two, and more rarely, three layers of nets nested within each other, separating monocultures of three different fish species: common carp (Cyprinus carpio), Nile tilapia (Oreochromis niloticus) and pangasius (Pangasiodon hypophthalmus). The remaining 18% of farms consisted of single-layer net-cages.
In multi-layer net systems common carp typically occupied the upper/innermost layer, while tilapia and pangasius, were primarily found in outer layers. The production cycle for common carp was short, an average of 2.5 months, producing small fish (150–500 g) that were marketed live.
Both formulated pelleted feeds and on-farm prepared feeds were fed. Common carp was fed exclusively on the formulated pelleted feeds, between 4 and 8 times per day to apparent satiation. Formulated diets were compressed sinking pellets explaining the role of tilapia and pangasius held in outside nets, which was to recover uneaten feed sinking through the bottom of the upper net-layer. On 30% of the farms, tilapia and pangasius received no direct feed whilst the remaining 70% received supplementary feed, typically twice a day. In 36% of these cases, the same formulated pelleted diet fed to Common carp was also fed to tilapia and pangasius, while 34% of the farms used a farm-prepared feed or a mixture of formulated and farm-prepared feeds. Soaked discarded noodles and bread were the most commonly used farm-prepared feeds. 'Trash fish' consisting of farmed fish mortalities and an invasive introduced ornamental cichlid known as 'oskar' (Amphilophus citrinellus), purchased from local fishermen, were also sometimes fed to pangasius. A combination of two or more farm-prepared feeds was most frequently used.
On average, a single production unit received 3056 kg of formulated feed, 98 kg of farm-made feed and produced 2336 kg of biomass annually. Common carp received the highest amount of formulated feed 2994 kg (98%) and accounted for an 80% share of biomass output (80%). The total amount of formulated feed used per year for the entire reservoir (assuming a total number of 47 662 production units across the reservoir in 2016) was estimated as 145 655 t, while farm-made feed 4671 t. The total biomass gain was 111 338 t per year, of which 89 700 t of common carp. The total TP discharge was calculated as 2196 t yr−1 11 .
3.3. Farm-level eutrophication potential
The TP content of the sampled commercial pelleted feeds ranged between 1.1% and 2.1% with a weighted average of 1.77% 12 . The feed brand with largest market share (26%) and high overall performance, as reported by farmers, had a moderate TP level of 1.43%.
Table 2 provides a summary of the key variables in the eutrophication potential model. The mean FCR for common carp was 1.63, with a significantly lower mean in the external zone (1.52) compared to the MoF zone (1.69). Tilapia and pangasius both recorded FCRs below 1 reflecting the indirect and supplemental nature of their feeding. The mean combined farm FCR i.e. for all species was 1.32. The mean farm TP discharge rate was 18 kg per tonne of biomass gain (median 19.9 kg t−1), with a significantly higher mean rate of 24.9 kg t−1 recorded for common carp compared to tilapia and pangasius. Thus, the cultivation of the latter species alongside common carp has the effect of reducing the discharge rate by 28% compared to a monoculture of carp.
Table 2. Summary of farm-level input–output measures.
| MoF zone | External zone | Overall | |
|---|---|---|---|
| FCR of formulated feed | |||
| Common carp | 1.69a ± 0.04 | 1.52b ± 0.03 | 1.63 ± 0.03 |
| Tilapia | 0.47 ± 0.16 | 0.25 ± 0.11 | 0.4 ± 0.12 |
| Pangasius | 0.78 ± 0.19 | 0.53 ± 0.07 | 0.73 ± 0.16 |
| All species | 1.36a ± 0.05 | 1.23b ± 0.04 | 1.32 ± 0.04 |
| FCR of farm-prepared feed | |||
| All species | 0.24 ± 0.15 | 0.2 ± 0.08 | 0.21 ± 0.07 |
| FCR of mixed feed input | |||
| All species | 1.36a ± 0.05 | 1.18b ± 0.05 | 1.3 ± 0.04 |
| TP in formulated feed input (kg t−1) | |||
| All species | 17.3a ± 0.3 | 18.93b ± 0.26 | 17.83 ± 0.23 |
| TP in farm-prepared feed input (kg t−1) | |||
| All species | 2.42a ± 0.4 | 6.51b ± 1.29 | 5.1 ± 0.92 |
| TP in mixed feed input (kg t−1) | |||
| All species | 16.94 ± 0.38 | 16.75 ± 0.83 | 16.87 ± 0.38 |
| TP in biomass output (kg t−1) | |||
| All species | 4.35 a ± 0.07 | 4.04 b ± 0.05 | 4.24 ± 0.05 |
| TP discharge rate (kg t−1 biomass gain) | |||
| Common carp | 25.03 ± 0.84 | 24.6 ± 0.74 | 24.89 ± 0.61 |
| Tilapia | −1.77 ± 0.6 | −1.57 ± 0.56 | −1.7 ± 0.43 |
| Pangasius | 2.11 ± 2.36 | −2.03 ± 1.14 | 0.95 ± 1.74 |
| All species | 18.72 ± 1.03 | 16.76 ± 1.36 | 18.03 ± 0.82 |
Values represent averages ± SE. Different superscripts (a,b) denote significant differences between means within rows (p < 0.05).
A scatter plot of individual farm TP discharge rates (figure 4) reveals a wide variation between farms ranging from 6 kg t−1 to 34 kg t−1 biomass production. A four-class LCA solution (yielding the lowest BIC) corresponded with clear clusters in this plot, labelled as Class A, B, C and D. An ANOVA test revealed that significant differences did exist between classes in terms of the rate of TP discharge (F = 65.86, p < 0.05). A post-hoc Tukey test showed that the differences were significant between all pairs of groups, apart from the pair of Classes C and D.

Figure 4. Eutrophication potential of the farms sampled.
Download figure:
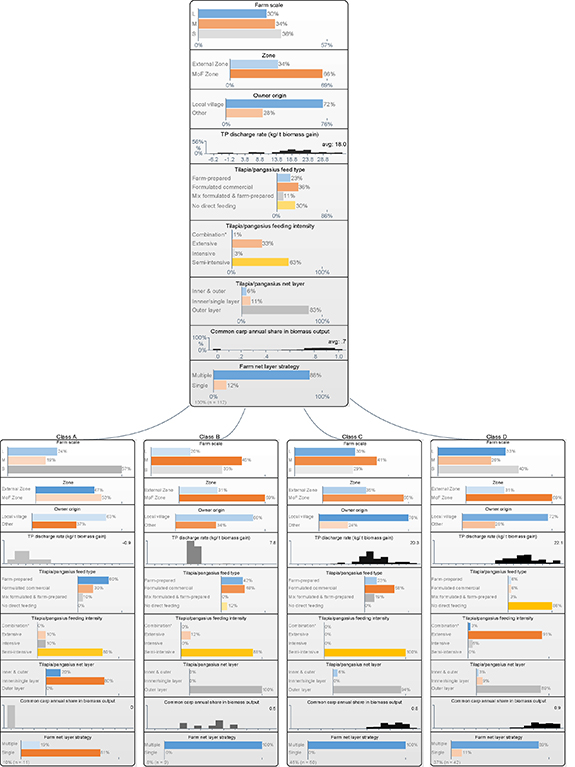
Standard image High-resolution imageFigure 5 presents the distribution of data from all variables used in the LCA model across each class of farms, in order to create profiles for the classes, i.e. a set of characteristics that can be easily observed by regulators concerned with the eutrophication potential of the farm. As seen in the figure, strong positive association existed between the variables 'TP discharge rate' and 'Common carp annual share in biomass output'. Other key variables which distinguished the classes are described for each class below.
Figure 5. Latent class analysis (LCA) segmentation on fish production strategies. Extensive (FCR = 0, no direct feeding); semi-intensive (FCR > 0 and ⩽1); intensive (FCR > 1); *more than 1 feeding intensity strategy within the same layer.
Download figure:
Standard image High-resolution image
Class A which accounted for 10% of the sample consisted predominantly of small-scale farms located in both MoF and External zones. The main distinguishing characteristic of these farms was their focus on tilapia and/or pangasius production and entire exclusion of common carp. Most of these farms employed single net systems and relied predominantly on farm-prepared feeds. Fish farming was an ancillary livelihood activity for most of these farmers, managed as a low-investment (with formulated feeds accounting for the largest share of operational costs) and low-risk source of additional household income and food.
Class B was the smallest class accounting for around 8% of farms in the sample. These farms mostly of medium and small scale, adopted a hybrid strategy with common carp contributing around 50% of annual farm output. Tilapia and/or pangasius were always reared in the outer layer of cages and supplementary rations of formulated or farm-prepared feed. TP discharge averaged 8.1 kg t−1. As for Class A, farms tended to be small-scale owner-operated, though in this case farming activity could be a sole source of income or part of a multiple-livelihood strategy.
Class C and D farms which together accounted for 82% of the farms sampled, focussed primarily on common carp culture. These classes recorded the highest mean TP discharge rates of 20.5 and 22.2 kg t−1, respectively. Farmers in these two classes would rely entirely on their fish farming business and/or related integrated supply-chain activities as their main or only source of income. The large-scale farms in both these categories would also typically employ workers from the region or beyond. The main difference between the two classes related to stocking differentials and provision of feed to the secondary tilapia and/or pangasius crops. Class C farms had a slightly higher share of tilapia and/or pangasius than Class D and were also most likely to be (supplementally) fed with formulated feed. In Class D tilapia and pangasius were stocked at a lower density alongside the primary common carp crop and, in most cases received no direct supplementary feed.
4. Discussion
The overall ambition of this paper is to identify paths to more sustainable cage farming in Jatiluhur reservoir based on a better understanding of the principle farm-level management factors that contribute to eutrophication. From this analysis, appropriate innovations throughout the sector could be identified that would support policy change. Such measures could also have a wider applicability to tropical freshwater bodies facing similar challenges.
While a success from a food security standpoint, with more than 100 000 tonnes of fish produced annually, the environmental and social sustainability of cage aquaculture in Jatiluhur started to decline since the early 1990s due to the lack of effective regulation [12]. The aquaculture carrying capacity of the reservoir, according to methodology by Dillon and Rigler [28], was estimated by the government [29] as 6345 units (7 × 7 m), while in actual number for the same year, as the present study has shown, was nearly 45 000, or seven times larger. In 2018 the central government initiated widespread measures to improve the management of the Citarum river basin, amongst which it envisages the complete removal of floating cages from the three reservoirs (Peraturan Presiden Nomor 15/2018) 13 .
A similar policy of removing aquaculture as a solution to problems with water quality was enacted in large freshwater bodies in China in 2018 [30]. However, the number of production units in Jatiluhur (as seen on figure 3), was not significantly reduced since the enactment of the policy. Previous attempts to clear aquaculture farms from the reservoir have also been unsuccessful [31]. The same problem is present in Lake Toba, Sumatra, where there has been resistance against the removal of fish farms [32]. Even in the newly constructed large hydropower reservoir Jatigede in West Java, completed in 2016, cage farms have appeared despite the formal prohibition of aquaculture issued with the inundation of the reservoir [33]. These cases point to the need for effective management of cage aquaculture in Indonesia instead of a complete ban on the activity. In line with this need for a more balanced strategy that recognises the importance of the sector to the local economy, particularly in view of the COVID19 crisis [34], policy recommendations at different system levels are discussed: feed production and farm-level grow-out practices.
Firstly, our results indicate significant scope for reducing overall TP discharge through lowering the TP content of pelleted feed. The total dietary P requirement for optimal growth of common carp is 6.87 g kg−1 diet, or around 0.7%, of which 5.55 g kg−1 need to be digestible P [35]. Reducing the average feed TP content from 1.77% (the weighted average of TP content of feeds used in Jatiluhur) to 0.7%, given that the digestibility requirement is met [36] and holding everything else constant, would result in a 60% reduction of TP emissions from aquaculture. A requirement to label all formulated diets with TP level and for all feeds to have digestibility and performance certified to a minimal level by the Ministry of Agriculture would ensure compliance in a cost-effective way. New carrying capacity models, accounting for the resulting lower TP emissions, are likely to permit the operation of a larger number of farms than initial estimations.
Similarly, the manufacture, sale and use of floating rather than sinking compound feed [32], that is known to be less polluting [37], should be strongly encouraged and over time, mandated. Such feeds are available in Indonesia and often produced by the same feed manufacturers supplying Jatiluhur, and if more widely adopted would further enhance efficiencies and lower TP discharges per volume of fish produced. Nonetheless, a switch to floating feeds would be expected to negatively impact on the production of the secondary crops of tilapia and pangasius and thus affect availability of affordable farmed fish locally to low-income citizens who depend on these species as a source of protein 14 . Mandating the use of floating feed, however, would be highly observable at the farm level, simplifying regulation. Both approaches would require action at feed manufacturer level, which is far more consolidated than the farming sector and therefore easier to regulate. Self-regulation of feed manufacturers could also be encouraged through adoption of voluntary third-party certified feed standards, allowing feed companies to leverage reputational and market advantage based on superior biological and environmental performance of their products.
Secondly, various steps could also be implemented at farm level. One of them is the prohibition of farm-prepared feeds. Although the ingredients commonly used were mainly carbohydrate-rich with a low TP content, their low water stability and likely high rate of nutrient loss increased their polluting capacity. Thus, while these feeds were used in much smaller quantities than formulated diets, due to the predominantly supplementary nature of feeding, their use should not be encouraged. Ideally, they need to be replaced by feeds optimised for the culture of the targeted species. Some level of self-regulation with respect to the types of feeds used and farm size can be targeted in a co-management framework [38]. The main attraction of farm-prepared aquafeeds is their lower price per unit compared to commercial formulate feeds, however, their performance is likely to be lower too [39]. The overall financial impact for farmers and for the region is, thus, unlikely to be significant.
As seen in the results, farm size alone does not explain performance differences 15 . Thus, effective regulation needs to incorporate other production aspects besides the number of units per farm. Importantly, the results suggested that the quantity of commercial feed used (intensity of farming), and therefore associated environmental impact, were primarily affected by the choice of species to be farmed. In particular, the presence of tilapia and pangasius, which were fed less intensively or did not receive any direct feed at all, reduced eutrophication potential 16 . Therefore, regulations based on which species to be farmed presents an alternative route to reducing TP emissions. In this respect, a clue how to achieve this goal is provided by farming strategies identified as Class A. Farms in this category represented the lowest risk and lowest investment strategy. They were also the most environmentally benign since they relied on high natural levels of primary productivity utilised by tilapia and pangasius and supported by supplementary feeding. As the use of farm-prepared feeds should not be encouraged, farms within this class that used formulated feeds semi-intensively suggest a farming strategy that could potentially meets both food security and environmental objectives.
The establishment of completely extensive cage culture in a hypertrophic environment was proposed by Beveridge [23] as an alternative to intensive aquaculture and as a means to improve water quality. It has been used with limited success in reservoirs in China, Nepal and Singapore [11, 23]. Nevertheless, this strategy was not of great commercial significance and was dependent on eutrophication linked to associated intensive aquaculture occurring elsewhere in the lake. Characterised by low financial returns [40], it was practiced by a very small number of farms in Jatiluhur. It could potentially become a viable strategy for those faced with the alternative of having their farms removed and losing the associated capital investment. However, reduced cash flow and, thus, lower economic benefits to the producers and to the region, should also be expected if the strategy was adopted more widely. Subsidies can serve as additional means to encourage environmentally sound but financially less attractive practices [33]. However, its benefits compared to well-managed fisheries, particularly, the restocking of plankton feeding fish, which is also practiced in Jatiluhur [16], requires context specific assessment.
For an indication of the effective regulation of intensive and commercially lucrative farmscage aquaculture practiced in Indonesia and elsewhere that makes greater claims to sustainability are informative. Such are the large-scale tilapia producers in another major Indonesian water body, Lake Toba [32, 41], which comply with international standards for sustainable aquaculture. However these standards set TP discharge thresholds (⩽20 kg t−1 biomass gain [42]) that are similar to those estimated for farms in this study suggesting the pollution capacity of the individual farms in Jatiluhur is actually in line with international norms and the key issue is the overall discharge load from too many production units.
Thus, unless the TP content of feed is reduced and/or the intensity of farming practices decreased, limiting substantially the number of production units, remains the main route to achieving lower eutrophication impact [43, 44]. This, however, needs to then be enforced through monitored registration and deregistration of farm units by local authorities, crosschecked with satellite data and farm visit to validate production type. Furthermore, the significantly better FCRs and shorter growth cycles 17 of farms in External Zones, compared to farms located in MoF zones, suggest that more sustainable aquaculture would result also from review and enforcement of an appropriate zonation strategy. The differential performance, which might partly be due to better water quality related to specific local conditions such as being located close to the Citarum river inflow, suggest that aquaculture zones and their capacities should not be defined solely on the basis of relation to other human activities but need to take into account the physicochemical properties of the water body and its topography [43]. Ideally, stakeholder approaches would underpin aquaculture management of such valuable, multipurpose water bodies [45]. However, in the long term, their sustainable use requires a holistic watershed approach [4] where aquaculture is seen not in isolation but as one of many interlinked components of the human-environment system.
5. Conclusions
The study has shown that, despite the efforts of the Government to reduce the number of production units, the size of the aquaculture industry in Jatiluhur is still much larger than the reservoir's carrying capacity. While environmental sustainability cannot be achieved without a substantial cutback in the dominant intensively fed fraction of the industry, the study maintains that a complete ban on aquaculture can be avoided by using alternative approaches to improve water quality, preserving as many farms as possible to maintain livelihoods and food security. Critical to this is for action at the feed manufacturer level, reducing and regulating TP content of commercial feeds to considerably reduce phosphorus emissions from aquaculture. At the farm level, it was shown that not all farms are equal in terms of eutrophication potential, therefore farms need to be classified according to production strategies pertinent to eutrophication and each group targeted with relevant policy mechanisms that either encourage or discourage the activity. These actions, combined with re-evaluating aquaculture zonation and enforcing stricter control over the addition and removal of production units, offer viable routes to a strategy that balances environmental and socio-economic objectives.
Acknowledgments
This study was conducted as part of the project "Aquaculture Carrying Capacity and Water Quality in Indonesian Lakes and Reservoirs" (2014–2016), jointly funded by the US Department of State (Bureau of Educational and Cultural Affairs) and British Council, through the Global Innovation Initiative (GII) Grant and the Institute for International Education". The authors would also like to thank the Indonesian project partners Dr Mohammad Mukhlis Kamal of the Faculty of Fisheries and Marine Science at IPB University in Bogor, Ms Cut Desyana of Surya University, Jakarta, and the staff of the national Research Centre for Regeneration and Conservation of Fish Resources (Balai Penelitian Pemulihan dan Konservasi Sumber Daya Ikan—BP2KSI) who kindly supported this research, as well as the Indonesian interpreters Raka Noviar and Riskayanti, and Mr Billy Struthers of Stirling University for the TP analysis.
Data availability statement
All data that support the findings of this study are included within the article (and any supplementary files).
Footnotes
- 3
While the regulators define a farming unit as a standard square cage with size of 7 × 7 m, the actual size of cages can be a multiple of that i.e. where units are sometimes merged to create larger size cages. A farming unit is defined here as a farm constituent with a surface measure of 7 × 7 m. A cage measuring 14 × 14 m for example, would therefore be considered as 4 farming units. Such an approach is possible at Jatiluhur because of a high level of uniformity in the dimensions of cages linked to the statutory maxima (figure 2).
- 4
Images dated 21 September 2020 for MoF Zones and 26 July 2019 for External Zones were the most recent images of sufficient resolution to permit counting of the production units.
- 5
Questionnaire can be found in supplementary materials.
- 6
TP loading for the entire water body and by zone was also calculated using total number of farming units for 2016, the results of which can be found in supplementary materials.
- 7
Where pangasius fingerling size was given in length, it was converted to weight according to Froese et al [46].
- 8
Results presented in supplementary materials.
- 9
The results presented beyond this point are based on the farm survey conducted in 2015. Data from GoogleEarth images, seen on figure 3, were used to establish the trend in total number of farming units and as a multiplier to make estimations of the total input–output structure of aquaculture in Jatiluhur (which can be found in supplementary materials). The farming practices described in section 3.2 are independent of the spatial images and, based on recent personal communication with farmers, the authors assume that these practices have not changed significantly between conducting the survey and the publication of this paper.
- 10
A detailed description of the production system and production cycle is given in supplementary materials.
- 11
A more detailed description of the annual input–output characteristics of aquaculture in Jatiluhur can be found in supplementary materials.
- 12
Further detail of the TP analysis of different commercial pelleted feeds products and assumptions about TP content of farm-prepared feeds is given in supplementary materials.
- 13
Regulation of the President of the Republic of Indonesia, Number 15/2018, Concerning the Elevation of Control over Pollution and Degradation of the Citarum River Basin [in Indonesian], 15 March 2018. Available at: www.peraturan.go.id/perpres/nomor-15-tahun-2018.html. [Accessed 8 October 2018].
- 14
Suggested reasons for using only sinking feed in Jatiluhur and associated socio-economic consequences of switching to floating feeds are explored in more detail in box 1 in supplementary materials.
- 15
Farm scale is often used as the only criterion for classification e.g. see [5], however, more relevant indicators are usually required to address complex policy-related questions.
- 16
More detailed analysis on the production system and the factors governing the choice of species can be found in supplementary materials.
- 17
See supplementary materials