

Abstract
The effectiveness of many stream restorations in improving water quality is unmeasured. In the Mid-Atlantic region of the United States, activity by European settlers resulted in upland erosion and deposition of sediments 1–3 m in thickness in stream valleys. Subsequently, streams incised those legacy sediments creating steep, exposed banks, infrequent floodplain inundation, and water tables disconnected from floodplains. Legacy sediment removal (LSR) and floodplain reconnection (FR) proposes water quality improvement by restoration to a hydrological state closer to pre-European. We investigated water quality at nine sites, six restored with LSR/FR and three comparison sites. Nitrogen baseflow concentrations and fluxes were elevated in urban and agricultural watersheds with little apparent effect due to restoration. Denitrification appeared to be constrained by carbon availability. Ion concentrations were elevated in all watersheds compared to a forested reference and represent a substantial ecological stressor for the post-restoration aquatic community. Storm event data from one site suggest small reductions in nutrient and sediment loads across the restored reach. High-frequency time series indicate that restoration effects are not observable at larger scales. The effects of restoration, particularly for denitrification, may not be observable for years and can be obscured by weather and climate-driven variability.
Export citation and abstract BibTeX RIS
1. Introduction
In the Chesapeake Bay watershed, regulatory pressures motivate many stream restoration projects. Regulations focus on decreasing nitrogen, phosphorus, and total suspended sediment (TSS) loads to reduce Chesapeake Bay eutrophication [1, 2]. Though billions of dollars are spent annually on restoration, the effectiveness of most restorations is unmeasured [3, 4], particularly for new restoration approaches that aim to be more grounded in biogeochemical processes and geomorphic history [5, 6].
Before European settlement, many Mid-Atlantic streams may have had multiple anastomosing channels with associated wetland complexes rather than a single, meandering channel [7, 8]. From the 1600s through early 1900s, increased soil erosion due to deforestation and agricultural activity along with widespread construction of impoundments in the Mid-Atlantic Piedmont such as milldams resulted in widespread deposition of fine-grained sediment in stream valleys [8, 9]. Over the last century, dam breaches and subsequent stream incision into these legacy sediments created streams with steep, exposed banks, often 1–3 m tall. Incision results in infrequent inundation of floodplains, less sediment deposition, and reduced riparian denitrification [4, 7, 8, 10–13].
Given this history, the restoration approach of legacy sediment removal (LSR) was developed to facilitate floodplain reconnection (FR). LSR restoration aims to lower the floodplain and expose buried relic wetland soils through a combination of LSR and raising of stream bed elevation. Restored streams are expected to inundate floodplains more frequently, and water tables adjacent to these streams should be closer to the floodplain surface. Denitrification and sediment deposition may result from more frequent inundation. LSR/FR also should reduce bank erosion, a major sediment source in the Mid-Atlantic [12, 14]. Since the LSR/FR approach is relatively new, little work has been published to date on the effectiveness of this restoration technique.
We investigated water chemistry (including nitrogen and phosphorus) and TSS at six sites restored with the LSR/FR approach, two regional reference sites, and a site downstream of a restored site. Land use at the restored sites spans a gradient from active agriculture to urban, and restored channel length varies by ∼4.3 times. We investigated baseflow patterns across all sites, stormflow at one restored site, and the detectability of water quality effects due restoration at a location ∼4.4km downstream of a restored site.
2. Methods
2.1. Site characteristics
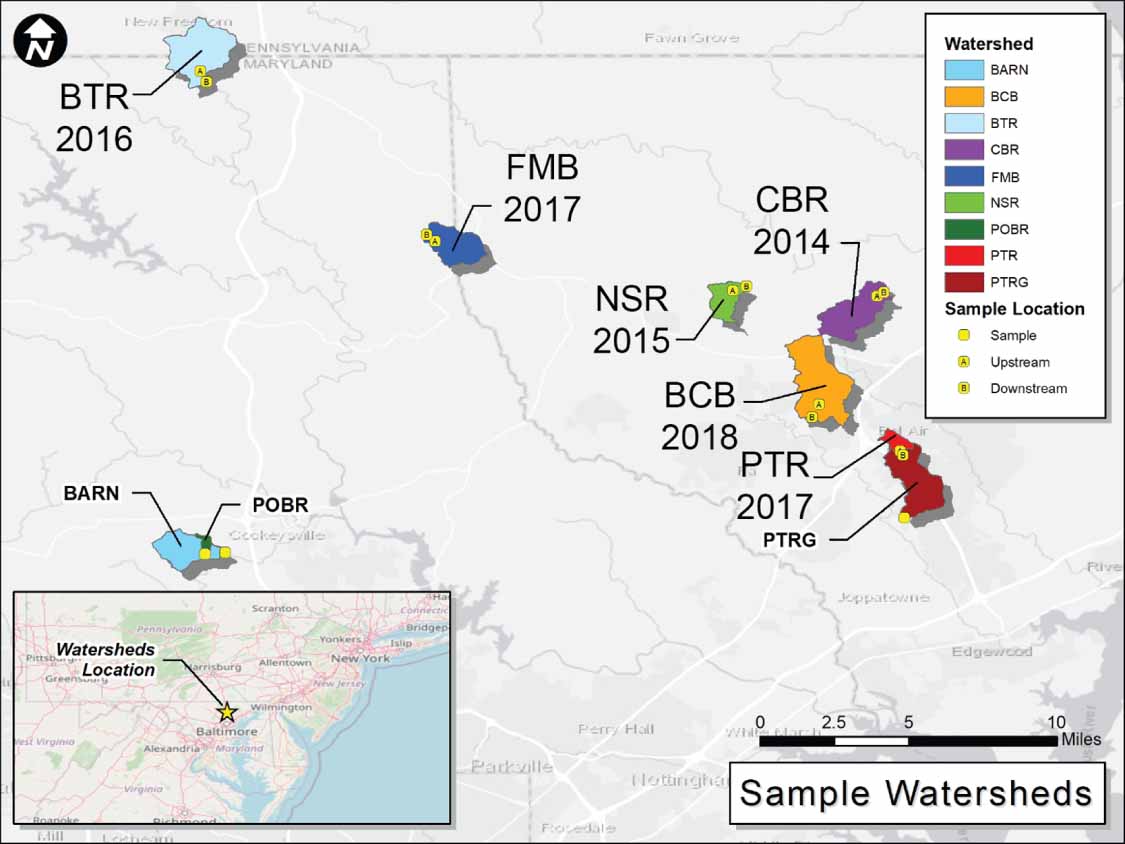
Nine sites with watershed areas of 0.33–8.18 km2 were studied (figure 1, table 1). All sites were located in the Piedmont physiographic province, Maryland, USA and underlain by silica-rich, metamorphic bedrock. Watershed areas and land use characteristics were determined using US Geological Survey (USGS) StreamStats and land use data primarily coming from the 2011 National Land Cover Database [15]. Six restored sites were studied: three restorations were completed 1–3 years before the beginning of water quality sampling and three restorations occurred during the study period with samples collected pre- and post-restoration (table 1). All sites were restored by Ecotone, Inc. Restoration involved removing 1–2.5 m of sediment to substantially lower the floodplain, which at some sites involved removal of mature riparian forest 10 s of meters in width (more detailed site descriptions in supplementary information including land use maps and pictures, figures S1 and S2 (available online at stacks.iop.org/ERL/16/035009/mmedia)). Following removal of sediment, restored sites were planted with grasses and young trees. Three restored sites have substantial active cultivated crop agriculture in the watersheds (FMB, CBR, and BTR, table 1) with active agriculture within 10–100 m of the restored reaches at two sites (FMB and CBR). A fourth restored site (NSR) is primarily active pasture with a small riparian buffer. The fifth restored site (BCB) is currently suburban with ∼9% impervious surface cover (ISC) and active, ongoing development; previous land use at the restoration site was agricultural, and some agriculture remains in the upper reaches of the watershed. The sixth restored site (PTR) is highly urban (49% ISC).
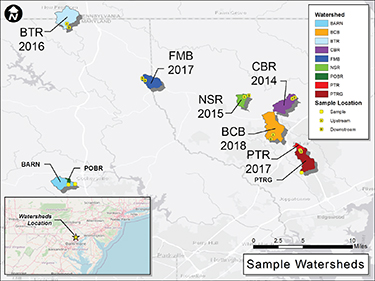
Figure 1. Location map of the six restored watersheds and three regional reference watersheds. For the restored reaches, the upstream (A) and downstream (B) sampling locations are indicated (BTR = Beetree Run, FMB = First Mine Branch, NSR = North Stirrup Run, CBR = Cabbage Run, BCB = Bear Cabin Branch, PTR = Plumtree Run). The regional reference sampling locations at USGS gages are shown for the forested (POBR = Pond Branch) and mostly forested (BARN = Baisman Run) regional reference sites and the site downstream of the highly urban PTR site (PTRG = Plumtree Run Gage). Watershed information, including land use and restoration length, can be found in table 1 and figure S1.
Download figure:
Standard image High-resolution imageTable 1. Watershed characteristics (restored sites sorted from most to least agriculture).
| Site name | Latitude | Longitude | Restoration length and completion date (m and yr) | Watershed area (km2) | Developed (%) | Imperv. surface cover (%) | Forest (%) | Agricultural (est.) (%) a |
|---|---|---|---|---|---|---|---|---|
| Restored sites | ||||||||
| First Mine Branch (FMB) | 732 | |||||||
| Up (FMBU) | 39.63037 | −76.57542 | June 2017 | 2.93 | 4.25 | 0.53 | 22.7 | 73.1 |
| Down (FMBD) | 39.63423 | −76.57990 | 3.88 | 4.86 | 0.47 | 26.4 | 68.7 | |
| Cabbage Run (CBR) | 408 | |||||||
| Up (CBRU) | 39.60432 | −76.36004 | 2014 | 4.40 | 31.5 | 2.19 | 10.7 | 57.8 |
| Down (CBRD) | 39.60579 | −76.35730 | 4.97 | 28.1 | 1.97 | 11.0 | 60.9 | |
| Beetree Run (BTR) | 1621 | |||||||
| Up (BTRU) | 39.71404 | −76.69006 | 2016 | 6.03 | 33.0 | 4.24 | 14.3 | 52.7 |
| Down (BTRD) | 39.70938 | −76.68813 | 6.55 | 30.4 | 3.90 | 14.5 | 55.1 | |
| North Stirrup Run (NSR) | 792 | |||||||
| Up (NSRU) | 39.60696 | −76.43075 | 2015 | 1.83 | 7.44 | 0.78 | 43.8 | 48.8 |
| Down (NSRD) | 39.60967 | −76.42274 | 2.25 | 7.00 | 0.65 | 37.7 | 55.3 | |
| Bear Cabin Branch (BCB) | 1120 | |||||||
| Up (BCBU) | 39.55047 | −76.38959 | April 2018 | 7.07 | 52.5 | 10.2 | 21.9 | 25.6 |
| Down (BCBD) | 39.54515 | −76.39227 | 8.18 | 49.4 | 8.96 | 21.6 | 29.0 | |
| Plumtree Run (PTR) | 378 | |||||||
| Up (PTRU) | 39.52910 | −76.34932 | September 2017 | 0.88 | 97.1 | 48.8 | 3.29 | 0.00 |
| Down (PTRD) | 39.52687 | −76.34811 | 0.96 | 95.5 | 48.6 | 5.01 | 0.00 | |
| Reference sites b | ||||||||
| Pond Branch (POBR) | 39.48029 | −76.68755 | 0.33 | 0.00 | 0.00 | 100 | 0.00 | |
| Baisman Run (BARN) | 39.47958 | −76.67798 | 3.81 | 25.2 | 1.09 | 71.7 | 3.10 | |
| Plum. Run Gage (PTRG) | 39.49624 | −76.34745 | 6.48 | 82.3 | 27.0 | 14.3 | 3.40 |
a Agricultural is estimated as non-developed and non-forest. If 100%-developed-forested was <0, it was set to 0. Land cover data are from the USGS StreamStats site with Developed and Impervious surface cover based on the 2011 National Land Cover Database. b Note the watershed areas used are from the USGS gaging station web pages. USGS gaging station numbers: POBR = 01583570, BARN = 01583580, PTRG = 01581752.
Three additional sites were located at USGS gaging stations. Two served as regional reference sites: a forested watershed with no ISC or agriculture (POBR), which is a sub-watershed of a low-density suburban watershed containing ∼72% forest cover (BARN). The third (PTRG) was used to investigate the detectability of restoration effects at a larger scale; the highly urban restored site Plumtree Run (PTR) comprised a drainage area that was 14.8% of the Plumtree Run Gage (PTRG) watershed and was located ∼4.4 km upstream of PTRG.
2.2. Discharge and sample collection regime
At the six restored sites, area-velocity (Ott MF Pro) or salt dilution methods were used to measure discharge when baseflow water samples were collected. At First Mine Branch (FMB), stage-discharge data were measured to establish a rating curve, which combined with barometric and water pressure data collected every five minutes to create a high-frequency discharge record from April 2019 to May 2020. At the two regional reference sites (POBR, BARN) and the site downstream of the highly-urban restored site (PTRG), USGS discharge data were used.
At the three sites restored prior to this study (table 1), baseflow samples were collected approximately monthly from fall 2017 to summer 2019 with sampling increased to every two weeks during summer 2018. For the three sites restored during this study, baseflow samples were collected pre- and post-restoration. Baseflow samples were collected every two weeks for several months preceding restoration. Baseflow sampling ceased during restoration, resumed every two weeks for at least three months following completion of restoration, and then continued on a monthly basis. At the six restored sites, samples were collected upstream and downstream of the restored reach. Samples were collected during several storm events at FMB in summer of 2019 and winter of 2020.
Baseflow samples also were collected at the regional reference sites. Discrete and high-frequency USGS data from PTRG were used to study storm events and calculate daily and cumulative annual loads for nitrate (NO3 −), total dissolved phosphorus (TDP), and TSS for 2014–2019. Regression models based on discrete samples were used to calculate high-frequency time series (for more details see supplementary information).
2.3. Water chemistry measurements and analyses
Temperature, pH, specific conductance (SC), and dissolved oxygen (DO) were measured in situ using a handheld meter calibrated <24 h previously. Baseflow samples were field-filtered using a pump and Geotech 0.45 µm Dispos-A-Pore filters. Storm samples were collected with an Isco autosampler, retrieved shortly after storms ended, and filtered in the laboratory using syringe filters (0.45 µM). Samples collected for analysis of alkalinity and of total dissolved nitrogen (TDN) and dissolved organic carbon (DOC) were collected with no headspace. Most samples were stored at 4 °C until analysis with some samples frozen until shortly before analysis for N and P speciation.
TSS concentrations were measured by filtration onto pre-rinsed and ashed filters [16]. Alkalinity is reported as HCO3 − concentrations and was determined by Gran titration with titrations performed with a Mettler Toledo G20 with a Rondolino autosampler; data quality were checked using a gravimetrically prepared standard. TDN and DOC (non-purgeable organic carbon) were measured with a Shimadzu TOC-CSN. Major ions and NO3 − were measured using a Dionex ICS 5000 ion chromatograph with two columns. Silica, NO3 − + NO2 −, NH4 +, PO4 3− (orthophosphate), and TDP were measured colorimetrically with a Seal AQ1 Discrete Analyzer. NIST-traceable check standards were used during analytical runs for TDN/DOC, major ions, and nutrients plus silica. If concentrations differed by >10% from expected, then results were double-checked via spot-checking with samples re-run as necessary.
All plotting and statistical tests were done in R [17–22]. Water chemistry data (concentrations and fluxes) were generally not normally distributed. Non-parametric Wilcoxon tests were used to determine if differences were statistically significant (p < 0.05) with unpaired tests run for comparisons between sites or years and paired tests runs for upstream–downstream comparisons at a single site.
3. Results and discussion
3.1. Baseflow nitrogen concentrations and loads
Baseflow nitrogen concentrations and daily loads were controlled primarily by land use (figures 2(a) and (b)) with restoration showing minimal effects. From the upstream to the downstream ends of the six post-restoration reaches, median baseflow nitrogen concentrations differed by <0.5 mg l−1 following restoration, and baseflow daily loads decreased significantly along the restored reaches only at the two sites where discharge also decreased. At the three sites with pre- and post-restoration data, baseflow nitrogen concentrations did not significantly change following restoration (figures 3(a) and (b)), and baseflow nitrogen daily loads increased significantly at two sites (figures 3(c) and (d)) due to record high precipitation in 2018. These baseflow results indicate little to no change in rates of denitrification or nitrogen removal by other in-stream processes for 1–5 years following restoration.
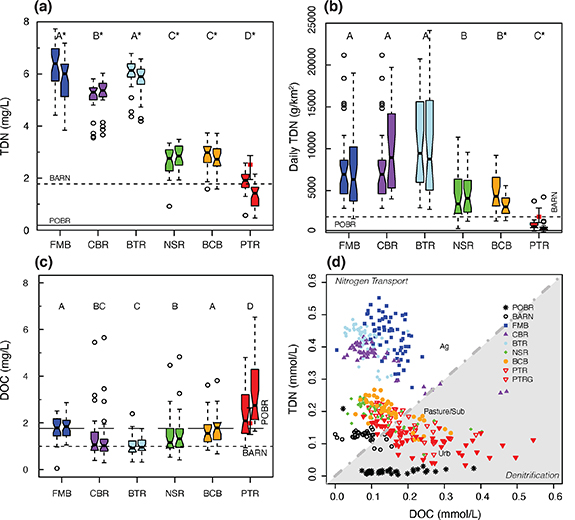
Figure 2. Post-restoration (a) total dissolved nitrogen (TDN) baseflow concentrations for the upstream and downstream locations (with upstream to left, as is the case for all paired boxplots in this figure) at the six restored sites with median concentrations at the regional reference sites shown with lines and PTRG as a smaller box set between the upstream and downstream for PTR. (b) Baseflow daily TDN loads for post-restoration baseflow samples. (c) Dissolved organic carbon (DOC) concentrations and (d) TDN versus DOC molar concentrations for all baseflow samples. The six restored sites in this and subsequent plots are ordered from highest to lowest agricultural land use. Notches in the boxplots display a confidence interval around the median; if notches do not overlap, then it is highly likely (∼95%) that the medians differ. An asterisk indicates significant differences between the upstream and downstream ends of restored reaches, and different letters indicate that the concentrations (or loads) at the downstream locations statistically differ among sites. The 1:1 line for TDN:DOC molar concentrations separates nitrogen transport (>1) or denitrification (<1) regimes. P statistics are in table S1, and median TDN values are in table S2.
Download figure:
Standard image High-resolution image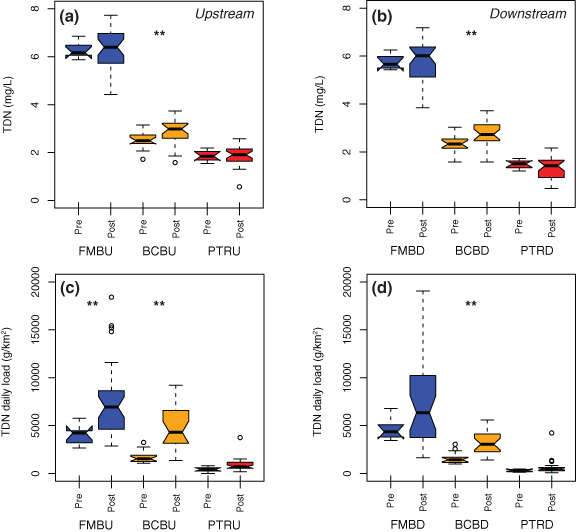
Figure 3. Pre- and post-restoration TDN at the (a) upstream and (b) downstream ends and TDN daily loads (watershed area normalized) at the (c) upstream and (d) downstream ends of the study reaches. Significant differences between pre-restoration and post-restoration are indicated with ** (p statistics in table S1). Nitrogen concentrations and loads show significant decreases from upstream to downstream for BCB and PTR (table S3).
Download figure:
Standard image High-resolution imageLand use was the primary driver of baseflow nitrogen concentrations and daily loads, which were lowest at the forested reference site and highest at the agricultural sites (figures 2(a) and (b)). The sites can be classified into four groups based on nitrogen concentrations. First, the lowest concentrations occurred in the forested watershed (POBR): <0.25 mg l−1 for TDN (figure 2(a); table S2). Second, the highly urban (PTR) and mostly forested, suburban reference (BARN) sites had median concentrations of 1.5–2 mg l−1 with nitrogen likely coming predominantly from sewer (PTR) or septic (BARN) systems and atmospheric deposition. Third, the active pasture (NSR), suburban/partially agricultural (BCB), and USGS urban reference (PTRG) sites had median TDN of 2.5–3.0 mg l−1 with likely nitrogen sources including agricultural activity such as fertilizer application (NSR, BCB) and septic (BCB) or sewer (PTRG) systems. Four, the three active cultivated crop agriculture sites (FMB, CBR, BTR) had median TDN of 5.4–6.0 mg l−1 with fertilizer application representing the primary nitrogen source.
Differences in baseflow discharge across the restored sites were minimal in most cases and thus had little effect on nitrogen concentrations or loads. While larger watersheds had higher baseflow discharge (figure 4(a)), specific baseflow discharge (normalized to watershed area) was similar across the restored watersheds with the exception of lower values at the highly urban PTR watershed (figure 4(b)). Baseflow differences did play an important role in controlling baseflow nitrogen loads between the upstream and downstream ends of restored sites and also from 2017 to 2018–19 for the three sites with pre- and post-restoration data (figure 4; tables S4 and S5).

Figure 4. (a) Median baseflow discharge and (b) specific median baseflow discharge (normalized by watershed area) by year for the downstream ends of each restoration site. Watershed areas (km2) are shown toward the top of (a). Median USGS discharge values for the baseflow sample collection dates and times in 2018–19 at the two regional reference sites. Complete annual precipitation and USGS gage data are in table S4. Median baseflow discharge values, including for upstream ends of sites, are in table S5.
Download figure:
Standard image High-resolution imageBaseflow differences between the upstream and downstream ends within sites were a primary driver of nitrogen loads. The four agricultural sites (FMB, CBR, BTR, NSR) had higher baseflow discharge at the downstream ends of restored reaches (though only significantly higher for FMB, p < 0.001; table S5). For the FMB and Beetree Run (BTR) sites, higher discharge at the downstream end resulted in similar nitrogen loads at the upstream and downstream ends despite small but significant decreases in nitrogen concentrations across the restored reaches (figures 2(a) and (b)). The Cabbage Run (CBR) and North Stirrup Run (NSR) sites also had similar nitrogen daily loads at the upstream and downstream ends due to similar or higher discharge and small but statistically significant increases in nitrogen concentrations from upstream to downstream. At the (sub)urban Bear Cabin Branch (BCB) and PTR sites, discharge decreases from the upstream to downstream ends (table S5), which were not statistically significant, did contribute to a statistically significant decrease in daily baseflow nitrogen loads (figure 2(b)).
The three sites with pre- and post-restoration data strongly indicate that restoration did little to change baseflow nitrogen since upstream to downstream differences, or lack of differences, remained the same post-restoration (figure 3). Baseflow nitrogen concentrations did not change following restoration at the upstream and downstream ends of the FMB and PTR sites and increased at BCB (figures 3(a) and (b)). Post-restoration baseflow nitrogen loads increased compared to pre-restoration loads at both the upstream and downstream ends of BCB and at the upstream end of FMB (figures 3(c) and (d)).
Changes in baseflow nitrogen concentrations and loads along the study reaches at these three sites, i.e. between the upstream and downstream ends, were similar before and after restoration. At all three sites, baseflow nitrogen concentrations were slightly lower (0.12–0.51 mg l−1) at the downstream ends both pre- and post-restoration (figures 3(a) and (b), table S3). At the agricultural FMB site, nitrogen loads were significantly different between upstream and downstream before restoration but not significantly different after restoration. At FMB, both concentrations and loads increased post-restoration, which corresponded with higher 2018 and 2019 baseflow discharge (figure 4). Both before and after restoration, daily loads for baseflow nitrogen were significantly lower at the downstream end of the study reaches for the (sub)urban BCB and PTR sites (table S5). Thus it appears that restoration did little to alter in-stream nitrogen cycling at these sites. While changes in denitrification rates may have occurred in the riparian zone and groundwater, they were not detectable in stream chemistry. At other restored Maryland sites, increased denitrification rates and lower nitrogen concentrations (albeit perhaps partially due to hydrology) were observed [11, 23]. Increases in nitrogen concentrations and especially loads due to high precipitation and baseflow have been previously observed in the region [24, 25]. These increases may arise from several sources: (1) an elevated water table flushing nitrogen from normally hydrologically-unsaturated portions of the shallow subsurface [26], restoration-associated changes such exposure of nitrogen-rich soils or other material, or (3) elevated nitrogen in riparian groundwater following tree removal [27].
3.2. Baseflow dissolved organic carbon, nitrogen speciation and cycling, and phosphorus
DOC, DOC:TDN ratios, and nitrogen speciation yield insights about why little denitrification or in-stream nitrogen removal occurs. Median DOC concentrations range between ∼1 and 2.7 mg l−1 and do not closely correspond to land use characteristics or N concentrations (figure 2(c)). Median DOC at the highly urban site is >2 mg l−1; at the other sites, DOC is 0.9–1.8 mg l−1. Median baseflow DOC:TDN ratios are lowest at the three cultivated crop sites, are ∼1 at the pasture and suburban restored sites, and >1 at the highly urban restored site (figure 2(d)). At baseflow, nitrate represents ∼100% of dissolved nitrogen at all sites except the forested reference site (POBR) where NO3 − is undetectable (figure S3(a)). Colorimetric analyses of NO3 − (or NO3 − + NO2 −) are equivalent to ion chromatography (figure S3(b)).
Carbon availability can limit denitrification, especially in agricultural or urban sites, e.g. when DOC is <2 mg l−1 or DOC to N ratios are <1 [4, 23, 28–31]. The extensive tree removal that is typically part of LSR/FR may further reduce carbon availability at these sites. Thus in-stream denitrification at restored cultivated crop sites is almost certainly limited by carbon availability and likely limited much of the time at the pasture and suburban restored sites. The pasture and (sub)urban sites are where in-stream denitrification may occur with some frequency based on DOC:TDN ratios. At the BCB and PTR sites, similar discharge at the upstream and downstream ends may indicate some groundwater exchange and interaction. By comparison, the four agricultural sites (FMB, CBR, BTR, NSR) appear to be gaining streams with higher discharge at the downstream ends (table S4). At the highly urban site (PTR), denitrification and/or nitrate removal may be indicated by the lowest DO observed at any site (figure S4(a)).
Baseflow orthophosphate (oP) concentrations were low with the restored sites and forested/mostly forested regional references having median concentrations at or below the detection limit of 0.005 mg l−1 following restoration (figure S5; table S6). A few sites (FMB, NSR, BCB, PTR) occasionally had concentrations of 0.005–0.020 mg l−1. The post-restoration median baseflow concentration at the upstream end of the agricultural FMB site was 0.007 mg l−1, which decreased to a median below detection at the downstream end. By contrast, median stormflow oP concentrations at FMB post-restoration are much higher at 0.461 and 0.254 mg l−1 for upstream and downstream, respectively (see section 3.4; table S6) At the three sites with pre-restoration data, the pre-restoration median oP concentration at FMB was much higher (0.03 mg l−1; table S6) following restoration (<0.005 mg l−1; table S6); concentrations showed no significant post-restoration change at BCB or PTR.
3.3. Baseflow non-nutrient chemistry
Non-nutrient chemistry reflects land use with the reference forested site (POBR) having much lower values than the other sites. Differences for most non-nutrient parameters typically were larger among sites than within sites. Median SC values and chloride concentrations illustrate cross-site differences (figure 5). SC and chloride median concentrations at the agricultural, suburban, and mostly forested reference sites were about an order of magnitude higher than the forested reference site (figure 5). Median SC and chloride were approximately another order of magnitude higher at the highly urban PTR site (see supplementary information for details on other parameters).

Figure 5. (a) specific conductance (SC) and (b) chloride boxplots for the downstream end of the six restored study sites at baseflow and the reference sites. Median values for the two regional references sites are shown as lines. The median SC value for the forested reference POBR is 28 µS cm−1.
Download figure:
Standard image High-resolution imageNon-nutrient chemistry is relevant since ecological lift is often a stream restoration goal. Elevated SC reflects elevated ion concentrations, a phenomenon sometimes called freshwater salinization syndrome [32]. Low ion concentrations at the forested reference site (POBR) represent regional background conditions to which pre-development aquatic organisms were adapted [33–36]. Agricultural and urban watersheds also have differing ion proportions, e.g. anions shift from being bicarbonate-dominated at the forested reference site to chloride-dominated at all other sites except FMB (figure S4(e)). Elevated, differing, and variable ion concentrations driven by land use represent a significant ecological stressor for aquatic organisms and thus affects post-restoration aquatic communities [37–43].
3.4. Post-restoration storm events at First Mine Branch (FMB)
Storm event concentrations of DOC, ammonia (NH4 +), orthophosphate, TDP, and TSS at post-restoration FMB were substantially elevated compared to baseflow concentrations (figure 6; table S7). Export of dissolved nitrogen and phosphorus along with TSS were somewhat lower at the downstream end than the upstream end, suggesting that the restored reach may successfully reduce area-normalized loads (figure 7). Storm event concentrations differ substantially from baseflow, including substantial increases in (1) ammonia from below detection to >1 mg l−1 (figure 6(a)), (2) DOC from ∼2.7 to 15 mg l−1 (figure 6(b)), (3) orthophosphate and TDP from close to the detection limit to 1.2–1.35 mg l−1 (figure 6(c)), and (4) TSS from near the detection limit (<10 mg l−1; table S7) to median and peak concentrations of 161 mg l−1 and 3450 mg l−1, respectively (figure 6(d); table S7).

Figure 6. Discharge and concentrations for the 11 July 2019 storm at First Mine Branch (active row crop) site for (a) dissolved nitrogen (TDN = total dissolved nitrogen), (b) dissolved organic carbon, (d) dissolved phosphorus (TDP = total dissolved phosphorus), and (c) total suspended sediment. Times are shown as Eastern Standard Time.
Download figure:
Standard image High-resolution image
Figure 7. First Mine Branch (FMB) storms, differences between upstream and downstream fluxes for (a) nitrate, (b) total dissolved phosphorus, (c) orthophosphate, and (d) total suspended sediments. Values greater than 0 indicate that the area-normalized flux is higher at the upstream end of the FMB site than the downstream end.
Download figure:
Standard image High-resolution imageTDN and NO3 − concentrations were diluted during storms, and so storm loads were similar to the high end of daily baseflow load. During storms, TDN and NO3 − showed hysteresis with maximum dilution at, or just after peak discharge, and then a slow increase on the falling limb (figure 6(a)). Ammonia concentrations showed less hysteresis and were mostly closely associated with peak, and thus overland, flow. The TDN concentration decrease was smaller than NO3 −, which is partially explainable by increased NH4 + concentrations (figure 6(a)). The mixture of nitrogen species during storms indicates an important role for surface/near-surface event water contributions of NH4 + and organic N in storm export in contrast to all nitrogen being present as nitrate in baseflow (figure S3(a)).
Dissolved carbon and phosphorus appeared to be contributed both from overland flow and quickflow subsurface pathways (e.g. interflow) while TSS was likely associated predominantly with overland flow. DOC and phosphorus concentrations displayed hysteresis with an abrupt increase until peak discharge or just after and then subsequent slow decrease (figures 6(b) and (c)). The slow decrease on the falling limb suggests contributions from interflow or other (shallow) subsurface pathways that reach the stream more slowly than overland flow. In contrast, TSS showed little hysteresis with the highest concentrations, and thus fluxes, associated with peak, or near peak discharge (figure 6(d)).
Paired comparisons of area-normalized export for nitrogen, phosphorus, and TSS at the upstream and downstream end of FMB across three storm events indicate small load reductions along the restored reach (figure 7). The peak reduction in nitrogen load (300–350 g km−2) was <5% of integrated storm load and ~5% of the daily baseflow load (6343 g km−2) at the downstream end of FMB. Similarly, peak stormflow reductions for dissolved phosphorus were relatively small. Integrated across the storms, the reductions ranged from 10% to 37% between the upstream and downstream ends, which was similar to the observed reductions in specific (or area-normalized) discharge. These results are positive but only suggestive without pre-restoration storm data or additional post-restoration data.
A few factors may contribute to smaller loads at the downstream end. Peak phosphorus and TSS are higher at the upstream end for the three storm events while peak discharge is similar between the upstream and downstream ends (figures 6 and S6). With similar peak discharge between upstream and downstream but a 32% larger watershed area at the downstream end (table 1), area-normalized exports would be expected to decrease.
More substantial reductions at FMB might be achieved during larger storm events. The engineered bankful capacity at the restored site was 2.83 m3 s−1, and though the upper end of the rating curve was not well constrained, the high-frequency discharge data suggest bankful capacity was exceeded six times from late April 2019 to mid-June 2020, which is undoubtedly more frequent inundation than occurred pre-restoration. Unfortunately, none of these storms were sampled.
3.5. Upscaling—storm events downstream of the Plumtree (PTR) restoration
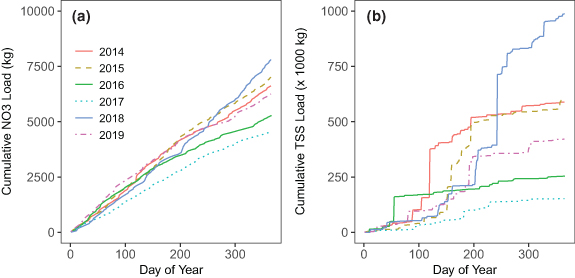
The USGS site (PTRG) downstream of the highly urban restored site (PTR) was used to investigate the larger-scale effects of the mid-2017 PTR restoration. Similar to FMB, NO3 − is diluted as discharge increases while TSS and TDP show flushing behavior (figure S7). At PTRG, TSS concentrations and discharge peak at about the same time. Based on high-frequency time series, annual loads for NO3 − varied by <2× while annual loads for TSS varied by >7.5× (figure 8; table S8); TDP behaved similarly to TSS (figure S8(a)). Annual load rankings for NO3 −, TDP, and TSS are the same (table S8 and are highly correlated with median annual discharge (R2 = 0.94, 0.84, and 0.82, respectively). NO3 − export increases relatively consistently through the year while TSS and TDP export shows substantial increases over brief periods indicating the importance of storm events (figure 8). Predominantly baseflow-driven NO3 − export and event-driven TSS and phosphorus export also is observed elsewhere in the region [2, 44–46].
Figure 8. Annual cumulative loads by day of the year at Plumtree Run (PTRG) for (a) nitrate and (b) total suspended sediments (TSS). Annual load values for these and other parameters are reported in table S8.
Download figure:
Standard image High-resolution image
Additionally, six paired pre- and post-restoration storm events were investigated based on similar precipitation intensities. Five of the six post-restoration events had higher loads for NO3 −, TSS, and TDP with three post-restoration events having TSS and TDP loads that were 3.8–17 times higher than similar pre-restoration events (table S9). Higher post-restoration event loads are likely due to 2018 and 2019 being high precipitation and discharge years. It is not surprising that the effects of the PTR restoration were not seen downstream given the small reductions observed at FMB. Though the restored reach for the highly urban PTR site represented ∼15% of the watershed draining to PTRG, high variability in annual export obscured the larger-scale effects of stream restoration.
3.6. Implications
Assessing effectiveness of stream restoration projects is challenging: (1) pre-restoration data are commonly unavailable, (2) collecting sufficient data to accurately characterize changes in fluxes and loads is time-intensive and expensive, (3) many years may elapse before the desired outcomes of restoration are observable due to legacy inputs and/or the time needed to establish key biogeochemical processes, and (4) stream restoration responses may be obscured by weather/climate variability [25, 47]. For example, high retention and removal rates at one Mid-Atlantic restoration resulted in decreased flow-weighted mean concentrations of most constituents, but loads did not significantly decrease for NO3 − and TSS [48]. Additionally, for constituents with reduced loads, the effects of restoration in that same study were not detectable ∼600 m downstream except for orthophosphate.
The Chesapeake Bay Program grants regulatory credit to stream restoration projects upon completion via three relevant protocols with each being annual and additive [49]. Protocol 1 Prevented Sediment during Storm Flow credits sediment and nutrient reduction based on prevented bank or channel erosion. Protocol 2 Instream and Riparian Nutrient Processing During Baseflow credits nitrogen reductions based on design features promoting denitrification during baseflow. Protocol 3 Floodplain Reconnection Volume credits sediment and nutrient reduction for reconnecting stream channels to floodplains.
Removal of erodible bank and floodplain deposits that were 1–2.5 m thick at the study sites via LSR/FR restoration likely resulted in decreased TSS loads and associated particulate nitrogen and phosphorus, suggesting that Protocol 1 was addressed. In mid-Atlantic Piedmont watersheds, bank sediments supply much of the suspended load [12], e.g. 6%–90% (average 57%) in Baltimore County, MD and 30%–65% in Big Spring Run [14, 50]. Substantial decreases in TSS concentrations and a 69% decrease in TSS loads with accompanying total phosphorus decreases were observed at Big Spring Run, ∼50 km northeast of the study region [50]. Among the first LSR restorations, Big Spring Run has a high-frequency data record from multiple USGS gages for 3 years pre-restoration and four years post-restoration. At another Piedmont LSR/FR site, TSS fluxes increased during restoration with the restoration period extending across the 2018–2019 high discharge years (no post-restoration data available, 51).
We found little evidence for decreased post-restoration nitrogen concentrations or fluxes resulting from denitrification or other biogeochemical processes (Protocol 2). Results were similar at the Big Spring Run LSR/FR restoration where NO3 − concentrations increased (though not significantly) and orthophosphate remained unchanged [50]; groundwater NO3 − concentrations began decreasing 4–5 years post-restoration with carbon accumulation as an important factor [52]. At a Piedmont site with a similar study period (2017–19), NO3 − concentrations decreased slightly but fluxes increased during restoration; orthophosphate did not change [51]. A Piedmont site with observed post-restoration nitrogen reductions had initially low nitrogen concentrations (similar to the (sub)urban BCB and PTR sites), and reductions may have resulted from a combination of denitrification and lower nitrogen inputs to restored reaches [11]. At Mid-Atlantic sites with substantial post-restoration denitrification, large amounts of carbon were added during restoration and multiple lines of evidence pointed to denitrification, e.g. nitrate decreases accompanied by ammonia and dissolved organic nitrogen increases and low DO at times [2]. By contrast, baseflow nitrogen in this study was entirely nitrate and remained so following restoration.
Other post-restoration factors may contribute to increased denitrification with time. Denitrification may increase in the lower post-restoration floodplains due to increased carbon inputs from more frequent inundation or by a water table closer to the surface. Terrestrial vegetation biomass, and thus carbon inputs, on restored floodplains should increase with time.
Lags between restoration completion and improved water quality are common, especially in agricultural watersheds. Time is needed to establish sufficient rates of biogeochemical processing. Legacy nutrients in soils and groundwater may take years to decades to reach streams [4, 47, 53, 54]. Legacy contributions (older than 1 year) represent 50% of nitrogen exported by the Susquehanna River, and 18% is older than 10 years [55].
We have insufficient data to determine the success of changes related to Protocol 3 for FR. Achieving success related to this protocol may be challenging, particularly in urban watersheds. In five urban Piedmont watersheds, much of the water accessing the floodplain during overbank events occurred in during large events (50% of floodplain flow during 2–3 events per year), resulting in 0.2%–1% of nitrogen retention or removal by Protocol 3 [56].
Results of this study suggest some positive outcomes of LSR/FR stream restoration. Future research on LSR/FR or similar projects should likely focus on data collection related to sediment erosion prevention and FR (Protocols 1 and 3). Pre- and post-restoration high-frequency data collection for discharge and sediment transport would greatly facilitate answering questions related whether these protocols are successfully addressed. Groundwater sampling would be useful for addressing Protocols 2 and 3, but changes may take several years to emerge, especially related to baseflow nutrient processing.
Acknowledgments
This work was supported by a Restoration Research grant (#13974) from the Chesapeake Bay Trust (VBB, RAC, CJS, JM) and partially by the National Science Foundation ICER-1540631 (JM). We gratefully acknowledge Caroline Stanley, Colin McGill, Scott McGill, and others at Ecotone, Inc. for their assistance in site selection without which this project would not have been possible, for connecting us with property owners to gain site access, and for their willingness to share site design plans and other relevant information. The authors thank Ginny Jeppi, Chris Manning, and Michael Dawson for assistance in the field and laboratory along with Mark Monk for invaluable support with laboratory procedures and instrumentation. The authors thank the two reviewers for their feedback and are particularly grateful to Dr Rod Lammers for his helpful and detailed comments.
Data availability
Will be publicly available through Dryad.
The data that support the findings of this study are available at the following URL/DOI: https://datadryad.org/stash/.