


Abstract
Low-carbon pathways consistent with the 2 °C and 1.5 °C long-term climate goals defined in the Paris Agreement are likely to induce substantial co-benefits for air pollution and associated health impacts. In this analysis, using five global integrated assessment models, we quantify the emission reductions in key air pollutants resulting from the decarbonization of energy systems and the resulting changes in premature mortality attributed to the exposure to ambient concentrations of fine particulate matter. The emission reductions differ by sectors. Sulfur emissions are mainly reduced from power plants and industry, cuts in nitrogen oxides are dominated by the transport sector, and the largest abatement of primary fine particles is achieved in the residential sector. The analysis also shows that health benefits are the largest when policies addressing climate change mitigation and stringent air pollution controls are coordinated. We decompose the key factors that determine the extent of health co-benefits, focusing on Asia: changes in emissions, urbanization rates, population growth and ageing. Demographic processes, particularly due to ageing population, counteract in many regions the mortality reductions realized through lower emissions.
Export citation and abstract BibTeX RIS

Original content from this work may be used under the terms of the Creative Commons Attribution 4.0 license. Any further distribution of this work must maintain attribution to the author(s) and the title of the work, journal citation and DOI.
1. Introduction
The central goal of the Paris Agreement—adopted in 2015 by the United Nations Framework Convention on Climate Change—is to intensify global efforts to mitigate risks of climate change by keeping a global temperature rise within century well below 2 °C relative to pre-industrial levels, and to push further towards strategies to limit the rise in temperature below 1.5 °C [1]. Literature shows that reaching the Paris targets will require a major transformation of the energy and land-use systems. Specifically, it implies several or all of the following: (a) reaching net zero carbon dioxide (CO2) emissions globally around the middle of the century and simultaneous deep cuts in emissions of non-CO2 greenhouse gases (GHGs); (b) restructuring the energy system through demand reductions, decarbonization of power and fuel supply, electrification of energy end-use, (c) major reductions in agricultural GHG emissions, (d) possibly removal of CO2 from the atmosphere, (e) and societal changes towards low demand patterns for land- and GHG-intensive goods. The transformations required to reach the 1.5 °C target need to be more rapid than for a 2 °C target [2, 3].
Numerous studies have pointed out that stringent GHG-mitigation strategies as outlined above may induce substantial co-benefits for air pollution and associated health impacts, and that the potential for synergies grows with the ambition level of the carbon mitigation targets [4–12]. The quantification of implications of climate strategies for air quality (AQ) is particularly relevant for policy makers due to severe impacts of air pollution on human health, which currently accounts worldwide for the most health damaging burden associated with environmental pollution [13]. The health risk posed by air pollution impacts both urban and rural communities, with the total mortality burden from indoor and ambient air pollution being fifth behind dietary, high blood pressure, tobacco and diabetes risks [14].
Recent estimates suggest that about 5–7 million premature deaths worldwide are attributable to exposure to ambient and indoor air pollution annually (about equally shared), whereby emerging economies in Asia suffer the most [13, 15–19]. The World Health Organization (WHO) Guideline [14] reports that only <10% of the global population are currently exposed to levels of air pollution that do not pose a significant risk to their health. While ambient air pollution is especially severe in some of the fastest-growing urban regions, around three billion people globally continue to depend on burning solid fuels in their homes for cooking and heating, resulting in very high levels of indoor air pollution. In 2013, it was estimated that exposure to ambient and indoor air pollution cost the world's economy some US$ 5.11 trillion in welfare losses [20].
Studies quantifying the impacts of 2 °C mitigation pathways on air pollution and health [6, 9, 21, 22] conclude that health co-benefits are substantial in terms of decreased exposure levels, premature mortality or abatement costs. Newer comparisons indicate that mitigation pathways consistent with 1.5 °C would result in even stronger synergetic effects for air pollution compared to pathways that are consistent with 2 °C [23–26]—e.g. that worldwide health benefits over the century for 1.5 °C pathways could be in the range of 110–190 million fewer premature deaths compared to 2 °C pathways [24]. Consistently across the literature sources, the synergies for air pollution are highest in the developing world, particularly in Asia [27–29], although the demography-related factors were not explicitly analyzed. In addition to significant health benefits, there are also economic gains and cost savings from the emission mitigation that are related to reduced mortality/morbidity and environmental impacts [12, 30], as well as to lower emission control costs. McCollum et al [31] estimated reductions in the cumulative investment needs in air pollution control technologies by about 35% globally until 2030 in 1.5 °C pathways.
In this paper we advance the ongoing research by a robust multi-model comparison of air pollution impacts of 1.5 °C and 2 °C pathways in combination with changing bottom-up assumptions on AQ policies in an internally consistent modelling framework. To fill lacking insights from the aforementioned literature on the role of future demographic processes, using a novel decomposition approach we highlight impacts of underlying mid-term population dynamics in the climate mitigation scenarios for the resulting health co-benefits. In this analysis, air pollution and associated cost impacts are quantified and reported globally, whereas Asia and individual Asian countries are a focus domain for the assessment of health impacts.
The structure of the paper is as follows: in the methodology section the set of modelling tools employed in this study is described together with the key assumptions behind the scenarios under examination. The next section summarizes modeling results in terms of sector- and region-specific changes in the emission levels and pollution control costs. Thereafter, co-benefits are quantified for the ambient AQ and for associated mortality impacts. Health implications of the decarbonization pathways are analyzed further by decomposing key drivers responsible for changes in the future number of premature deaths. Discussion and conclusion sections summarize the modeling insights and policy messages derived from this study.
2. Methods
Air pollution related implications of climate pathways are computed using the GHG–Air Pollution Interactions and Synergies (GAINS) model [32], whereby the underlying projections of activity in the energy system originate from five global integrated assessment models (IAMs):
- (a)AIM/CGE (Asia-Pacific Integrated Model) [33],
- (b)IMAGE (Integrated Model to Assess the Global Environment) [34],
- (c)MESSAGEix-GLOBIOM (Model for Energy Supply Strategy Alternatives and their General Environmental Impact—Global Biosphere Management Model) [35],
- (d)REMIND-MAgPIE (Regional Model of Investments and Development) [36],
- (e)WITCH-GLOBIOM (World Induced Technical Change Hybrid) [37].
Technical documentation for each model is summarized in the supplementary information (SI) (available online at stacks.iop.org/ERL/16/045005/mmedia) and can also be found in [38]. Energy scenarios corresponding to respective climate targets have been produced by IAMs in the form of aggregated energy balances. For this study, these have been converted into the GAINS structure following the downscaling procedures reported by [4, 21, 39]. Each of the models has a different geographical resolution, therefore the data conversion followed a spatial mapping of IAMs and GAINS regions. Mapping matrices for activity variables and regions used for a linkage between IAMs and GAINS are provided in SI. Further details on individual IAMs as well as on the scenario design are provided in an interactive Scenario Explorer [40].
Once implemented in GAINS, the activity projections form a basis for the calculation of emission trajectories, pollution control costs, concentration levels and associated health impacts. The GAINS methodology [32, 41] allows for quantification of the drivers, mechanisms and impacts of emissions, and explores options for reducing impacts on health or environment. Projections of future economic activity and energy use are derived from individual IAMs and agricultural production projections originate from the Food and Agriculture Organization of the United Nations (FAO) [42]. Current emissions are estimated based on international activity statistics, with emission factors reflecting local conditions in 180 regions/states/provinces worldwide.
The GAINS model allows for simulation of impacts of various strategies to control air pollution. The current legislation (CLE) strategy assumes country- and sector-relevant policies and measures that are already adopted today or have been announced as intended policies. For those that have been announced, the extent and timing of their implementation is assessed according to the prevailing institutional, political and economic circumstances. On the other hand, the maximum feasible reduction (MFR) strategy assumes highest feasible application rates for the most efficient abatement technologies and policy practices to reduce pollutant emissions. It implies that—for example in the 1.5 °C-world—the energy investment decisions take into account air pollution and climate goals at the same time, in order to avoid undesired lock-in effects and reduce the overall costs of compliance. Details on CLE and MFR control strategies are discussed in [21, 43] and in supplementary information (S4).
Through the implementation in GAINS it is possible to quantify impacts of low carbon pathways for the overall air pollution abatement costs. Within the GAINS cost concept, the model computes incremental expenditures needed to install and operate the add-on abatement technologies/measures such that countries comply with their respective AQ legislation. The expenditures on emission controls are differentiated into investments, fixed operating costs, and variable operating costs. Some of the cost- and technology-characteristics are common for all countries, including removal efficiencies, unit investment costs, fixed operation and maintenance costs, variable cost components like extra demand for labor, energy, and materials. A 4% discount rate is used to annualize the investment cost over the lifetime of control equipment. The calculation routine takes into account several country-specific parameters, for instance, average boiler sizes, capacity/vehicles utilization rates, emission factors [32, 44]. Because GAINS computes additional costs of air pollutant abatement, the cost parameters in GAINS are not harmonized with those used by IAMs and do not enter their respective cost functions.
Considering several hundred reduction options, their impacts on ambient AQ and population exposure are computed for both urban areas and surrounding rural regions, based on the results of the European Monitoring and Evaluation Programme atmospheric chemistry and transport model (for more details see chapter 2 of [27]). A linear approximation of the full model is used to estimate ambient fine particulate matter (PM2.5) from emissions of primary PM (PPM) and secondary PM precursors (SO2, NOx , NH3, VOC) on a 0.5° × 0.5° grid. To adequately represent elevated concentrations in cities, a downscaling of PPM concentrations is done for urban areas with a population >100 000 in 2010 [45]. Here, PPM concentrations arising from low-level sources are re-distributed within the grid cell proportional to the emission density, based on a regression between emission and concentration increments. Although high concentrations of other pollutants, such as ozone and nitrogen oxides, are also known for their health impacts we focus on PM2.5 which is the pollutant with the largest impact on human mortality [46, 47].
Health impacts from exposure to PM2.5 in ambient air are quantified following the method adopted by the WHO for the 2016 Global Burden of Ambient Air Pollution study [48]. Premature deaths are calculated as attributable fraction of total disease- and age-specific deaths for five diseases: ischemic heart disease, chronic obstructive pulmonary disease, stroke, lung cancer, and acute lower respiratory infections. The population attributable fraction ( ) of air-pollution related deaths from disease
  in country
  and age
  are calculated as
where  represents the grid cells hosting population
  belonging to country
  .
.  is the disease and age specific relative risk as calculated from the integrated exposure response functions (IERs) for PM2.5 concentration levels in the respective spatial unit (grid cell). IERs correspond to those developed by the GBD 2013 assessment (updated from [49]) and used in the WHO 2016 Burden of Ambient Air Pollution study [13]. Premature deaths (pd) attributable to ambient PM2.5 exposure are calculated by multiplying the
  from equation (1) with age specific baseline cases of deaths
  from disease
  in country
  :
:

Baseline age specific mortality projections are taken from UN World Population prospects (2010 edition) [50], to which age specific shares of disease contributions to total deaths in 2010 are applied as estimated by the Global Burden of Disease (GBD) 2013 analysis [16, 47]. We assume that while total age-specific deaths vary according to the UN projections, the relative shares of individual diseases contributing to age-specific deaths remain unchanged in the future. The analysis in this study is restricted to premature mortality and does not address the morbidity impacts of pollution. Furthermore, impacts of indoor air pollution are not considered in this assessment.
Several factors determine the trends in premature deaths—in particular, there is an interplay between changes in emissions driving ambient concentrations, and changes in population structure which in many cases lead to more people in vulnerable high-age groups. To explain the modelled trends of PM2.5-related health impacts over time (t) and across the different scenarios, we separate contributions from emission changes, from urbanization, and from demographic changes (population growth and ageing). Writing the total (relative) change of annual PM2.5 related deaths  from 2015 to 2050 as
We can separate each of these determining multiplicative factors  . A series of sensitivity calculations was conducted for this purpose, in which all possible combinations of 2015 and 2050 values were used for the different input parameters emissions (emiss), urbanization rate (urb), population size (popgrowth), population age structure (ageing). The relative change in premature deaths between 2015 and 2050 was then evaluated for each parameter (n) and each scenario individually, with the other parameters left constant and set to all possible combinations, to derive different versions
  of each factor
  in scenario
  and country
  , (
, ( is a running index over the six possible settings of the other parameters). Owing to the complexity of the health impact calculations, it is not self-evident that it is possible to use a formulation with independent (commutative) factors as in equation (3). However, we find that the values of
  are quite stable across all such combinations
  —in other words, the factors are independent of each other—and thus we can use their averages
  as robust indicators to describe the relative influences of the different determinants.
2.1. Scenarios
Five scenarios examined in this study include the National Policies (NPi) scenario that considers the current energy and climate policies adopted by G20 countries up to 2030 with an equivalent carbon emission mitigation effort thereafter. This scenario serves as a reference in this study. Nationally Determined Contributions (NDC) assumes implementation of country specific NDCs by 2030, with a continuation of equivalent global climate action after 2030. Well Below 2 Degrees (2 °C) and Toward 1.5 Degrees (1.5 °C) aim at limiting the increase in global average temperature to 2 °C and 1.5 °C above the pre-industrial level, over the period until 2100. The NPi, NDC, 2 °C and 1.5 °C scenarios are combined with a set of air pollution policies that allows for a compliance with the CLE for air protection in each country. The fifth scenario −1.5 °C + MFR—assumes the same climate target as in the 1.5 °C case, while to achieve the MFR in air pollutants the best available technologies and abatement measures are applied. All scenarios listed above are based on the SSP2 'middle-of-the-road' narrative for future societal developments described in detail in [51]. Assumptions for each scenario are summarized in table 1 and further information is reported by [31, 52] and CD-LINKS Scenario Explorer [40].
Table 1. Definition of scenarios.
| ACRONYM | Climate policies | Air pollution policies |
|---|---|---|
| NPi | National Policies until 2030, equivalent effort thereafter | Current legislation |
| NDC | National Policies until 2020, after which implementation of Nationally Determined Contributions (NDCs) until 2025/2030, equivalent effort thereafter | Current legislation |
| 2 °C | National Policies until 2020, as of 2020 staying within 1000 GtCO2 budget for 2011–2100 period, corresponding to a >66% chance of staying below 2 °C throughout 21st century | Current legislation |
| 1.5 °C | National Policies until 2020, as of 2020 staying within 400 GtCO2 budget for 2011–2100 period, corresponding to a >66% chance of staying below 1.5 °C in 2100 | Current legislation |
| 1.5 °C + MFR | As in 1.5 °C | Maximum feasible reduction |
As the key focus of this paper are implications of climate mitigation strategies and demographic trends on air pollution related impacts, we do not provide descriptions of the evolution of energy systems in each model and the resulting CO2 trajectories, however, underlying projections including socioeconomic drivers, are accessible in [40] and in SI (S5).
3. Results
3.1. Global trends in selected air pollutant emissions
In this section, we focus on the future trajectories of three key air pollutants that are main contributors to ambient PM2.5; primary particulate matter (PM2.5) and precursors of secondary PM (SO2 and NOx ). Owing to the current AQ legislation, emissions of all three pollutants remain flat or decline by 2030 in the NPi scenario (figure 1), but without further air pollution controls or more stringent climate policies subsequently increase for SO2 and NOx towards 2050. Increase in emissions of primary PM2.5 by 2050 is less pronounced for all models. Emissions in the NDC scenario are lower than in NPi, however, the growing trend beyond 2030 remains comparable to the reference. Significant decline of emissions, relative to NPi, is observed in the 2 °C scenario, and the reductions are even greater in the 1.5 °C case, reaching about 20% to 40% for SO2 and NOx , and about 10% to 30% for PM2.5, relative to 2015. Ranges in the emission reductions achieved by the five models are larger for SO2 and NOx as compared to PM2.5, indicating significant differences in restructuring of the energy systems across models. Combining the 1.5 °C climate target with the MFR controls strategy brings about a rapid decline of each pollutant (70% to 80%) by 2030 and this reduction is maintained until 2050. Emissions in the 1.5 °C + MFR scenario represent the low end of emissions levels in this modeling exercise (red line in figure 1—maximum reductions across models). This illustrates that a combination of stringent climate policy and air pollution control measures results in the highest AQ benefits.
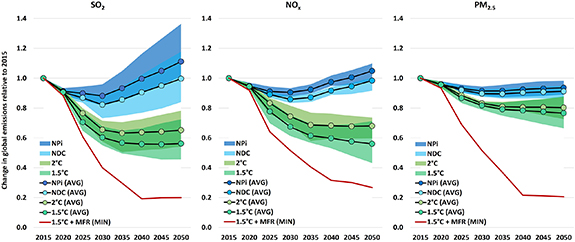
Figure 1. Ranges and averages of global projected change in emissions of three PM2.5 precursors for different scenarios, relative to 2015.
Download figure:
Standard image High-resolution imagePollutant-specific reductions in the emission levels relative to 2015 are displayed in figure 2 in relation to the changes in CO2 emissions in the period up to 2050 in order to illustrate effects of climate- versus air pollution-policies. Three scenarios are depicted: 2 °C, 1.5 °C and 1.5 °C + MFR. In the first two cases with the CLE assumptions, differences in relative reductions for SO2 and NOx reflect the structural changes in individual models under the 2 °C/1.5 °C climate targets (fuel mix changes, efficiency measures, demand reductions). It is observed that the relative changes for PM2.5 are less pronounced and differences across IAMs are smaller because of lesser impacts of low carbon strategies on key PM-sources (e.g. households). The combination of 1.5 °C pathway with MFR strategy results in relative reductions that are nearly proportional to the CO2 decline until 2040 but they are attenuated thereafter, in the period 2040–2050, by when the key polluting sources, such as fossil fired power plants, are practically eliminated from the energy system.
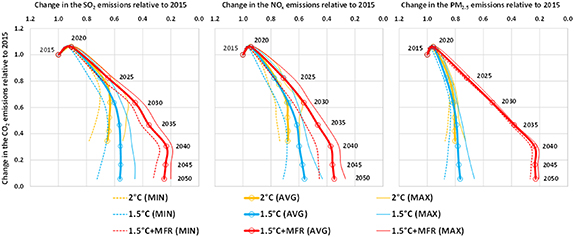
Figure 2. Ranges of global reductions in SO2, NOx and PM2.5 relative to the average CO2 reductions in comparison to the year 2015, in 2 °C, 1.5 °C and 1.5 °C + MFR scenarios, for the period 2015–2050.
Download figure:
Standard image High-resolution imageDifferent emitting sectors contribute to the changes in emission levels for each pollutant. Sectoral contributions to the emission reductions induced by the climate policies as computed in GAINS for the five models are depicted in figure 3. For SO2, the power and industry sectors are the dominant sources of emission cuts due to a rapid phasing out of fossil fuels from the energy mix by 2050. Transport contributes the largest share of the reductions of NOx in all models except WITCH, which shows significantly lower transport activity and also NOx emissions already in the NPi scenario with a reduced need for electrification in the 2 °C and 1.5 °C scenarios. The dominant source of PM2.5 emissions across all models and scenarios in 2050 is biomass burning in the residential sector. However, this sector is less affected by climate policies as compared to other sources—except for REMIND, which projects the strongest reduction in residential biomass use. In some cases (particularly for IMAGE) emissions even increase due to a higher biomass demand in the 2 °C and 1.5 °C scenarios. On the other hand, the adoption of the MFR measures combined with the 1.5 °C structural changes in 2050 results in rapid PM2.5 declines in each model, where the industry, residential and other sources (i.e. waste, agriculture) play the key role in the abatement process.
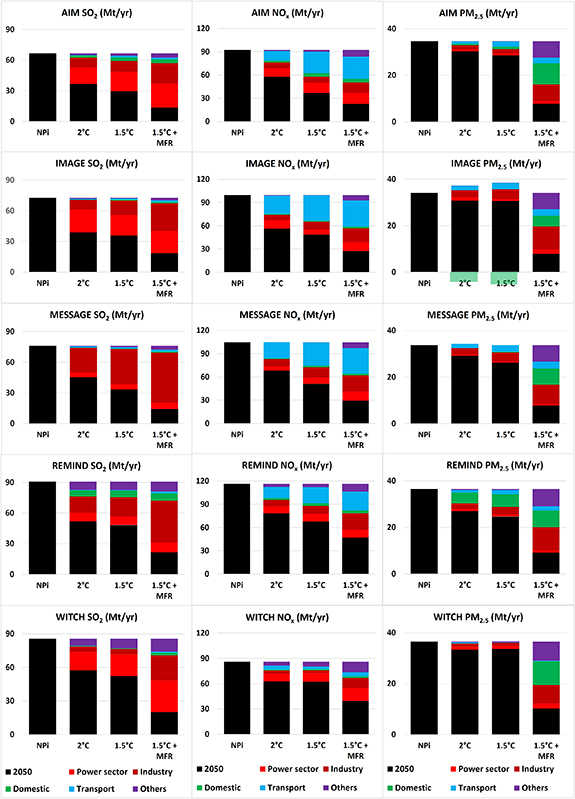
Figure 3. Contribution of sectors to global emission reductions (colored bars) by models and climate policy scenarios in 2050 relative to NPi. Black bar represents the remaining emissions in each scenario.
Download figure:
Standard image High-resolution imageThe co-benefits of climate strategies for abating air pollutants are significantly larger in the developing world compared to the industrialized regions (figure 4). Besides the structural differences of the economies, this is also associated with the existing air pollution policies and regulations that affect the overall mitigation potential originating from the decarbonization of the energy system in all regions. The common pattern emerging from our simulations is that Asian countries account for the largest share of emission reductions in absolute terms, followed by the Middle East and Africa. An exception is the SO2 abatement reported for the WITCH and MESSAGE model, where the reforming industrialized economies (REF) achieve higher reductions when compared to other IAMs. It is noted that in per capita terms, reductions by regions converge over time.

Figure 4. Contribution of regions to the emission reductions (colored bars) by models and climate policy scenarios in 2050 relative to NPi. The black bar represents the remaining emissions in each scenario. OECD = the OECD 1990 countries, EU members/candidates; ASIA = Asian countries except the Middle East, Japan and Former Soviet Union states; LAM = Latin America and the Caribbean; MAF = Middle East and Africa; REF = Reforming Economies of the Former Soviet Union. Regions definition is provided in SI (S6).
Download figure:
Standard image High-resolution image3.2. Cost impacts
In the NPi scenario, the abatement cost reach 0.7–0.95 trillion EUR (€) in 2050, while this cost is reduced by 25% to 50% in the 2 °C scenario and to 40% to 70% in the 1.5 °C scenario combined with the CLE assumptions. As can be seen in figure 5, the dominant share of cost savings is reported for the transport sector, followed by power generation and industry. The cost co-benefits are significantly reduced in the 1.5 °C + MFR case due to an adoption of more costly measures, which in addition control air pollution not directly impacted by the climate target (e.g. industrial processes and waste).
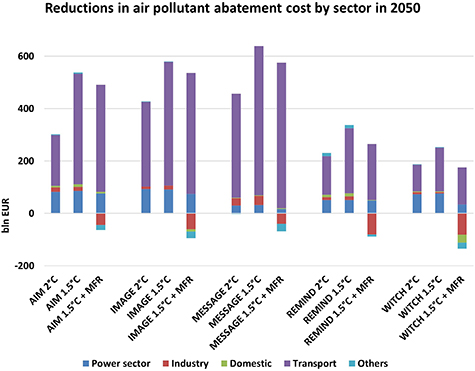
Figure 5. Reductions in air pollutant abatement cost in climate policy scenarios by sector in 2050, relative to the NPi scenario.
Download figure:
Standard image High-resolution imageCost implications of the selected low carbon scenarios are illustrated further in figure 6, where the savings in control costs are plotted in relation to the CO2 abated in 2050 for each IAM. For three models (AIM, IMAGE, MESSAGE), these reductions are quantified in average at about 10€/tCO2 to 12€/tCO2 for 2 °C and 1.5 °C scenarios, respectively. Cost savings (as well air pollutant emission reductions) for the other two models (REMIND, WITCH) are comparatively smaller (5–6 €/tCO2), which is explained by a combination of lower transport demand reductions and favorable fuel mix changes in the transport sector relative to NPi that in turn results in less co-benefits under mitigation strategies. Adoption of the MFR strategies over the 1.5 °C target (the red square in the graph) reduces the cost gains between 20% (AIM) to 80% (WITCH).

Figure 6. Left panel: Reductions in global air pollution control cost in 2050 per ton of CO2-abated by scenario and model, relative to NPi. Right panel: Share of air pollution control cost in global GDP in 2050 by scenario and model.
Download figure:
Standard image High-resolution imageIn the right panel of figure 6, the total air pollution control costs are shown as a fraction of global gross domestic product (GDP). In the NPi scenario, the adoption of end-of-pipe measures cost 0.6%–0.8% of GDP in 2050, while these expenditures are reduced in average to 0.3%–0.4% in 1.5 °C and 2 °C scenarios. The implementation of MFR controls leads to overall increase in air pollution control costs that partially offset the cost co-benefits induced by the decarbonization of the energy system. However, economic benefits could be significantly greater if the effects of lower mortality are monetized and internalized in the cost calculations [53, 54].
3.3. Impacts on AQ
For quantifying impacts on ambient PM2.5 concentrations and related mortality, we focus on Asia due to the high policy relevance for that region. This allows for a more detailed analysis of country level differences in a very diverse world region which contains several countries ranking among the highest ambient PM2.5 exposures worldwide. Figure 7 illustrates calculated PM2.5 concentrations for the year 2015, projected concentrations in NPi for 2050, as well as reductions under 1.5 °C and 1.5 °C + MFR scenarios (based on results for MESSAGE) in 2050. The highest concentration levels in 2015 and in 2050 (NPi) are estimated for the Indo-Gangetic plain in northern India, northeastern China, and parts of Pakistan and Afghanistan. Contrary to the first two regions, where the concentrations drop in 2050 is evident in 1.5 °C and even more so in 1.5 °C + MFR scenarios, the high concentrations in Western Asia, as well as parts of Northern China and Mongolia, are mostly influenced by wind-blown dust. Therefore, concentrations in these areas do not decrease noticeably even under strong cuts of anthropogenic emissions as in the 2050 policy scenarios.
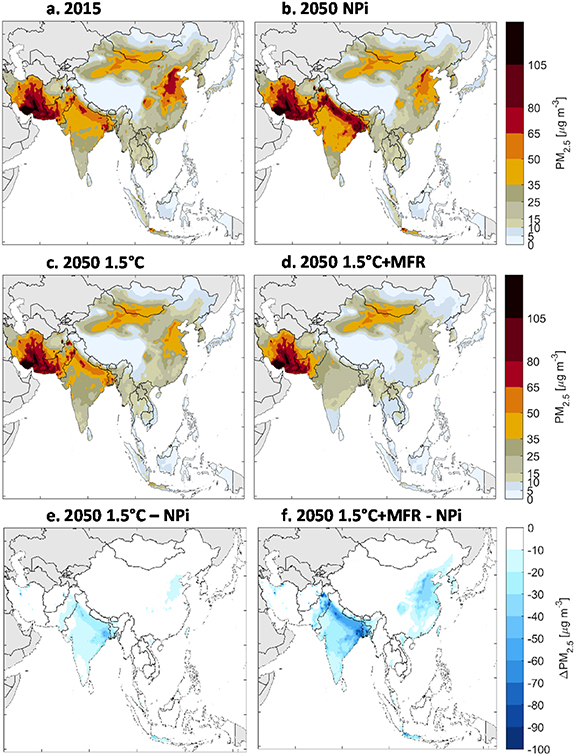
Figure 7. Modelled ambient PM2.5 concentrations due to natural and anthropogenic sources in Asia, 2015 (a), 2050 under the NPi, (b) 1.5 °C, (c) and 1.5 °C + MFR (d) scenarios, as well as reductions in 2050 under 1.5 °C (e) and 1.5 °C + MFR (f) scenarios as compared to NPi (MESSAGE model).
Download figure:
Standard image High-resolution imageHowever, most of these arid areas that show up as PM2.5 hot spots are very sparsely populated and thus play little role for overall population exposure, whereas some of the urban pollution hot spots hardly show up on a regional map because they are too small in size. Hence, the population exposure distribution as shown in figure 8, resulting from an overlay of grid concentrations with population on the same grid, is more telling about the shares of population exposed to different levels of ambient PM2.5 concentrations. In particular, it gives a clear indication of the fraction of population exposed to PM2.5 levels exceeding either national ambient AQ standards, or the WHO AQ guideline [55]. This aspirational guideline recommends a maximum annual mean concentration of PM2.5 at 10 μg m−3 and introduces a set of interim targets towards improved AQ: Interim target-1 (25–35 μg m−3), Interim target-2 (15–25 μg m−3) and Interim target-3 (10–15 μg m−3).
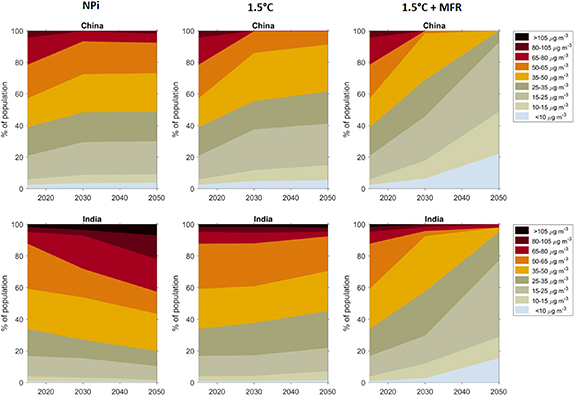
Figure 8. Population exposure distribution to PM2.5 in China and India, projected for the NPi, 1.5 °C, and 1.5 °C + MFR scenario (MESSAGE model) until 2050.
Download figure:
Standard image High-resolution imageIn 2015, <2% of the population in China and India lived in areas with AQ complying with the WHO guideline and <40% of people were exposed to concentrations below 35 μg m−3 (figure 8). By 2050, without climate policies, the situation even worsens in India. In the 1.5 °C scenario, the share of population exposed to concentrations below 35 μg m−3 increases to 60% in China and 45% in India. In the 1.5 °C + MFR case, about 20% people enjoy AQ adhering to the WHO AQ guideline (<10 μg m−3) in both countries, and nearly the whole population is projected to live within or below the Interim target-1 concentrations. Since this figure refers to total PM2.5 concentrations including natural dust, achieving the WHO guideline for the entire population is not feasible even under strictest emission cuts.
Exposure to PM2.5 increases the likelihood to die from several diseases. One commonly used measure of health impacts of ambient air pollution is the absolute number of annual deaths attributable to this risk factor. Figure 9 shows the trends of annual premature deaths over time for different scenarios, alongside with population weighted mean concentrations and mortality rates per capita. A striking feature is that for most countries the projected premature mortality (in absolute terms) in 2050 shows strong increases over 2015, even under constant or decreasing emissions/concentrations. Only the most ambitious decarbonization pathway in conjunction with the strictest controls reach substantive decreases in absolute premature deaths. Compared to NPi scenario, the 1.5 °C + MFR case results in 1 million people less dying prematurely (−40%) due to air pollution in China and India combined. Across the Asia domain, this reduction is approximately 2.5–3 million cases or 40% to 51% depending on the IAM used. In the case of Japan, it is observed that under the 1.5 °C + MFR scenario, concentrations drop to very low levels (∼5 μg m−3), leading to disproportionally strong and rapid decreases in mortality due to the non-linear shape of the dose-response functions applied in this study.

Figure 9. Population-weighted average PM2.5 concentrations, mortality rate due to air pollution per year and 10 000 population (right axis), and premature deaths attributable to ambient PM2.5 (left axis), as estimated in GAINS for different countries in Asia in 2015 and 2050 by scenario (MESSAGE model).
Download figure:
Standard image High-resolution image3.4. The role of demographic changes in the projected health impacts
When analyzing future projections of premature mortality associated with AQ, caution is needed in the interpretation of trends over time. To understand the reasons behind apparently counter-intuitive results discussed above, we seek to disentangle the different drivers of changes, using as an illustrative example the changes from 2015 to 2050 in terms of total numbers of deaths attributed to ambient PM2.5 exposure. The variations of PM2.5 precursor emissions under different scenario assumptions have been described in section 3.1. In addition to the pure emission related changes, however, demographic changes play a major role. While emissions determine the spatial distribution of ambient PM2.5, exposure is given by ambient PM2.5 times population, so a changing population pattern through urbanization results in different exposure. If we quantify absolute numbers of premature deaths, the absolute size of the population matters. Finally, population ageing results in more people in vulnerable age groups with high baseline mortality rates, and therefore higher attributable numbers of premature deaths.
As described in section 2, we decompose the relative change in premature deaths between 2015 and 2050 for each scenario  and each country
  into four independent factors
  related to emission changes, population growth, urbanization, and population ageing. Figure 10 shows results of the decomposition analysis. Each of the parameters
  is displayed for a range of countries and all scenarios. While the emission trends differ strongly across scenarios and countries (panel a), the influence of the demographic factors—urbanization, population growth and population ageing—is almost independent of the emission scenario, as the scenario assumptions do not vary these parameters. Impacts of demographic factors (panels b–d), in particular population ageing, are typically positive and show a strong variability across countries. While population growth in its own can be eliminated by analyzing trends in mortality rather than absolute deaths, it is remarkable that in several countries the effect of population ageing on PM2.5-related mortality (panel d) is much larger than the combined effects of decarbonization and emission control policies.

Figure 10. Modelled changes from 2015 to 2050 in total annual premature deaths attributable to ambient PM2.5 (panel e) into different factors: (a) emission changes, (b) urbanization, (c) population growth, (d) population ageing. The range between different IAMs is shown as bars, different scenarios are indicated as colors.
Download figure:
Standard image High-resolution image
4. Discussion
In agreement with earlier scenario literature [56–58], we project substantial co-benefits for abating air pollution as a result of deep decarbonization transformations of the energy sector. However, our multi-model assessment suggests that low carbon pathways alone will not be sufficient to provide the majority of highly impacted population—in particular in Asia—with AQ complying with the WHO standards. As suggested by [27, 39, 41], to achieve this objective, a mix of policies is needed which combines targeted end-of-pipe controls, instruments for clean energy access, as well as the whole range of carbon mitigation measures. At the same time, potential tradeoffs such as reoccurrence of biomass use for cooking and heating in households—as a result of higher prices for cleaner combusting fuels [59]—should be avoided due to its negative impacts on outdoor as well indoor AQ.
Our results emphasize the importance of strict emission controls for reducing the health burden on population. However, we note that even decreasing emissions and associated PM2.5 concentrations can be over-compensated by increasing vulnerability of an ageing population. At the same time, while absolute numbers of premature deaths may be a useful indicator to compare health impacts between emission scenarios at a given point in time, caution is needed when analyzing them over time, as demographic factors potentially play a strong (even dominant) role. To further complicate the situation, the calculation requires projected disease specific baseline mortality rates which are inherently uncertain and strongly dependent on assumptions. In our calculations, we assume the relative contributions of individual diseases to total deaths within each age group to remain constant over time.
By this analysis, we intend to highlight the sensitivity of the calculations to the demographic development, rather than generating a precise forecast of numbers of premature death. Absolute numbers of premature deaths are uncertain estimates for several reasons—not least the exposure–response relationships (ERRs) used, of which several versions have been developed in recent years [13, 49, 60, 61]. For China, recent studies [62–64] report significant uncertainties from PM2.5 exposure, ERR parameters and baseline death rates (95% confidence interval approx.  in [63]), as well as large differences in absolute premature deaths calculated with different sets of ERRs. The IERs used in our study lead to estimates of premature deaths at the lower end of the range, while in particular the Global Exposure Mortality Model [61] leads to systematically higher numbers (+70% in China [63]). Here, we do not aim to undertake a full uncertainty analysis but rather quantify the importance of different factors for trends projected over time.
The sensitivity to demographic factors induces rather counter-intuitive trend results in several regions: that decreasing emissions are still associated with increasing premature deaths. Few options remain to circumvent it: Most straightforwardly, forgoing the premature death calculation altogether, the analysis could stop at the quantification of population weighted mean PM2.5 concentrations, or exposure distribution. Though perhaps more robust, these indicators may not be satisfactory for analyses targeting human health. Secondly, we note that the difficulties arise from analyzing time series. When comparing emission scenarios at one given point in time, this issue is avoided. Thirdly, if the evolution over time should be analyzed, the attributable fraction of total deaths seems a more suitable measure than the absolute number of premature deaths.
5. Conclusions
This paper summarizes implications of low carbon pathways consistent with objectives of Paris Agreement for the air pollution and associated health impacts from the multi-model perspective. Trajectories of key air pollutants derived from five IAMs under the 1.5 °C and 2 °C climate targets show strong declining trend relative to current emission levels as well as in comparison to the moderate reductions achieved by the NDC mitigation policies. By 2050, primary PM2.5 and precursor emissions decline by about a third in the low-carbon scenarios, compared to 2015. These reductions more than double when decarbonization policies are combined with ambitious air pollution controls. Furthermore, in the 1.5 °C + MFR scenario, the total reductions in air pollutants and CO2 are nearly proportional by 2040, following structural changes in the global energy system simulated by IAMs.
The contribution of air pollution emitting sectors to the overall emission reductions is pollutant specific. Power sector and industry are most important for the abatement of the sulfur emissions, while the road-transport sector plays the key role in reducing emissions of NOx . Biomass combustion in residential sector is a major source of primary PM2.5 pollution, however, this source is less impacted by climate strategies. The risk of tradeoffs in this sector needs to be addressed by a mix of measures comprising clean energy access policies as well as accelerated deployment of efficient cooking and heating devices. The scenario analysis indicates that the emerging Asian countries, followed by Africa and Middle East, might benefit the most from air pollution cuts brought about through GHG mitigation. At the same time, the potential co-benefits depend on the rate of implementation and enforcement of AQ legislation and emission standards.
Implementation of add-on controls to curb air pollutants at levels complying with the CLE will cost global economy little <1 trillion Euros by 2050, which corresponds to about 0.6%–0.8% of global GDP (depending on model-specific assumptions). Decarbonization of the most polluting sectors invoke halving of these expenditures, nevertheless, the economic co-benefits are less pronounced if the most efficient (and costly) technologies are applied without any cost considerations. Savings in pollution abatement cost per carbon removal achieved by individual models and scenarios in 2050 range between 5 and 12 €/tCO2, and it is expected the co-benefit values would be even higher if the gains from lower mortality are monetized and accounted for [12, 30].
Emission changes affect concentrations of ambient PM2.5, which we analyze here for Asia. While details differ across IAMs, the trends in different scenarios are robust. In most regions, NPi leads to a stagnation or even increase of ambient PM2.5 concentrations, while the stronger mitigation scenarios result in ever greater decreases of ambient PM2.5. The 1.5 °C + MFR scenario decreases premature deaths by 40%–50% across Asia, compared to NPi. However, absolute numbers of premature deaths are a difficult indicator to interpret, particularly when compared over time. Demographic factors and the assumptions about disease-specific baseline mortality in the projections may well dominate changes of calculated absolute premature deaths over time, resulting in some cases in seemingly counter-intuitive increases of premature deaths, despite decreasing ambient concentrations. These point to the higher vulnerability of ageing populations and emphasize the need for strong emission cuts if absolute numbers of premature deaths from PM2.5 exposure are to be decreased.
Future analysis will focus on quantification of global co-benefits when climate mitigation and pollution control are realized using the cost optimization framework of the GAINS model, assessment of the synergies achievable in non-energy sectors (i.e. industrial processes, waste treatment, agriculture), impacts for indoor air pollution, and finally impacts on other pollutants (e.g. O3, NH3) and related human and environmental indicators.
Acknowledgments
The authors acknowledge funding provided by the European Union Horizon 2020 research and innovation programme under Grant Agreement No. 642147 ('CD-LINKS') and No. 821471 (ENGAGE). SF is supported by the Environment Research and Technology Development Fund (JPMEERF20202002) of the Environmental Restoration and Conservation Agency of Japan and The Sumitomo Foundation.
Data availability statement
All data that support the findings of this study are included within the article (and any supplementary files).