

Abstract
Climate change is projected to increase the aridity of semi-arid ecosystems, including Mongolian grasslands (MG), which provide ecosystem services that support food supply and pastoralist lifestyle. Here, we conducted a grid-scale (0.5° × 0.5°) probabilistic risk assessment of MG under climate change for 40 years (1976–2015) based on probability theory. We evaluated changes of risk (impacts) and vulnerability of MG to drought between the recent two decades R20 = 1996–2015 and the previous two decades P20 = 1976–1995. The risk is quantified as the product of the probability of hazardous drought and ecosystem vulnerability. The probability of hazardous drought is defined from the Standardized Precipitation–Evapotranspiration Index. Vulnerability is defined as the expected differences of key ecosystem variables between years with and without hazardous conditions. The ecosystem variables are productivity (peak aboveground biomass, net primary productivity, and leaf area index) and root-zone plant-available soil moisture, simulated with a process-based vegetation model Organizing Carbon and Hydrology in Dynamic Ecosystems-Grassland Management validated with field observations of biomass and soil moisture. Results reveal that MG experienced more frequent hazardous droughts with rapid warming and slight drying during R20 aggravated by ever-increasing grazing intensity (34% compared to P20), which resulted in a reduction in soil water availability and grassland productivity, particularly in northeastern areas (20%–65%). The risk of drought to productivity increased by 10% between P20 and R20 over extended areas, particularly in northcentral and northeast Mongolia. The increase in the risk to MG was mainly caused by climate change-induced increase in the probability of hazardous drought and, to a lesser extent, by the increasing vulnerability. Recent droughts modify the risk to grasslands, particularly in northcentral and northeast Mongolia, suggesting that these regions need strategic management for both adaptation and ecosystem conservation to cope with climate change impacts.
Export citation and abstract BibTeX RIS

Original content from this work may be used under the terms of the Creative Commons Attribution 4.0 license. Any further distribution of this work must maintain attribution to the author(s) and the title of the work, journal citation and DOI.
1. Introduction
Climate change poses many challenges to global ecosystems, including grasslands, from increasing droughts and heatwaves, projected to become more frequent and intense [1–5]. Occupying approximately one-quarter of the Earth's land area, grasslands contribute to the feed base for grazing livestock, and food supply and livelihoods of more than 800 million people [6–8]. Their critical ecosystem services include biodiversity reserves and carbon sequestration [9, 10]. Despite the importance of grasslands, there is mounting evidence that droughts and heatwaves may significantly affect the productivity and stability of grasslands [11–13] and potentially have feedback on atmospheric carbon dioxide (CO2) concentrations and climate [14].
Encompassing ∼2.6% of the global grasslands [15, 16] and ∼80% of Mongolia's territory (figure 1(a)) [17, 18], Mongolian grasslands (MG) have been used by pastoralists for thousands of years [19]. Now it supports ∼70 million livestock and livelihoods of 29% of all working-age Mongolian population, contributing to ∼15% of national GDP [20, 21]. However, little attention has been paid to the climate-change-driven risks to MG. In recent decades, MG is facing widespread and frequent droughts [13, 22, 23] and warming [24], together with increasing grazing pressure due to the rapidly growing livestock population since the 1990s following socio-political changes [20, 25, 26]. This, in turn, affected the pastoralists' livelihoods and food security in Mongolia, who rely directly on grassland production [27]. For instance, in the 2000s, an increase in the frequency and severity of climate disasters (dzuds in Mongolian) caused massive livestock mortalities, which are caused by a combination of droughts and severe winters with extreme cold and heavy snowfall, limiting the availability and accessibility of pasture for livestock, thereby leading to high livestock mortality, often from starvation [20, 28].
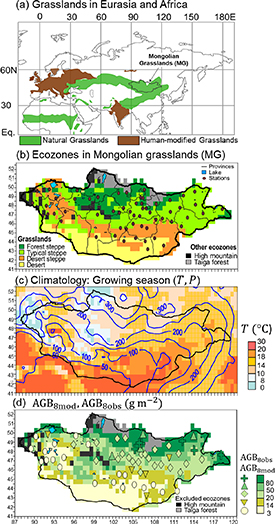
Figure 1. (a) Grasslands in Eurasia and Africa, including MG (adapted and modified from 16 to 17, 18): Grassland without trees is the vegetation climax over most of the area (green) and human-modified grasslands (brown). (b) Ecozones (colored cells) and locations of stations (biomass and soil moisture measuring, brown dots) in Mongolia. (c) Climatology (1983–2015) of the growing season (May–August) total precipitation (P, mm) and mean air temperature (T, °C). (d) Averaged (2000–2015) ground-observed AGB8obs (g m−2, colored symbols) with the modeled AGB8mod (g m−2, background colors).
Download figure:
Standard image High-resolution imageClimate change-related risk assessment provides science-based information for risk management and decision-making. The terminology about climate risks is not always consistent and depends on impacted variables [5, 29–32]. Risks for ecosystems have generally been assessed using generic variables [33, 34] given the lack of knowledge of ecosystem functioning thresholds [35, 36]. Under the United Nations [37], risk analyses were developed by distinguishing hazard, vulnerability, and risk. Hazard is defined as the probability of a potentially damaging phenomenon within a given period and area. Vulnerability refers to the sensitivity of the impacted system to those damaging conditions. Risk is commonly defined as an expected loss induced by hazardous conditions and calculated as the product of hazard and vulnerability. This framework is widely used in natural hazard and disaster risk reduction studies [30, 38]. To facilitate quantitative analysis, recent studies [36, 39] made a further distinction between hazard as the potentially damaging phenomenon itself and the probability of the hazard occurring. The risk is zero if the likelihood of hazard or vulnerability is zero, and risk is only large when both components are large. A similar definition was recently used by the Intergovernmental Panel on Climate Change [5] as risk = probability of events or trends × consequences [5, 12, 31]. These definitions were primarily set up to facilitate risk analysis for hazards threatening human life, but they can be operational for ecosystem modeling. Furthermore, risk assessment has been based on historical data—assessing probabilities of hazards and impact based on experience from past events [20, 39–41].
Probabilistic risk assessment (PRA) is frequently applied in ecology [42–44]. For quantitative risk analysis, recent studies promoted an ecosystem-focused PRA [36, 39], which can decompose the risk into two constituent terms. The PRA is designed to analyze the effect of an environmental variable (e.g. drought) on any system variable (e.g. carbon flux). 'Hazardous conditions' as those where the environmental variable is more extreme than a given threshold. Vulnerability is the difference between expectation values for the system variables under non-hazardous and hazardous conditions. As is commonly done, the risk is defined as the expectation of loss: the difference between the system variable's actual average and its value under continuously non-hazardous conditions [36, 39].
Previous studies investigated the impacts of droughts on MG at a site level or regional level, including monitoring [22, 45, 46], experiments [23, 47], and model-based research [18, 22]. However, a national-level analysis of climate change impacts on MG and associated risks and vulnerabilities is still not available to decision-makers with sufficient regional details to guide adaptive grassland management at the level of ecozone or administrative units. Understanding present climate risks is a more appropriate basis for developing adaptation strategies to manage future climate risks than simply collecting baseline climate data and perturbing that data using climate change scenarios [40]. Applying the PRA framework at a grid cell level (0.5º resolution) over MG, this study aims to quantify the recent (R20 = 1996–2015) drought risks (impact) to the MG by comparing with the preceding years (P20 = 1976–1995).
Firstly, we examine changes in the probability of extreme drought (hazardous) under climate change. Then, how does climate change affect the vulnerability of ecosystems to such extreme conditions will be examined. We focus on four ecosystem variables, including productivity (AGB8: aboveground biomass at the end of August, close to its yearly maximum; ANPP: aboveground net primary productivity for May−September; LAI8: leaf area index for August) and root-zone plant-available soil moisture for June−August (W0−50).
2. Data and methods
MG ecosystems include four main major ecozones of forest steppe, steppe, desert steppe, and desert (figure 1(b)), focusing on this study. The northern regions are covered by forested mountain ranges (dry sub-humid climate). The southern area is covered by desert steppe at lower elevations with a warmer and arid climate (figure 1(c)). In general, the growing season begins in late April and continues to mid-September, peaking in late August [48]. The predominant plant community of typical MG is characterized by C3, cool-season plant species [49].
2.1. Risk framework
2.1.1. PRA and its applications
Adapting the PRA framework [36, 39], we refer to the environmental variable (drought in this study), which may or may not attain hazardous conditions as ' ', and to the ecosystem variables at risk as '
 '. Numerically, the risk is defined as the expectation of ecosystem loss, i.e. the amount by which average ecosystem performance is less than it would be under continuously non-hazardous conditions.

where  is the overall expected value of the ecosystem variable and
  is the expectation value of the
  variable when conditions are not hazardous. Hazardous conditions are defined as those where the drought is more extreme than a given threshold, and their probability of occurrence is denoted as
  . Quantitatively, vulnerability is the difference in expected ecosystem variable between non-hazardous (good) and hazardous (bad) drought conditions:
Finally, the  is the product of the probability of hazardous conditions and the ecosystem's vulnerability:

Equations (1) and (3) are mathematically equivalent, giving exact estimates of risk. A detailed description of PRA implementation is provided by [36].
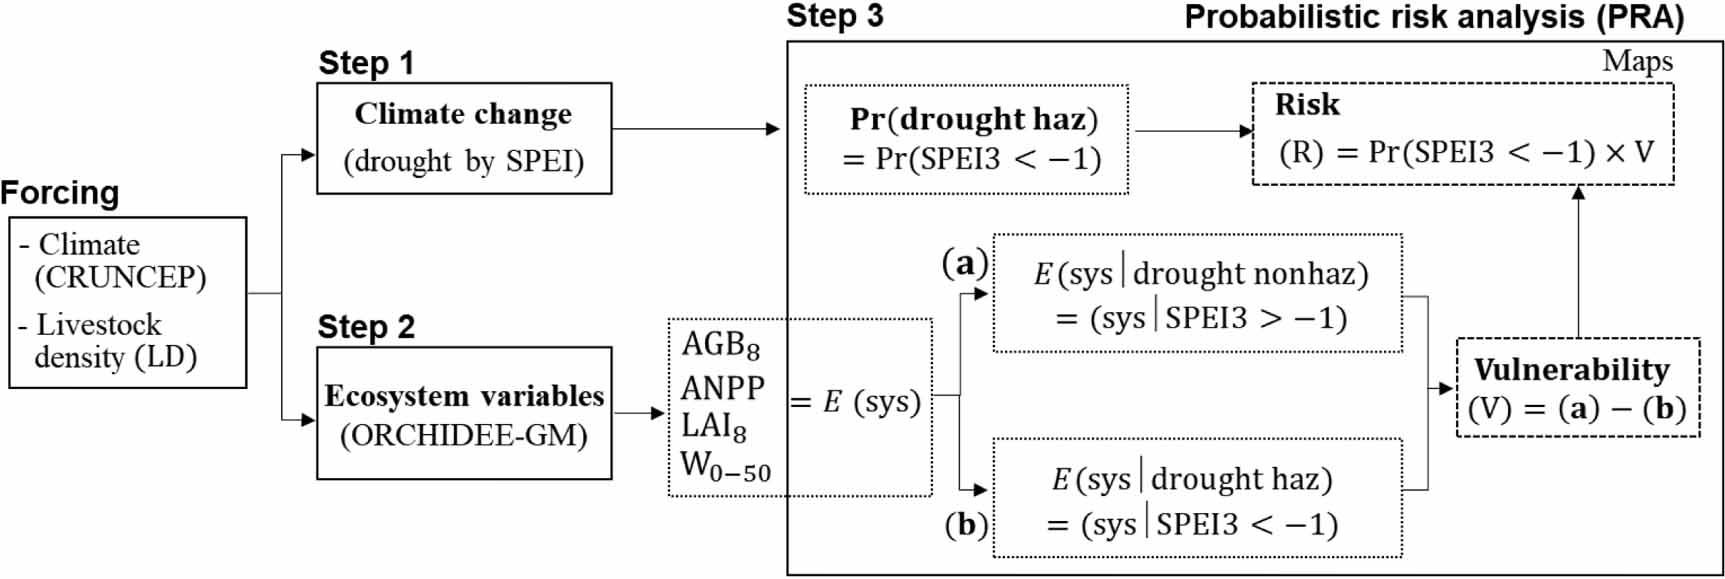
Here, the risk analyses are conducted in three consecutive steps (figure 2). In Step 1, the probability of drought in summer (June−August) is calculated from the Standardized Precipitation–Evapotranspiration Index (SPEI) for a 3 month timescale (SPEI3). Hazardous conditions are defined as SPEI3 being lower than −1.  is calculated as the fraction of the 20 years in each period with SPEI3 <−1. In Step 2, ecosystem variables (AGB8, ANPP, LAI8, and W0−50) were simulated with a process-based vegetation model ORCHIDEE-GM (Organizing Carbon and Hydrology in Dynamic Ecosystems-Grassland Management). Finally, in Step 3, we quantified the PRAs for each variable (in absolute values) in each grid cell for R20 and P20, respectively. The various expectation values
  are calculated from the frequency distribution of
  values over the 20 years. Vulnerabilities and risks are calculated based on equations (2) and (3) (Step 3).
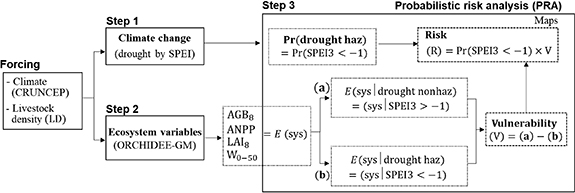
Figure 2. Risk framework: in Step 1, climate change-induced drought conditions calculated by the SPEI model with forcing of CRUNCEP climate data; in Step 2, ecosystem variables in MG (AGB8, ANPP, LAI8, and W0–50) simulated by ORCHIDEE-GM model with forcing of climate CRUNCEP and livestock density (LD) data. Finally, PRAs (Step 3) are performed using outputs of Steps 1 and 2, respectively. The probability of hazardous drought, Pr(drought haz), is defined as SPEI3 <−1.0 and their probability of occurrence. E(sys|drought nonhaz) and E(sys|drought haz) is the expected value of the ecosystem variables when conditions are non-hazardous (SPEI3 >−1.0) and hazardous (SPEI3 <−1.0).
Download figure:
Standard image High-resolution image2.1.2. SPEI
The SPEI quantifies the degree of drought as a function of the difference between precipitation and potential evapotranspiration, and thereby it accounts for the impact of warming [50]. We calculated SPEI using monthly air temperature and precipitation from gridded CRUNCEP data [51] for 1971–2015. Here, we used SPEI3, the spanning critical growing season (June–August) months (supplementary section 1).
2.1.3. Ecosystem model
AGB8, ANPP, LAI8, and W0−50 were simulated by the ORCHIDEE-GM model (version 3.2) [52, 53]. ORCHIDEE-GM has been developed to explicitly represent grassland management, including grazing [53, 54]. Its management module originated from PaSim, a grassland model developed initially for site applications [55]. The model can be forced by observed livestock density (LD) for grazing or can calculate the optimal densities and practices that maximize the use of ecosystem productivity. A detailed description of the model can be found in [53, 54].
We applied ORCHIDEE-GM over the Mongolian spatial domain (41°−52.25° N, 87°−121° E) using the 6-hourly CRUNCEP climate data at 0.5° × 0.5° spatial resolution for 1901–2016. In this study, we used the simulations for 1971−2015. Observed livestock number for grazing intensity in sheep unit (SU) ha−1 and associated daily feed requirement (1.4 kg dry matter day−1 SU−1) [28] was prescribed to the model. We considered that all grid cells were covered by C3 grasses (dominant plant functional type in MG). We used the 12 USDA texture classes provided at a global 0.08° resolution [56] and upscaled these to the resolution of the atmospheric dataset for soil texture. Only the dominant texture type for a grid cell was used at the 0.5° resolution for defining soil hydraulic parameters [57] in the model. The grazing period was determined in the model by biomass availability, snow, and soil conditions [54, 55].
The model was first to run for a spin-up without management using the first ten years of the climate (1901–1910) cycled in a loop, and atmospheric CO2 concentration for 1900 (296 ppm) until all carbon pools reached equilibrium (long term net ecosystem exchange = 0 at each grid point). This first spin-up usually takes 10 000 years. Then the model was run over MG for 1901–2016, forced by observed increasing atmospheric CO2 concentration, variable climate, variable nitrogen deposition, and variable LD. The LD is assumed to be constant during 1901−1970 with the same LD as that of 1971. The model results were evaluated against observations of AGB8, NDVI6–8, and W0−50 over MG (supplementary section 2). The result suggests that ORCHIDEE-GM could reproduce spatial and temporal variations of soil moisture and the productivity of grasslands (figure S1 (available online at stacks.iop.org/ERL/16/034035/mmedia)). Moreover, the ability of ORCHIDEE-GM to simulate the responses AGB8 to extreme droughts (2002 and 2007) has been evaluated by validating against observations of AGB8 and Normalized Difference Vegetation Index for June–August (NDVI6–8). We found spatially consistent losses of the modeled AGB8 and observed AGB8 and NDVI6–8 in 2002 and 2007 (figure S2). Results indicate that modeled drought effects exhibit a substantial variability, ranging from nearly 30% to 60% reduction in AGB8 relative to the observed AGB8.
2.2. Data
2.2.1. Climate data
We used the CRUNCEP (version 7) [51] six-hourly gridded climate data (air temperature, precipitation, relative humidity, pressure, long-wave radiation, and wind speed) at 0.5° resolution during 1901–2016, which is a combination of the annually updated CRUTSv3.24 monthly climate dataset [58] and NCEP reanalysis [59] (supplementary section 3). Additionally, we used monthly temperature and precipitation from 69 stations distributed across Mongolia (figure 1(b)) during 1976–2015 to assess climate change conditions compared to the CRUNCEP datasets.
2.2.2. LD data
Livestock numbers at the soum (administrative unit) level of Mongolia during 1971−2015 were obtained from the National Statistical Office of Mongolia (NSO), as counted annually in December [60]. Every December, the NSO conducts an annual census of horses, cattle, sheep, goats, and camels in Mongolia. These data were converted into SU to standardize feed requirements as each type of livestock requires different amounts of feed (supplementary section 4). This LD in SU distribution was then aggregated to the 0.5°grid used by the ecosystem model.
2.2.3. Ground and satellite observations
For model validation, we used ground-measured AGB8 on 25 August in grazing areas at 66 stations for 2000–2015 and satellite-derived monthly grided (0.5° × 0.5°) Moderate Resolution Imaging Spectroradiometer NDVI6–8, which derived from the 16 d 0.05° × 0.05° spatial resolution MOD13C1 dataset during 2000–2015 [61] (Supplementary section 5). The locations of the sampling stations are shown in figure 1(b). To validate modeled W0−50, we used 10 d measurements of W0−50 at 23 stations for 1983–2011, which were collected from the upper 50 cm of the soil layer, representing the typical rooting zone of MG [48].
3. Results
Modeled AGB8 showed a latitudinal gradient that corresponds to gradients of temperature and precipitation during May −August (figure 1(c)) with southward and westward decreasing precipitation and increasing temperature, consistent with modeled and observed AGB8 (figure 1(d)). Regions with higher AGB8 were found in north and eastern forest steppe and steppe ecozones. In contrast, desert steppe in southwestern and southern arid regions had lower values of AGB8 due to low precipitation (drier soil) and warmer temperature (figure 1(c)).
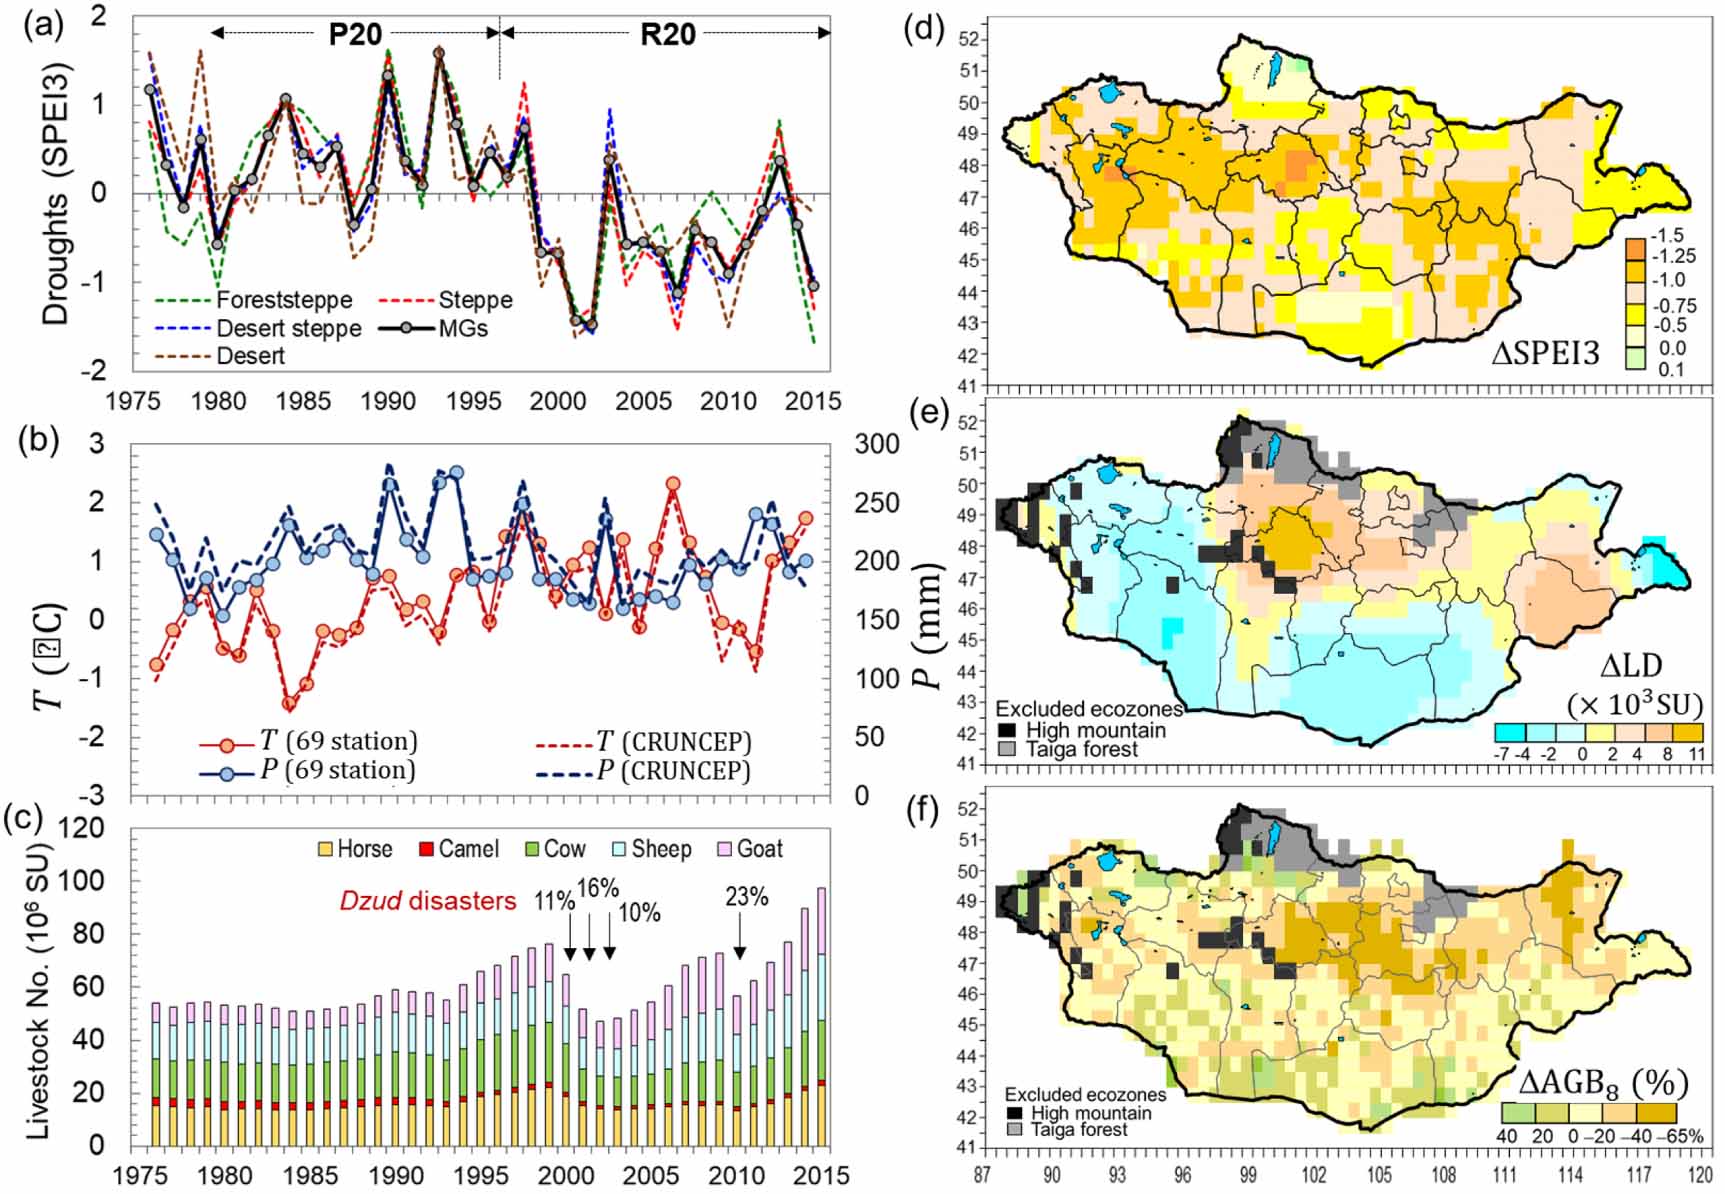
During 1975−2015, hazardous droughts are increased across MG with significant (p < 0.05) increases since the late 1990s, from the occurrence of major droughts in 2000−2002 and 2007 (figure 3(a)), reflecting regional climate change (figure 3(b)). The average value of SPEI3 indicates that all MG experienced a shift of climate regime with more severe and frequent drought in the late 1990s at the transition between P20 and R20 (figure 3(a)). The map of average summer SPEI3 for P20 indicates values greater than zero throughout MG. In contrast, there was a shift to more negative values in R20, particularly in central areas (figure S3). This indicates a widespread increase in drought conditions.
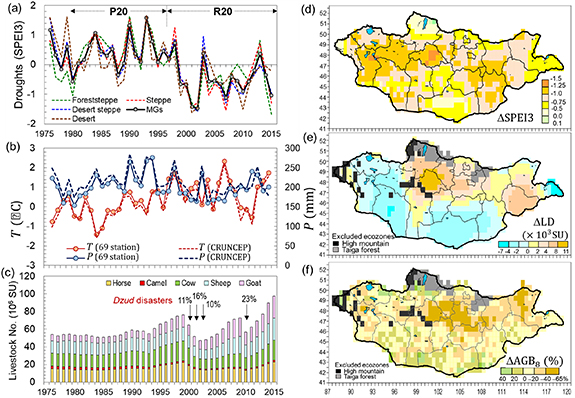
Figure 3. Interannual changes in (a) summer drought (SPEI3 for June–August) with P20 and R20, (b) climate (annual T and P), and (c) livestock number per each species in sheep units (SU) during 1976–2015. Spatial patterns of differences (Δ) between two composites (R20 and P20) of (d) SPEI3, (e) LD in SU, and (f) the modeled AGB8 (in relative terms, %). The (Δ) for SPEI3 and LD (AGB8) calculated as the absolute (relative) values in means between R20 and P20. In (c), black arrows indicate dzud disasters (livestock losses) in 2000–2002 and 2010, respectively.
Download figure:
Standard image High-resolution imageDuring 1975−2015, MG experienced a significant (p< 0.001) warming of 1.73 °C (figure 3(b)) based on annual temperature from 69 stations (1.45 °C from CRUNCEP) with the 11 warmest years on record happening during the 2000s. Annual precipitation slightly decreased (p> 0.05) by 5.2% at the 69 stations (by 10.8% from CRUNCEP). In the meantime, since the 1990s (figure 3(c)), socioeconomic changes have significantly impacted traditional herding practices. The grazing intensity increased due to an increase in livestock number (by +34.2%) doubling from 50.9 million SU in 1990–102.8 million SU in 2015 (figure 3(c)) with significant losses in 2000−2002 and 2010 due to dzuds that combined with preceding droughts [20, 28].
Figures 3(d)–(f) show the patterns of differences ( ) between SPEI3, LD, and AGB8 (relative) of R20 and P20.
  shows widespread negative values with the highest values in the central and eastern regions (figure 3(d)).
  shows positive values in northcentral areas, exceeding 20% (>20 × 103 SU), whereas western and the southern areas experienced negative anomalies (LD declined by >20%) (figure 3(e)). Simulated relative
  AGB8 (figure 3(f)) (
 ANPP,
ANPP,  LAI8, and
  W0−50, figure S3) show a widerspread reduction in most areas of MG, reaching below −65% in central and northeast regions. This indicates that MG, notably the forest steppe and steppe, experienced reduced grassland productivity from declining soil moisture (up to 20%) due to frequent droughts and warming, together with increasing grazing intensity.
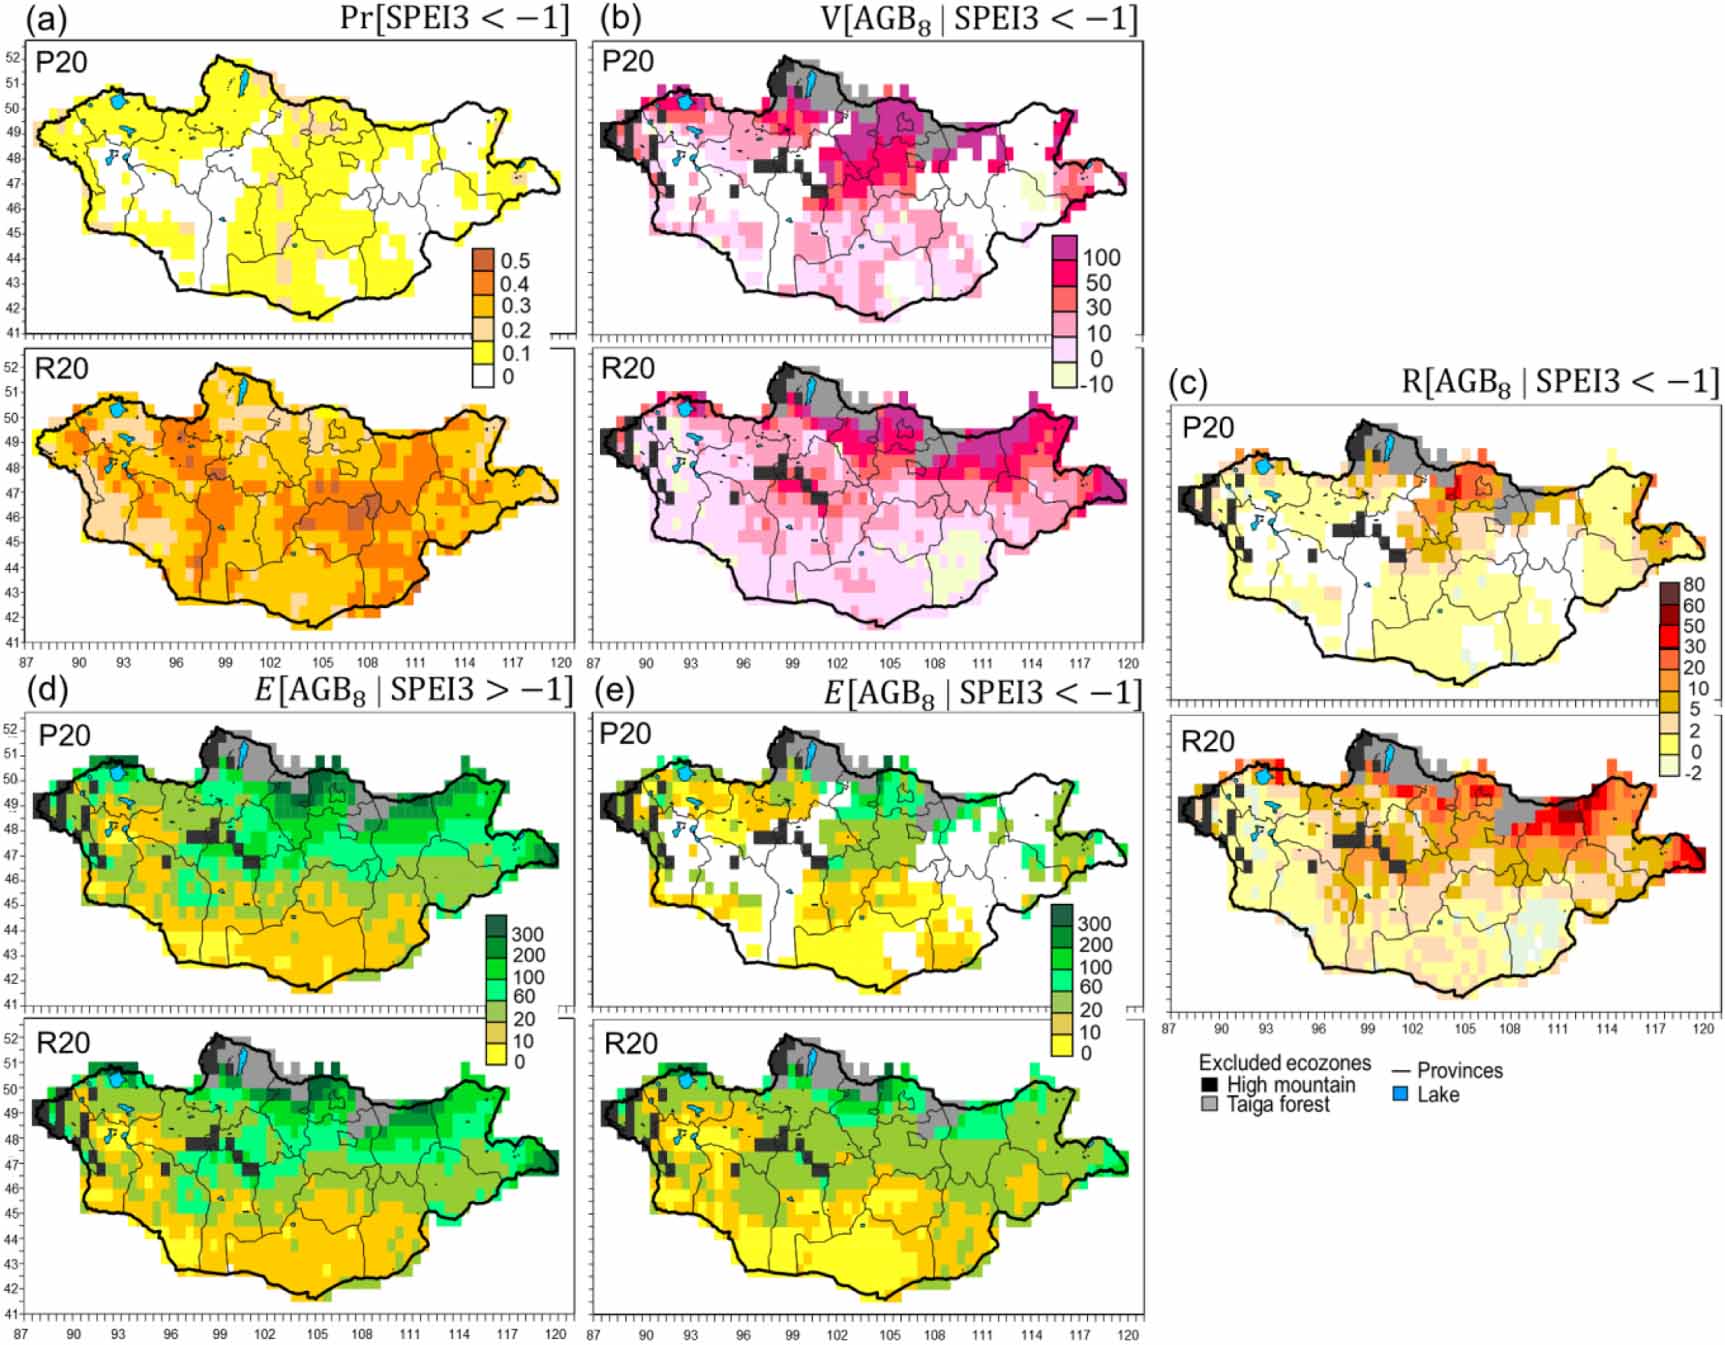
Changes in drought vulnerabilities and risks to AGB8, ANPP, LAI8, and W0−50 were compared for the two periods across MG. Figure 4 shows the PRA of AGB8 for R20 and P20 with the  (figure 4(a)), the vulnerabilities of AGB8 (figure 4(b)), and resulting risks (figure 4(c)) with mean values of AGB8 under non-hazardous years (SPEI3 >−1.0) (figure 4(d)) and hazardous ones (SPEI3 <−1.0) (figure 4(e)). In figure 4, the blanked areas indicate areas are without hazardous (moderate to severe) or favorable climate conditions in P20, and these areas are excluded in the vulnerability and risk analyses. For both periods, hazardous droughts caused a lower AGB8 (figure 4(e)). Regionally, vulnerabilities and risks of AGB8 increased from the south to the north (figures 4(b) and (c)). During P20,
  varied little (0.1−0.2) across the region from central to the northwest (figure 4(a)), whereas the rest of the country experienced favorable climate conditions (blanked area in figure 4(a)). The vulnerability of AGB8 within hazardous drought-affected regions had all positive values, with the largest in northcentral Mongolia (figure 4(b)). Similar to the vulnerabilities, the drought risk of AGB8 was highest in the northcentral region (figure 4(c)).

Figure 4. Probabilistic risk analysis (PRA) for AGB8 (g m−2) for two periods: P20 (1976–1995) and R20 (1996–2015). The considered hazard is drought, which is defined as SPEI3 < −1.0. (a) Probability of drought hazard,  (SPEI3 < −1.0); (b) vulnerability (
 ) of AGB8 = (d–e); (c) risk (
 to AGB8 = (a × b); (d) AGB8 in non-hazardous drought years (good conditions); and (e) AGB8 in hazardous drought years (bad conditions). (a) Blank areas in (c) denote areas with SPEI3 > –1.0 (areas without moderate to severe droughts during P20), and these areas are excluded in the vulnerability and risk analyses (blank areas in (b) and (e)).
Download figure:
Standard image High-resolution imageIn contrast, during R20, a higher  (>0.4) was found throughout Mongolia, particularly in central and eastern regions (figure 4(a)). Similarly, the vulnerability of AGB8 increased over the eastern and western areas (figure 4(b)). Therefore, the drought risk to AGB8 has increased over extended areas. Areas with higher risk to AGB8 (losses >20.0 g m−2 and >30% of the mean) were northcentral and northeast and extended eastward. Increases in the probability of drought, particularly in the 2000s, were the main factors contributing to the greater extent of the increased risk than vulnerabilities.
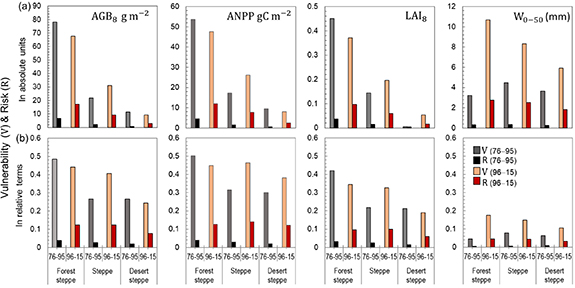
Figure 5 shows the drought vulnerabilities and risks (absolute and relative terms) for the two periods averaging all grid-cells in three main ecozones. Relative vulnerability (or risk) is vulnerability (or risk) divided by the value of each impacted variable at the same location under contemporaneous non-hazardous conditions. In general, vulnerabilities and risks increased from the desert steppe to the forest steppe. In P20, relative vulnerabilities for productivity (AGB8, ANPP, and LAI8) were 25%−50% for the three ecozones (figure 5(b)). The risks were estimated as being low (2.0%−4.3%) due to the low  . During R20 (figure 5(b)), the relative risks to productivities increased by 4.1%−11.2% within the three ecozones than P20, especially in the steppe and forest steppe. The largest increase in relative vulnerabilities of productivities (up to 14.1%) was found in the steppe. For W0−50, vulnerabilities (10%−15%) and risks (2%−4%) increased within ecozones. This indicates that the increased
  led to decreased W0−50 (soil drying), thereby contributed to the increased risk to plant productivity.
Figure 5. Drought risks and vulnerbalites for AGB8, ANPP, LAI8, and W0–50 for each period (P20: 1976–1995 and R20: 1996–2015) for three main ecozones of MG. The V and R are expressed in absolute (a) and relative (b) terms in averaged values over all grid cells for each ecozone. Relative terms (b) are estimated as fractions of variables under non-hazardous conditions in each grid cell.
Download figure:
Standard image High-resolution image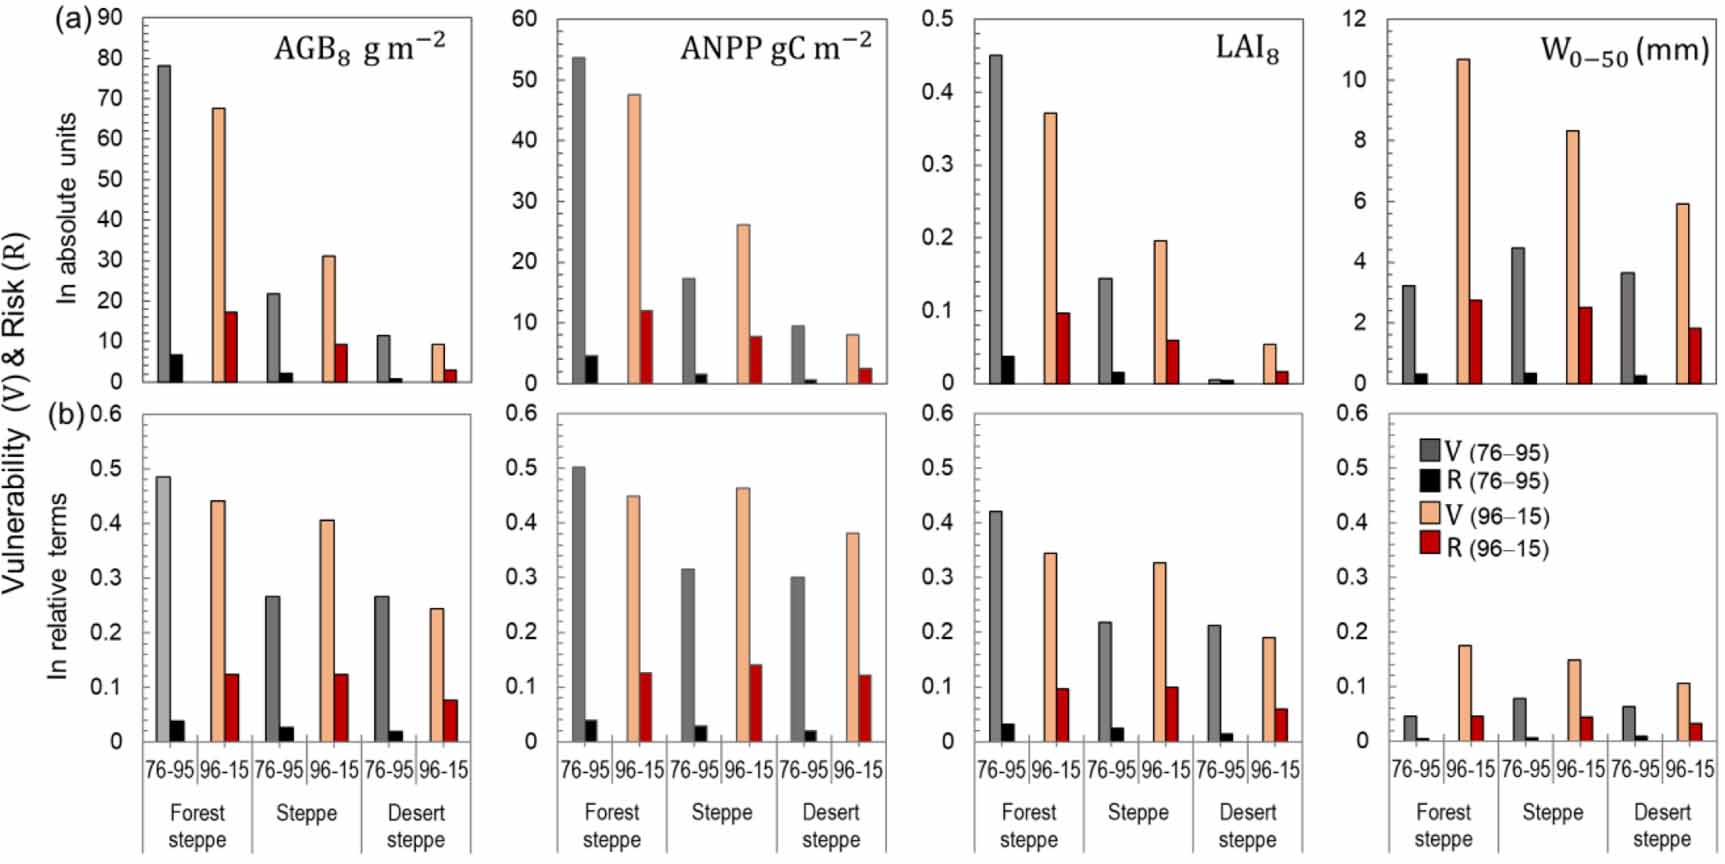
4. Discussion and conclusions
Multi-centennial reconstructions of past temperature for MG indicated that recent warming over Mongolia [62–64] has been unusually rapid, with surface temperature anomalies higher than for much of the globe by reaching to ∼1.5 °C higher than those in the previous several centuries [24]. Recent tree-ring studies suggest that P20 pluvial episodes and R20 droughts are extraordinarily rare in MG over the last 2060 years [65, 66].
Reducing long-term drought risk is a big challenge. Our results show that during P20, MG experienced favorable wet summers (17 summers with wet conditions). In contrast, during R20, MG experienced more frequent hazardous droughts (15 summers with dry conditions) with rapid warming and slight drying. The recent droughts in R20 have been concurrent with significant socioeconomic changes that drove livestock densities upwards [20, 26, 28, 67]. Climate change and increasing intake led to declines in the majority of MG's productivity, particularly in the R20, notably in northcentral and northeast Mongolia. These agree with previous ground measurements [22, 68], herder perceptions [63, 69], and remote sensing studies [70, 71], which detected reductions in grassland production, particularly in the steppe [70].
During R20, climate change led to increasing drought vulnerabilities (risk of impacts) for AGB8, ANPP, and LAI8 over extended areas in MG, with 8% (3%), 10% (6.2%), and 15% (3%) increases compared to the P20 levels, particularly in steppe and forest steppe. At the same time, W0−50 risk has increased, leading to soil moisture deficits for plant growth. Soil moisture loss through evapotranspiration is typically high in early growing months, leading to plant water stress in the early growing season, notably in June [48]. The increased  mainly caused increased risks to all variables. This is evident because vulnerabilities of variables generally increased less (except some areas in the steppe) than those of the probability of droughts, and they even decreased slightly in the forest steppe. These decreases are possibly related to elevated CO2 that increases drought tolerance by inducing stomatal closure [36], given the fact that the model can simulate physiological adaptation (e.g. stomatal closure with increased atmospheric CO2 concentration and drought, increased allocation to roots when soil resources become limiting, and temperature optimum of photosynthesis) [52].
Drought is a gradual phenomenon with a time-lagged carry-over of anomalies in rainfall–soil moisture–pasture–hay/forage–livestock conditions that eventually culminate in a dzud [20, 72]. During R20, the substantial increases in hazardous droughts resulted in a reduction in AGB8 over MGs compared to the P20, particularly in the most productive forest steppe areas (40%−65%) and steppe (20%−40%), leading to forage deficits for livestock. This is consistent with previous studies [73]. This could reduce fodder/hay reserves for the animals during the cold-season, causing livestock to become more vulnerable. Moreover, drought affects animal body conditions as animals cannot fatten enough to overcome winter due to lack of energy and nutrient intake and water shortage [20, 28, 74]. There is strong evidence that in 2000−2014 [20], the combination of summer droughts and severe winters (dzuds) killed 30.2 million livestock (equals to 57.4 million SU), resulting in vulnerable herders (e.g. malnutrition, infant losses, and health) [75, 76], losing their livelihoods [67, 77], and significantly damaging Mongolian socio-economy [21, 28, 78]. Approximately 16.7% of these deaths were attributed to a drought-induced deficit of forage/hay that caused livestock to become emaciated [20]. In this context, assessments of drought risks for the present MG conditions may support climate-related disaster risk management by identifying risky hotspots, allowing herders in risky areas to be prepared for events, and mitigating future potential impacts.
Given MG's benefits for both ecosystem services and socioeconomic consequences, recent increases in hazardous droughts and associated risk to MG signal an urgent need to implement grassland management or drought mitigation strategies and policies that sustain MG. They may include mitigation and management (e.g. grazing and herd management) in the high-risk areas to better manage climate change consequences [79, 80]. Recent international and regional initiatives focus on a proactive way to reduce drought risks by protecting and restoring affected ecosystems through land rehabilitation [79]. Furthermore, comprehensive drought monitoring and early warning systems are crucial for proactive preparedness for future drought.
We identified that the hotspots of MG areas at risk from climate change are the northcentral and northeast Mongolia, suggesting that these regions require strategic management (grassland/livestock) for adaptation and ecosystem conservation to cope with climate change impacts. Recently, there have been science-based recommendations for improvements of grassland and livestock management policy [46], including implementing rotational and planned grazing system, improving coordination of pastoral mobility [73, 81], reducing animal numbers, sustaining traditional best practices, ecosystem conservation practices, and soil improvement, and increasing knowledge and information sharing [26, 82], all of which will likely contribute to dealing with increased risk to MG. On the other hand, recent studies suggest that MG may be approaching a tipping point by declining plant species richness and increasing drought-tolerant grass caused by climate change and increasing grassland use [82]. This declining species richness may affect grassland resilience after drought [83]. Shifts in plant functional types under the changing climate and land use need to be confirmed for all MG [23]. The current model used here does not replace plant functional types with others when the environment changes [54].
The ecosystem-focused PRA used in this study allows for straightforward quantification and decomposition of ecosystem risks, enhancing future risk assessment. On the side of the grassland services, we focused here on the vulnerability of MG productivity in pasture using ORCHIDEE-GM, which is one of few ecosystem models that can describe vegetation dynamics under changing climate with the grazing practice for large-scale applications such as Mongolia over a long-term. In our definition, vulnerability is the ultimate impact of drought on the ecosystem. However, we do not know if the vulnerability has changed because of increased LD that might induce some risk uncertainties. This may be interesting to look at in a follow-up study by, e.g. comparing the sensitivity of AGB8 or NDVI to drought for the same drought intensity but in different districts and years with the same background climate and characterized only by different LDs. Besides, it might be partly assessed by running the model with variable and static LD (or for a range of densities) and comparing sensitivity differences.
Moreover, this study does not provide an ensemble modeling approach. We used one ecosystem model by parameterizing and validating with observed biomass and soil moisture in MG. This model has been tested against observations and experimental data across Europe with reasonably well-performing ecosystem variables under grazing [53, 54]. It is also used for ecosystem risk analysis with different impact models under current and future climate scenarios [39, 84]. Moreover, we also used one environmental variable (drought) using the SPEI, which is not explicitly incorporated in the ecosystem model. However, we calculated the SPEI from the ORCHIDEE-GM input data and used the model to quantify the associated risk [39]. In the future, additional environmental and sys variables could be included to analyze the risks more comprehensively. However, we would need to extend the exercise to other models, if we want to know which ecosystem types are at the greatest risk.
Future climate change is expected to negatively impact the productivity and stability of ecosystems in drylands [85]. In turn, such ecosystem degradation can further enhance climate change risks, especially 'hot droughts,' which are expected to become more frequent and severe in semi-arid regions within the next few decades [66, 86, 87], leading to soil moisture deficits [1]. Consequently, alleviating the adverse impacts of climate change on ecosystems, livestock, and pastoralists through strengthening coping capacities, risk reduction strategies, and resilience in degraded environments will be a crucial challenge. Therefore, addressing the mechanistic details of the continued increase of drought risk to MG and identifying MG areas that will be most affected in the future are urgently needed. Considering these, the MG's future risk analysis needs to be assessed using multiple climate scenarios and multiple ecosystem models for future adaptation policies that promote and sustain grasslands and human well-being.
Acknowledgments
This research was supported by Research Fellowship Grant (No. P2017-2504) from the National University of Mongolia, and partly by the Taylor Family-Asia Foundation Endowed Chair in Ecology and Conservation Biology, and International (Regional) Cooperation and Exchange Programs of China (No. 41961144019). The authors thank Michael C Grundler (Department of Ecology and Evolutionary Biology, University of Michigan, Ann Arbor, USA) to prove the English. We acknowledge climate and land surface data from the Information and Research Institute of Meteorology, Hydrology and Environment of Mongolia, and livestock data from the National Statistical Office of Mongolia.
Data availability statement
All data that support the findings of this study are included within the article (and any supplementary files).
Author Contributions
BN conceived the idea and designed the research. BN and JC performed research with comments from BB and PC. BN analysed data with support from ED. BN wrote the manuscript and prepared all Figures with comments and edits from BB, JC, PC, and NCS. AB and TsB prepared climate and biomass data.