

Abstract
The UK is vulnerable to wildfire, and vulnerability is likely to increase due to climate change. Whilst the risk is small compared with many other countries, recent fires have raised awareness and highlighted the potential for environmental damage and loss of property and key infrastructure. Most UK wildfires are a result of inadvertent or deliberate human action, but the environmental conditions depend on antecedent and current weather. This paper presents projections of the effects of climate change on UK wildfire danger, using a version of an operational fire danger model, UKCP18 climate projections representing low and high emissions, and several indicators of fire danger. Fire danger will increase across the whole of the UK, but the extent and variability in change varies with indicator. The absolute danger now and into the future is greatest in the south and east (the average number of danger days increases 3–4 times by the 2080s), but danger increases further north from a lower base. The variation in change across the UK for indicators based on absolute thresholds is determined by how often those thresholds are exceeded now, whilst the (lesser) variability in percentile-based indicators reflects variability in the projected change in climate. Half of the increase in danger is due to increased temperature, and most of the rest is due to projected reductions in relative humidity. Uncertainty in the magnitude of the change is due to uncertainty in changes in temperature, relative humidity, and rainfall, and there is a large difference between two of the UKCP18 climate model ensembles. Reducing emissions to levels consistent with achieving international climate policy targets significantly reduces, but does not eliminate, the increase in fire danger. The results imply that greater attention needs to be given to wildfire danger in both emergency and spatial planning, and in the development of guidelines for activities that may trigger fires. They suggest the need for the development of a fire danger system more tailored to UK conditions, and the combination of fire danger modelling with projections of sources of ignition to better estimate the change in wildfire risk.
Export citation and abstract BibTeX RIS

Original content from this work may be used under the terms of the Creative Commons Attribution 4.0 license. Any further distribution of this work must maintain attribution to the author(s) and the title of the work, journal citation and DOI.
1. Introduction
In recent years there have been widespread and extensive wildfires in many countries and regions, notably Australia, California, Brazil, Greece and Siberia. Whilst the global number of wildfires has decreased over the last few decades (Doerr and Santin 2016), the risks posed by wildfire to the environment, health and the economy are gaining increased attention, and climate change has the potential to increase substantially the risk of wildfires. The apparent contradiction between observed global trends, recent experience and concerns over the future arises because wildfire is a semi-natural hazard: whilst the conditions necessary for a fire to become established are largely environmentally-determined, the initial spark is often a result of deliberate or inadvertent human action.
The UK is vulnerable to wildfires, and awareness is increasing (Glaves et al 2020). Following the Swinley Forest fire in May 2011 that threatened critical infrastructure in a rural-urban margin in south east England, wildfire risk was added to the UK's National Risk Register in 2013 (Gazzard et al 2016): however, fewer than half of the 42 current Community Risk Registers in England and Wales explicitly mention fire. The Saddleworth Moor fire in May 2018 threatened homes and led to evacuations, and an extensive wildfire in Moray, Scotland, in April 2019 threatened an onshore wind farm. A wildfire in the UK is rather broadly defined by the Scottish Government as 'any uncontrolled vegetation fire which requires a decision, or action, regarding suppression' (Scottish Government 2013), and most incidents are very small: 99% are under 1 ha, and almost half are under 5 m2. Between 2009/10 and 2016/17 there were over 258 thousand wildfires in England, burning nearly 37 thousand hectares (Forestry Commission 2019). The European Forest Fire Information Service (EFFIS) counts fires greater than 30 ha: an average of just over 10 000 ha was burnt in such fires across the UK between 2011 and 2020, with 28 754 ha burnt in 2019. Most of the land area burnt by wildfires across the UK is arable, grassland, or mountain and heath open habitats (de Jong et al 2016, Gazzard et al 2016, Forestry Commission 2019). Between 2009/10 and 2016/17 woodland and forest fires accounted for less than 5% of the land area burnt in England (Forestry Commission 2019). The vast majority of wildfires in the UK therefore occur in areas with low shrub vegetation (i.e. lowland and upland heath), and the dramatic scenes of fire leaping from crown to crown across a forest are very rare: the Swinley Forest fire was a notably significant exception.
There is little information on the costs and consequences of wildfire in the UK, although Gazzard et al (2016) estimated that suppression costs up to £55million yr−1. In principle wildfire in the UK can threaten life, and damage infrastructure and property, but the actual losses have been very low. The greatest impacts of wildfire in the UK to date have been on the environment: fires damage wildlife habitats and landscape quality, release carbon into the atmosphere and trigger soil erosion. The UK does not have dedicated resources to deal with wildfires, but the England and Wales, and Scottish, Wildfire Forums are voluntary strategic bodies established to coordinate interested stakeholders including local councils and the fire and rescue services.
Wildfire 'risk'—expressed in terms of area burnt or some other loss—is a function of two factors: does a fire start, and how far does it go? The chance of a wildfire starting depends on whether there is a source of ignition and whether the conditions are favourable for the fire to develop. In the UK, virtually all wildfires are started by human action (Glaves et al 2020), either inadvertent (a discarded barbecue, or a controlled burn that gets out of control, for example) or deliberate (malicious, although prosecutions for arson are very rare): fires could be started by lightning, but this is very rare. Once initiated, the extent of an uncontrolled wildfire depends on when it runs out of fuel, when it rains, or - most often - when it is suppressed by fire and rescue services. Fire is widely used as a traditional habitat management tool in moorland parts of the UK (Davies et al 2016); most are set in winter or early spring.
Estimating wildfire risk therefore involves understanding and estimating human behaviour as well as the factors which influence susceptibility to fire. In practice, operational wildfire warning systems are based on forecasting fire 'danger': the chance of a fire developing once there is a source of ignition. This chance depends on the availability of dry combustible material, which itself depends on the type of vegetation and current and recent weather. Fire danger for a given vegetation type can therefore be estimated from meteorological data.
Surprisingly few studies globally have assessed the effects of future climate change on wildfire danger. Virtually all have used indicators of fire danger (Flannigan et al 2013, Wang et al 2015, Khabarov et al 2016, Bowman et al 2017, de Rigo et al 2017, Wang et al 2017a, Kerr et al 2018, Dowdy et al 2019, Fonseca et al 2019), and all have demonstrated increased danger in the future. Albertson et al's (2010) study in the Peak District of the UK used an empirical statistical model linking actual fire occurrence to temperature, precipitation and date (as a surrogate for visitor numbers), thus combining empirically the chance of ignition with the chance of a fire developing.
This paper presents an analysis of the effects of climate change on a series of indicators of wildfire danger in the UK. These indicators are currently used operationally to assess fire danger. The paper (a) evaluates change in fire danger across the UK with high future emissions of greenhouse gases, (b) evaluates the effect of reducing emissions on fire danger, and (c) identifies the main climatic drivers of change in fire danger in the UK. The paper forms part of a larger multi-sectoral evaluation of changing climate risks in the UK (Arnell et al 2021).
2. Indicators, data and scenarios
2.1. Overall approach
Wildfire danger in the UK is characterised by a series of indicators currently used in operational fire danger forecasting by the UK Meteorological Office (2003), using 12 × 12 km gridded observed daily climate data for 1981–2010 and the 2018 UK Climate Projections (UKCP18) applied using the delta method. Results are aggregated to the regional level, weighted by land cover.
2.2. Characterising the potential severity of wildfires
A Fire Severity Index (FSI) service (based on an assessment of how severe a fire could become if one were to break out) for the UK is delivered by the Met Office using the Met Office FSI (MOFSI) model. The service, delivered under contract to Natural England and Natural Resources Wales, is used to inform the triggering of public restrictions to open access land, as specified under the Countryside and Rights of Way Act (2000). The act allows open public access to specific areas of land, but permits landowners to restrict access for a number of reasons, including fire danger. MOFSI categorises danger into four levels, using consistent definitions across England and Wales. Land owners can restrict access when "exceptional" danger is forecast. Maps showing current and forecast FSI levels are published daily by the Met Office. MOFSI 'exceptional' conditions are currently rare in the UK, and recent large wildfires have occurred with warnings at 'very high' or even 'high' levels (for example the Saddleworth fire in 2018).
MOFSI is based on the Canadian Forest FWI System (de Groot 1987, Van Wagner 1987, Wang et al 2017b), summarised in figure 1. Fire danger is calculated from temperature, relative humidity, windspeed, rainfall and potential evaporation, and the system consists of a series of indices. The Fine Fuel Moisture Code (FFMC) index represents the availability of dry 'tinder' material in and around the vegetation susceptible to ignition. The Duff Moisture Code (DMC) characterises the moisture content in partially decomposed loose material at the surface, whilst the Drought Code (DC) characterises the moisture content in the soil and vegetation. These vary at different time scales: the FFMC is sensitive to day to day variations in weather, whilst the DC reflects water deficits over weeks and months. The Initial Spread Index (ISI) combines the FFMC with windspeed to characterise the chance of a spark becoming a fire. The Buildup Index (BUI) integrates the DMC and the DC to characterise the potential for the fire to develop. The overall Fire Weather Index (FWI) combines the ISI and BUI. Table 1 summarises the threshold values for the FWI used in MOFSI to define 'very high' and 'exceptional' danger. The model and algorithms were developed for Canadian conditions, mostly based on wildfires in jack pine forest. Although wildfire processes and fuel sources in the UK are very different, there is evidence that MOFSI and its component parts can successfully predict extreme fire weather conditions in the UK (Glaves et al 2020). Davies and Legg (2016) and de Jong et al (2016) both concluded that high values of FFMC, coupled with high ISI (Davies and Legg 2016), were better at predicting fire occurrence for some fuel sources than the summary FWI. The Canadian system is also used in the European Forest Fire Information System (EFFIS: San-Miguel-Ayanz et al 2012) and in other countries including New Zealand (Pearce and Clifford 2008). EFFIS issues fire danger forecasts in the same way to MOFSI, using a similar threshold (50) for 'exceptional' conditions but with a substantially higher FWI threshold (38) for 'very high' danger.
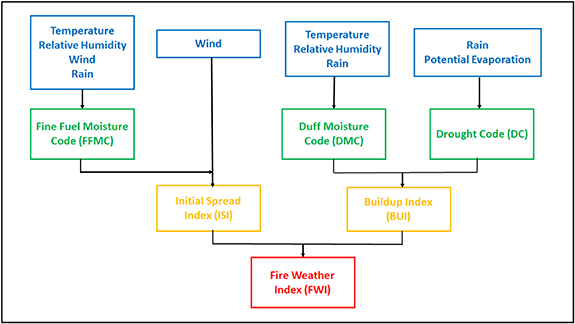
Figure 1. The Canadian Forest Fire Weather Index System, as used in the Met Office Fire Severity System and implemented in this paper.
Download figure:
Standard image High-resolution imageTable 1. Summary of fire danger thresholds.
| MOFSI fire danger | ||
|---|---|---|
| Very high | FWI > 17.35 | |
| Exceptional | FWI > 52.538 | |
| Daily hazard assessment amber warning | ||
| November to May | FFMC > 84 and ISI > 5 | |
| June to October | FWI > 17.35 and ISI > 10 and either DMC > 49 or DC > 300 | |
| Summary of 99th percentiles: 10th to 90th percentile range of values across the UK | ||
| FFMC | May to June | 86.6–88.5 |
| FFMC | July to August | 86.8–90.4 |
| ISI | May to June | 8.2–14.0 |
| ISI | July to August | 7.4–13.1 |
| FWI | May to June | 15.3–25.4 |
| FWI | July to August | 17.0–35.7 |
The table shows the range in 99th percentile values across the UK for spring and summer. Maps of the distribution of the percentiles in each season are shown in supplementary material.
The Natural Hazards Partnership (NHP: Hemingway and Gunawan 2018) daily hazard assessment (DHA) wildfire danger rating offering is based on an analysis of output from the Met Office Forecast Severity Index model (MOFSI), crosschecked against EFFIS and reports and information received from members of the England and Wales Wildfire and Scottish Wildfire Forums. The NHP DHA is produced and made available daily to emergency planners, the emergency services and government land management organisations across the UK. The DHA wildfire Green-Amber-Yellow-Red levels (updated in June 2020) are based on threshold values for the FFMC, ISI, DMC, DC and FWI components (table 1). The thresholds and individual components used vary seasonally (November to May and June to October) due to variations in the amount of combustible material. An 'amber' warning level means that severe wildfire conditions are forecast with a likelihood of difficult-to-control wildfires. The 'red' level means extreme wildfire conditions are forecast, and occurs when the amber thresholds are passed and other weather conditions are conducive to fire (persistent high temperatures, low humidity and high windspeeds). de Jong et al (2016) argued that the use of the same thresholds everywhere led to an underestimation of wildfire danger in cooler parts of the UK. They concluded that thresholds based on percentiles gave a better indication of fire danger, and recommended using the 99th percentiles of the FWI and FFMC (1% of days have values above the 99th percentile). Maps of seasonal values for the 99th percentiles are presented in supplementary material (available online at stacks.iop.org/ERL/16/044027/mmedia), and table 1 summarises the range in values across the UK. Note that the MOFSI threshold for very high danger is below the 99th percentile FWI across most of the UK—apart from in summer—but the MOFSI exceptional threshold is well above the 99th percentile. The DHA amber thresholds are all below the 99th percentiles for the constituent parts.
This study implemented the Canadian system (using FORTRAN code provided in Van Wagner and Pickett (1985)) as an approximation to MOFSI, with two minor modifications. First, the Canadian day lengths hard-coded into the DMC algorithm were replaced with values more suitable for the UK. Second, the DC algorithm uses a Canadian approximation to the Thornthwaite formula to estimate potential evaporation: this was replaced by the more physically-realistic Penman–Monteith formula, but the effect is small. The version implemented here uses daily input data, but the Met Office implementation used for fire danger warning uses finer resolution data from the operational weather forecast model.
Six indicators of fire danger are calculated for each cell in the 12 × 12 km observational grid: days with a MOFSI 'very high or exceptional', or 'exceptional' warning, days with an 'amber' level DHA warning, and days greater than the reference period 99th percentile FWI, FFMC and ISI (calculated separately for each grid cell and season). Each indicator is expressed as an average annual value over a 30 year period, and as the likelihood (calculated over 30 years) of having more days than the 1981–2010 mean. This set of indicators was used because, as outlined above, wildfire danger in the UK is not necessarily directly related to the headline FWI indicator.
2.3. Reference climate data
Observed climate data were taken from HadUK-Grid 12 km resolution observational data set (Met Office 2018), supplemented by ERA5 reanalysis (Copernicus Climate Change Service 2017). The HadUK-Grid 12 km data set includes daily minimum and maximum temperature and rainfall up to 2018, but sunshine hours, windspeed and relative humidity are only available as monthly averages. Daily windspeed and relative humidity was therefore estimated from the ERA5 reanalysis, rescaling the ERA5 reanalysis so that the monthly mean equalled the HadUK-Grid monthly mean. Sensitivity studies showed that it was particularly important to use daily windspeed rather than monthly mean windspeed, as this had a big effect on the ISI code and therefore FWI. The time period 1981–2010 is used to represent current climate.
2.4. Climate projections and their application
The UKCP18 land climate projections (Lowe et al 2018, Murphy et al 2019) consist of four strands: global, regional, local and probabilistic. The global strand consists of an ensemble of 15 climate projections at a spatial resolution of 60 × 60 km made using variants of the HadGEM3 climate model and an ensemble of 12 projections made using CMIP5 climate models. Projections are made for two levels of climate forcing, representing high (RCP8.5) and low (RCP2.6) emissions (table 2). These projections each maintain realistic physical relationships between climate variables and coherent patterns of change across the UK. The regional strand is based on higher-resolution versions of HadGEM3, and in practice gives similar results to the global HadGEM3 projections. The local strand is a smaller number of even higher-resolution projections, and these were not applied. The probabilistic strand consists of 3000 equally-plausible projections at four different levels of forcing, but these do not maintain realistic physical relationships between variables. Most significantly, they can generate unrealistic combinations of vapour pressure and temperature and therefore overestimate the potential range in change in relative humidity—an important driver of fire danger.
Table 2. Increases in global mean temperature with the RCP2.6 and RCP8.5 projections.
| Increase in temperature above pre-industrial levels (°C) | ||
|---|---|---|
| RCP2.6 | RCP8.5 | |
| 2050s | 1.6 (1.1–2.2) | 2.3 (1.7–2.9) |
| 2100 | 1.9 (1.3–2.6) | 5.1 (4.0–6.5) |
The table shows the median estimate of increase in global mean temperature, with the 10th to 90th percentile range in brackets. The average global temperature over the period 1981–2010 was approximately 0.61 °C warmer than pre-industrial levels.
The study focused on the global strand climate projections of monthly climate. Figure 2 summarises the regional average summer (June to August) changes in average temperature, rainfall, vapour pressure, relative humidity and windspeed (regions are shown in figure 3), and table 3 shows national average changes in summer temperature and rainfall. The general direction of change is similar across all projections—increase in temperature, reduction in rainfall, reduction in relative humidity, and reduction in windspeed—but there is a clear difference between the two ensembles. The HadGEM3 ensemble tends to generate more extreme changes than the CMIP5 ensemble.

Figure 2. Regional average changes in 30 year mean summer climate, with the RCP8.5 emissions projection. The plots show the median and range across the HadGEM3 and CMIP5 ensembles separately, and values are plotted at the centre point of the 30 year period.
Download figure:
Standard image High-resolution image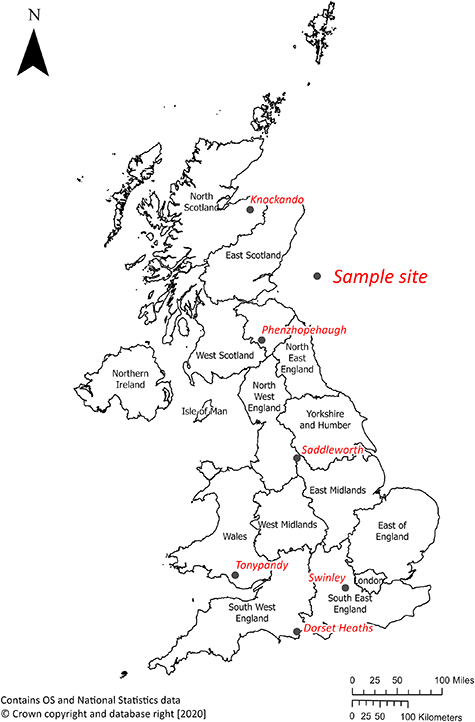
Figure 3. UK administrative regions and locations of the sample sites.
Download figure:
Standard image High-resolution imageTable 3. National average change in summer (June–August) temperature and rainfall across the UK, relative to the 1981–2010 average.
| 2050s | 2080s | |||||||||||
|---|---|---|---|---|---|---|---|---|---|---|---|---|
| HadGEM | CMIP5 | HadGEM | CMIP5 | |||||||||
| Summer temperature (°C) | Median | Low | High | Median | Low | High | Median | Low | High | Median | Low | High |
| England | 3.47 | 2.90 | 3.89 | 2.10 | 1.36 | 2.87 | 6.01 | 5.25 | 6.77 | 3.65 | 2.81 | 5.45 |
| Wales | 3.11 | 2.67 | 3.70 | 1.99 | 1.35 | 2.69 | 5.61 | 4.84 | 6.43 | 3.55 | 2.57 | 5.32 |
| Scotland | 2.70 | 2.15 | 3.18 | 1.51 | 0.98 | 2.56 | 4.77 | 4.02 | 5.59 | 2.59 | 2.16 | 4.33 |
| Northern | 2.76 | 2.38 | 3.40 | 1.49 | 1.18 | 2.59 | 5.04 | 4.23 | 5.93 | 2.82 | 2.00 | 4.38 |
| Summer rainfall (% change) | ||||||||||||
| England | −29 | −39 | −16 | −14 | −22 | 10 | −54 | −63 | −34 | −21 | −29 | −2 |
| Wales | −30 | −41 | −16 | −14 | −26 | 8 | −57 | −66 | −38 | −23 | −36 | 1 |
| Scotland | −13 | −18 | −2 | −7 | −11 | 2 | −29 | −33 | −13 | −10 | −16 | 1 |
| Northern | −19 | −23 | −8 | −12 | −17 | 4 | −36 | −48 | −21 | −17 | −26 | 2 |
The table shows the median across the ensemble members, together with the lowest and highest values.
The climate projections to 2100 were applied to the gridded observed 1981–2010 daily time series using the delta method, matching each observed 12 × 12 km grid cell with its corresponding 60 × 60 km climate projection grid cell. Each variable for a given climate projection was first expressed as an anomaly from its 1981–2010 monthly mean (absolute for temperature and net radiation, relative for the other variables). The resulting time series of monthly anomalies were then smoothed using a 31 year running mean to remove the effect of year to year variability and extract the climate change signal. In order to calculate anomalies for the last 15 years of the projections the anomaly time series were extrapolated using linear regression. There can be large differences in anomaly from one month to the next—which introduces unrealistic steps at month boundaries—so the monthly anomalies were interpolated to the daily scale before being applied to the observed daily data. Time series from 2011 to 2100 were constructed by first repeating the 1981–2010 time series three times to create a long unperturbed record and then applying the annual time series of anomalies (see supplementary material).
The delta method assumes no change in relative climate variability from year to year, and that the proportional change in a variable does not vary with the magnitude of that variable. It is possible that climate change would generate increased variability in summer temperatures from year to year, and this would increase the number of high temperature extremes. A reduction in the number of wet days would increase the chance of prolonged dry spells.
The study uses the delta method to apply changes to observed daily time series rather than apply bias adjustment to the monthly UKCP18 projections for three reasons. First, observed data is used to characterise the current climate because this observed experience is familiar to stakeholders. Second, different bias adjustment approaches exist correcting for different aspects of bias, and all assume that the adjustments continue into the future. Third, it would have been impractical to test and apply bias adjustment methods which preserved relationships between variables for all projections and locations.
2.5. Regional averages and example sites
The fire danger model is implemented at a spatial resolution of 12 × 12 km across the UK. Regional averages are also calculated for UK regions (9 in England, 3 in Scotland, and Wales and Northern Ireland: figure 3), weighting the grid cell values by the area of land under improved grassland, heathland, bog, marsh and grassland taken from the 2015 UK Land Cover Map (CEH 2017). These are the land covers with the greatest number of wildfires (de Jong et al 2016).
Six example locations (table 4 and figure 3) are used to illustrate year to year variability in fire danger and to explore the relative importance of the different drivers of fire danger. These locations are representative of different meteorological conditions across the UK, and all are exposed to fire danger.
Table 4. Locations of the six sample sites.
| Location | Region | Longitude and latitude | Landscape type |
|---|---|---|---|
| Swinley | South East England | 0.75° W, 51.4° N | Lowland heath and forest on rural-urban fringe |
| Dorset Heaths | South West England | 2° W, 50.7° N | Lowland heath |
| Saddleworth | North West England | 2° W, 53.5° N | Upland moorland |
| Knockando | North East Scotland | 3.4° W, 57.5° N | Upland heathland |
| Phenzhopehaugh | Southern Scotland | 3° W, 55.4° N | Upland heathland |
| Tonypandy | South Wales | 3.6° W, 51.6° N | Upland moorland |
3. Current exposure to wildfire danger
Figure 4 shows the 1981–2010 mean number of days per year for the DHA and MOFSI warning indicators (note that, by definition, there will be on average 3.65 d yr−1 greater than the 99th percentile threshold indicators). The greatest average number of days above the DHA threshold is in south and east England, reaching a maximum of up to 20. There are far fewer days above the MOFSI exceptional warning threshold, with maxima across the East Midlands.
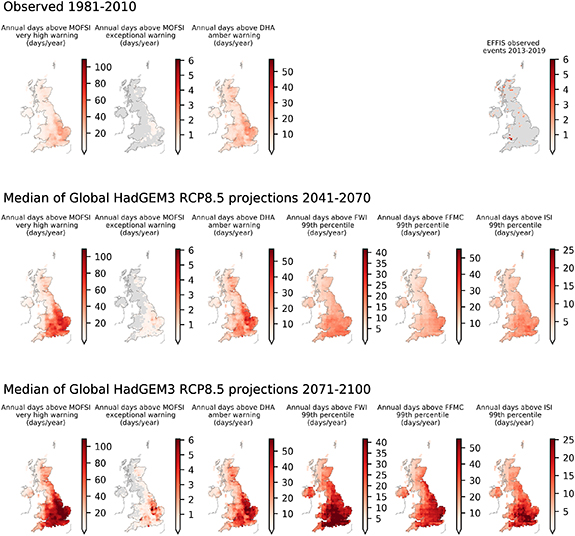
Figure 4. Current and future fire danger in the UK. The top panels show the average annual number of days with MOFSI very high and exceptional warnings, and the number of days with DHA amber level warnings, over the period 1981–2010. The top right plot is the observed number of wildfires over the period 2013–2019 in the EFFIS data base, summed over 12 × 12 km grid cells. The middle and bottom rows show the numbers of days with all six indicators over the periods 2041–2070 and 2071–2100, for the median of the 15 RCP8.5 HadGEM3 climate projections.
Download figure:
Standard image High-resolution imageTime series from 1981 to 2018 are shown in figure 5 for the six sample sites: at none of these sites were there days with MOFSI exceptional warnings between 1981 and 2018. The large year to year variability in number of days with fire danger is evident, and—over this short period—there is little evidence of trend.
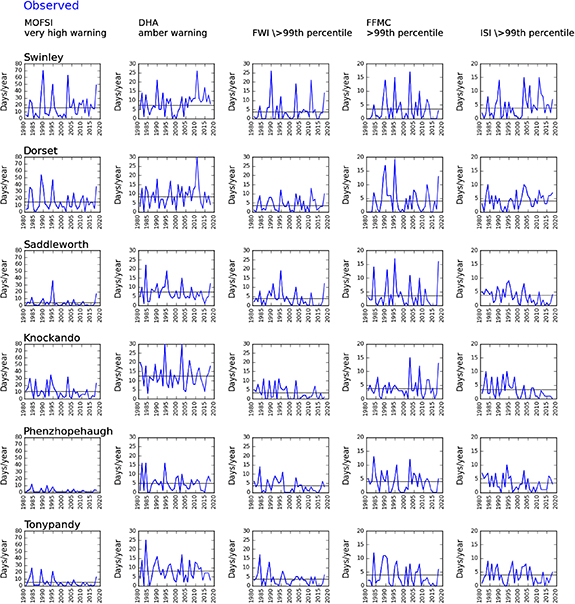
Figure 5. Annual number of days above thresholds at six example locations (table 4 and figure 3): 1981–2018. The horizontal line shows the 1981–2010 mean.
Download figure:
Standard image High-resolution imageFigures 4 and 5 show fire danger over space and time, but do not directly map onto observed fire experience between 1981 and 2018 and figure 4 is not to be interpreted as a map of fire risk. This is because fires need a source of ignition. These are rare, so actual fires at a place are rare, and fires do not necessarily occur in places or years with the highest fire danger. This makes it difficult to validate both the time series and spatial pattern of fire danger. In practice, most fires in the UK are located close to the rural–urban fringe (Gazzard et al 2016) and the distribution of actual fires across space is therefore much more closely related to land cover than the climatic factors affecting danger. The distribution across the UK of the largest fires—shown using EFFIS data aggregated to the 12 × 12 km resolution in figure 4—is also closely linked to land cover and land management practices.
4. Change in fire danger across the UK
4.1. Change in danger with high emissions
Figures 6 and 7 show regional average values of the six indicators with the RCP8.5 high emissions projections, expressing each indicator in terms of the average annual number of days and likelihood of experiencing more than the mean number of days (results are provided in supplementary material). The HadGEM3 and CMIP5 ensembles are plotted separately, and each are represented by the median plus the range between the second lowest and second highest. Figure 4 shows the average spatial pattern of change in the six indicators in the 2050s and 2080s, calculated as the median across the 15 HadGEM3 projections. Table 5 summarises results by region for the 2050s and 2080s with the HadGEM3 projections (results for the CMIP5 ensemble, and for other years, are given in supplementary material). In the reference period the likelihood of experiencing more than the mean number of days is well below 50% for each indicator (and especially the MOFSI exceptional danger indicator) because the annual distribution of danger days is highly skewed. Several conclusions can be drawn from the plots.
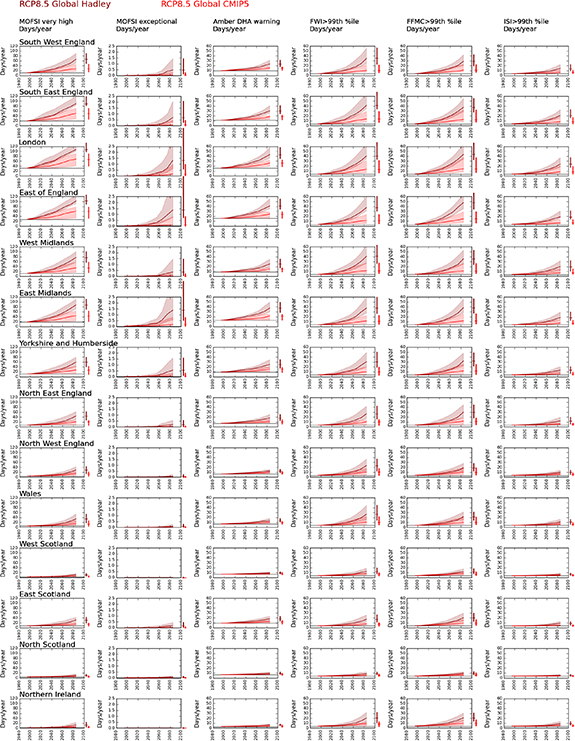
Figure 6. Annual fire danger by region with high emissions: days per year. The plots show the median and range across the HadGEM3 and CMIP5 ensemble separately, and values are plotted at the centre point of the 30 year period.
Download figure:
Standard image High-resolution image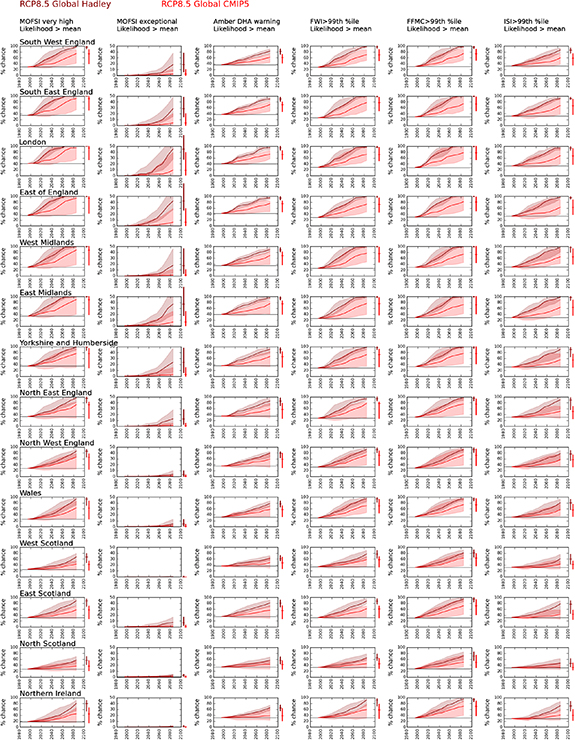
Figure 7. Annual fire danger by region with high emissions: likelihood of more days than the 1981–2010 mean. The plots show the median and range across the HadGEM3 and CMIP5 ensemble separately, and values are plotted at the centre point of the 30 year period.
Download figure:
Standard image High-resolution imageTable 5. Regional average values of the six fire danger indicators over 1981–2010, 2041–2070 and 2071–2080, with the HadGEM3 RCP8.5 ensemble. The annual % chance shows the likelihood of experiencing more days than the reference period mean.
| D yr−1 | Annual % chance | |||||||||||||
|---|---|---|---|---|---|---|---|---|---|---|---|---|---|---|
| 2050s | 2080s | 2050s | 2080s | |||||||||||
| 1981–2010 | Mid | Low | High | Mid | Low | High | 1981–2010 | Mid | Low | High | Mid | Low | High | |
| MOFSI very high danger | ||||||||||||||
| South West England | 12 | 33 | 29 | 45 | 62 | 53 | 83 | 29 | 77 | 74 | 89 | 96 | 93 | 99 |
| South East England | 20 | 55 | 51 | 70 | 89 | 84 | 111 | 35 | 92 | 91 | 99 | 100 | 100 | 100 |
| London | 32 | 74 | 70 | 90 | 106 | 102 | 124 | 41 | 92 | 90 | 100 | 100 | 100 | 100 |
| East of England | 28 | 66 | 61 | 82 | 102 | 92 | 121 | 36 | 94 | 93 | 99 | 100 | 100 | 100 |
| West Midlands | 13 | 37 | 32 | 58 | 75 | 58 | 96 | 30 | 86 | 79 | 99 | 100 | 98 | 100 |
| East Midlands | 19 | 47 | 44 | 67 | 86 | 71 | 106 | 34 | 92 | 88 | 100 | 100 | 100 | 100 |
| Yorkshire and Humberside | 11 | 28 | 23 | 44 | 58 | 42 | 78 | 34 | 75 | 68 | 94 | 98 | 90 | 100 |
| North East England | 8 | 19 | 16 | 33 | 40 | 29 | 61 | 33 | 70 | 62 | 89 | 96 | 83 | 100 |
| North West England | 5 | 10 | 9 | 18 | 28 | 15 | 41 | 27 | 56 | 49 | 73 | 83 | 70 | 91 |
| Wales | 5 | 12 | 11 | 22 | 32 | 21 | 53 | 25 | 54 | 49 | 82 | 93 | 78 | 98 |
| East Scotland | 8 | 15 | 13 | 23 | 29 | 21 | 38 | 32 | 62 | 53 | 80 | 85 | 74 | 93 |
| West Scotland | 3 | 5 | 4 | 8 | 10 | 7 | 16 | 25 | 39 | 35 | 57 | 63 | 50 | 76 |
| North Scotland | 4 | 6 | 5 | 9 | 10 | 8 | 13 | 27 | 41 | 35 | 52 | 57 | 48 | 64 |
| Northern Ireland | 2 | 4 | 3 | 7 | 11 | 8 | 20 | 19 | 41 | 36 | 61 | 77 | 65 | 90 |
| MOFSI exceptional danger | ||||||||||||||
| South West England | 0 | 0.06 | 0.04 | 0.14 | 0.41 | 0.2 | 1.25 | 0.1 | 3 | 2 | 6 | 15 | 9 | 35 |
| South East England | 0.01 | 0.09 | 0.06 | 0.25 | 0.57 | 0.35 | 1.88 | 0.0 | 6 | 4 | 14 | 25 | 18 | 48 |
| London | 0.01 | 0.24 | 0.14 | 0.68 | 1.23 | 0.76 | 3.81 | 0.0 | 14 | 8 | 30 | 45 | 34 | 66 |
| East of England | 0.02 | 0.29 | 0.16 | 0.69 | 1.36 | 0.86 | 3.55 | 0.0 | 13 | 8 | 26 | 40 | 30 | 68 |
| West Midlands | 0 | 0.04 | 0.03 | 0.13 | 0.34 | 0.13 | 1.25 | 0.1 | 3 | 2 | 7 | 18 | 8 | 41 |
| East Midlands | 0.03 | 0.26 | 0.16 | 0.64 | 1.34 | 0.86 | 3.23 | 0.3 | 10 | 6 | 21 | 37 | 25 | 62 |
| Yorkshire and Humberside | 0.01 | 0.09 | 0.04 | 0.25 | 0.53 | 0.19 | 1.55 | 0.0 | 5 | 2 | 12 | 23 | 9 | 44 |
| North East England | 0 | 0.03 | 0.01 | 0.1 | 0.19 | 0.05 | 0.54 | 0.0 | 2 | 0.4 | 7 | 12 | 4 | 27 |
| North West England | 0 | 0 | 0 | 0.02 | 0.05 | 0.01 | 0.21 | 0.0 | 0.4 | 0.2 | 1 | 3 | 1 | 9 |
| Wales | 0 | 0.01 | 0.01 | 0.03 | 0.06 | 0.03 | 0.24 | 0.1 | 0.4 | 0.3 | 2 | 4 | 2 | 10 |
| East Scotland | 0 | 0.02 | 0.01 | 0.07 | 0.16 | 0.05 | 0.36 | 0.1 | 1.1 | 0.6 | 4 | 7 | 3 | 14 |
| West Scotland | 0 | 0 | 0 | 0 | 0 | 0 | 0.01 | 0.0 | 0.0 | 0.0 | 0 | 0 | 0 | 1 |
| North Scotland | 0.01 | 0.02 | 0.01 | 0.04 | 0.06 | 0.03 | 0.12 | 0.1 | 0.6 | 0.4 | 2 | 2 | 1 | 4 |
| Northern Ireland | 0 | 0 | 0 | 0.01 | 0.01 | 0.01 | 0.03 | 0.0 | 0.4 | 0.3 | 1 | 1 | 1 | 3 |
| DHA amber danger | ||||||||||||||
| South West England | 10 | 16 | 14 | 18 | 23 | 19 | 30 | 40 | 82 | 80 | 91 | 97 | 95 | 100 |
| South East England | 11 | 19 | 17 | 22 | 30 | 26 | 41 | 37 | 91 | 89 | 98 | 100 | 100 | 100 |
| London | 16 | 28 | 25 | 33 | 43 | 38 | 57 | 36 | 89 | 86 | 100 | 100 | 100 | 100 |
| East of England | 16 | 27 | 24 | 31 | 41 | 36 | 54 | 37 | 92 | 89 | 98 | 100 | 100 | 100 |
| West Midlands | 9 | 15 | 14 | 18 | 24 | 20 | 32 | 39 | 86 | 80 | 98 | 100 | 98 | 100 |
| East Midlands | 13 | 23 | 21 | 27 | 36 | 32 | 47 | 39 | 89 | 84 | 99 | 100 | 100 | 100 |
| Yorkshire and Humberside | 10 | 16 | 15 | 20 | 25 | 22 | 33 | 39 | 79 | 70 | 94 | 99 | 93 | 100 |
| North East England | 7 | 12 | 11 | 14 | 18 | 16 | 24 | 37 | 75 | 67 | 89 | 97 | 88 | 100 |
| North West England | 6 | 9 | 9 | 11 | 12 | 11 | 16 | 38 | 68 | 59 | 81 | 91 | 83 | 96 |
| Wales | 7 | 10 | 9 | 11 | 14 | 12 | 18 | 38 | 70 | 61 | 84 | 94 | 87 | 98 |
| East Scotland | 9 | 13 | 12 | 16 | 18 | 16 | 22 | 41 | 71 | 63 | 83 | 89 | 82 | 96 |
| West Scotland | 6 | 8 | 7 | 9 | 9 | 9 | 11 | 40 | 58 | 54 | 70 | 77 | 69 | 86 |
| North Scotland | 6 | 8 | 7 | 9 | 9 | 9 | 12 | 41 | 52 | 46 | 63 | 66 | 58 | 76 |
| Northern Ireland | 3 | 5 | 4 | 5 | 6 | 6 | 8 | 39 | 63 | 56 | 76 | 86 | 79 | 94 |
| FWI 99th percentile | ||||||||||||||
| South West England | 4 | 14 | 12 | 21 | 32 | 26 | 52 | 28 | 79 | 73 | 91 | 97 | 94 | 100 |
| South East England | 4 | 18 | 14 | 26 | 39 | 35 | 64 | 26 | 82 | 79 | 94 | 99 | 98 | 100 |
| London | 4 | 18 | 15 | 27 | 40 | 36 | 63 | 28 | 82 | 74 | 93 | 97 | 96 | 100 |
| East of England | 4 | 16 | 13 | 24 | 35 | 31 | 60 | 29 | 82 | 75 | 92 | 99 | 97 | 100 |
| West Midlands | 4 | 15 | 13 | 25 | 38 | 27 | 62 | 26 | 87 | 79 | 97 | 100 | 98 | 100 |
| East Midlands | 4 | 14 | 12 | 24 | 37 | 27 | 59 | 26 | 84 | 79 | 96 | 99 | 98 | 100 |
| Yorkshire and Humberside | 4 | 11 | 9 | 20 | 31 | 20 | 48 | 28 | 78 | 72 | 91 | 96 | 92 | 100 |
| North East England | 4 | 10 | 8 | 19 | 23 | 18 | 41 | 27 | 79 | 69 | 89 | 94 | 89 | 99 |
| North West England | 4 | 9 | 8 | 14 | 22 | 14 | 34 | 32 | 70 | 63 | 83 | 91 | 85 | 96 |
| Wales | 4 | 10 | 9 | 17 | 26 | 19 | 44 | 30 | 70 | 67 | 89 | 95 | 91 | 98 |
| East Scotland | 4 | 8 | 7 | 13 | 16 | 12 | 24 | 32 | 66 | 58 | 80 | 87 | 80 | 95 |
| West Scotland | 4 | 7 | 6 | 10 | 12 | 10 | 17 | 34 | 54 | 51 | 70 | 76 | 69 | 87 |
| North Scotland | 4 | 5 | 5 | 7 | 8 | 7 | 11 | 32 | 47 | 44 | 56 | 64 | 57 | 75 |
| Northern Ireland | 4 | 8 | 7 | 13 | 17 | 13 | 30 | 32 | 58 | 52 | 78 | 90 | 77 | 96 |
| FFMC 99th percentile | ||||||||||||||
| South West England | 4 | 13 | 12 | 19 | 27 | 22 | 39 | 30 | 79 | 76 | 93 | 96 | 94 | 98 |
| South East England | 4 | 17 | 14 | 23 | 36 | 30 | 54 | 30 | 84 | 79 | 95 | 99 | 98 | 100 |
| London | 4 | 19 | 16 | 27 | 42 | 37 | 63 | 28 | 85 | 80 | 96 | 100 | 99 | 100 |
| East of England | 4 | 21 | 17 | 28 | 45 | 37 | 67 | 30 | 91 | 85 | 97 | 100 | 100 | 100 |
| West Midlands | 4 | 14 | 12 | 21 | 32 | 26 | 51 | 29 | 83 | 75 | 97 | 100 | 99 | 100 |
| East Midlands | 4 | 15 | 13 | 24 | 37 | 30 | 55 | 29 | 84 | 78 | 97 | 100 | 100 | 100 |
| Yorkshire and Humberside | 4 | 13 | 11 | 21 | 27 | 24 | 44 | 32 | 80 | 73 | 95 | 98 | 96 | 100 |
| North East England | 4 | 12 | 10 | 18 | 23 | 19 | 39 | 32 | 75 | 70 | 89 | 94 | 91 | 100 |
| North West England | 4 | 9 | 8 | 13 | 16 | 14 | 24 | 29 | 67 | 58 | 82 | 90 | 85 | 96 |
| Wales | 4 | 10 | 9 | 14 | 19 | 15 | 28 | 34 | 73 | 67 | 88 | 94 | 90 | 96 |
| East Scotland | 4 | 10 | 8 | 14 | 18 | 14 | 26 | 31 | 74 | 66 | 85 | 93 | 88 | 98 |
| West Scotland | 4 | 7 | 6 | 9 | 11 | 9 | 16 | 31 | 59 | 52 | 73 | 80 | 71 | 88 |
| North Scotland | 4 | 6 | 6 | 7 | 9 | 8 | 12 | 28 | 53 | 48 | 59 | 71 | 65 | 78 |
| Northern Ireland | 4 | 10 | 8 | 15 | 19 | 15 | 28 | 32 | 73 | 64 | 89 | 94 | 87 | 98 |
| ISI 99th percentile | ||||||||||||||
| South West England | 4 | 7 | 6 | 10 | 14 | 11 | 20 | 33 | 64 | 56 | 75 | 85 | 76 | 92 |
| South East England | 4 | 10 | 8 | 14 | 20 | 18 | 31 | 32 | 73 | 67 | 84 | 92 | 90 | 97 |
| London | 4 | 11 | 9 | 16 | 23 | 20 | 37 | 33 | 74 | 67 | 84 | 94 | 92 | 99 |
| East of England | 4 | 9 | 8 | 13 | 18 | 16 | 29 | 33 | 79 | 69 | 88 | 96 | 93 | 100 |
| West Midlands | 4 | 9 | 7 | 12 | 19 | 13 | 30 | 31 | 77 | 62 | 87 | 96 | 86 | 99 |
| East Midlands | 4 | 8 | 7 | 12 | 17 | 14 | 26 | 29 | 77 | 66 | 91 | 98 | 95 | 100 |
| Yorkshire and Humberside | 4 | 7 | 5 | 8 | 12 | 9 | 18 | 31 | 67 | 49 | 79 | 90 | 76 | 97 |
| North East England | 4 | 6 | 5 | 9 | 12 | 7 | 17 | 32 | 57 | 46 | 77 | 88 | 68 | 97 |
| North West England | 4 | 6 | 5 | 7 | 9 | 6 | 13 | 33 | 56 | 45 | 67 | 77 | 62 | 87 |
| Wales | 4 | 6 | 5 | 8 | 10 | 7 | 15 | 32 | 55 | 47 | 69 | 80 | 60 | 88 |
| East Scotland | 4 | 5 | 4 | 7 | 9 | 6 | 12 | 32 | 51 | 39 | 64 | 77 | 59 | 86 |
| West Scotland | 4 | 4 | 4 | 6 | 6 | 5 | 8 | 32 | 40 | 35 | 54 | 58 | 47 | 69 |
| North Scotland | 4 | 4 | 4 | 5 | 5 | 5 | 6 | 32 | 39 | 32 | 48 | 47 | 43 | 59 |
| Northern Ireland | 4 | 5 | 5 | 7 | 8 | 7 | 11 | 29 | 43 | 39 | 62 | 69 | 60 | 85 |
There is a large difference between the two ensembles of projected change in climate. The increase in fire danger is much greater with the HadGEM3 ensemble than the CMIP5 ensemble, consistent with the differences in change in climate between the two ensembles (figure 2). The HadGEM3 ensemble members produce greater temperature increases, greater reductions in relative humidity, and larger reductions in spring and summer rainfall than the CMIP5 ensemble, so produce larger changes in fire danger. There is also a large uncertainty range across each ensemble (section 5.1).
The projections imply a very large increase in fire danger across the UK, particularly in the south, east and central regions of England, but the changes depend on the indicator due to their different sensitivity to change in climate (see section 5.1) and the differences between the absolute and variable (percentile) indicators.
The number of days greater than the MOFSI 'very high' threshold is greatest in southern and eastern England (increasing from an average of 20 d yr−1 in southern England over the period 1981–2010 to up to 70 by the 2050s and up to 111 by the 2080s). The likelihood of experiencing more than the current mean number of days rises from 37% to up to 98% by the 2050s and 100% by the 2080s. Further north in England the numbers of days only begin to increase substantially by the 2040s, and in west and north Scotland and Northern Ireland change little through the century in absolute terms, but the likelihood of experiencing more than the current mean increases (from 27% now to up to 64% by the 2080s in northern Scotland).
The number of days above the MOFSI 'exceptional' threshold remains low through the 21st century in northern England, Wales, Scotland and Northern Ireland, but increases substantially after the 2050s in southern and, particularly, eastern England (up to an average of 3 d per year by the 2080s and a likelihood of 68%).
The number of days above the DHA amber warning threshold increases across more of the UK, but increases are considerably higher in the south and east. By the 2050s there could be more than 30 d per year with DHA amber warnings across south central England, compared with around 10–15 now, and at least an 80% chance of experiencing more than the current mean. In eastern Scotland the mean increases from 9 to up to 16 d per year by the 2050s, and the chance of having more than the mean increases to between 66% and 76%.
Although the reference period danger is (by definition) the same for the three percentile indicators and constant across the UK, figures 6 and 7 show differences in changes between the indicators and across space. The spatial variability reflects variability in the change in climate across the UK—bigger increases in temperature, bigger reductions in relative humidity and bigger reductions in rainfall in the south—and the differences between the FWI, FFMC and ISI indicators reflects their different sensitivity to different aspects of climate change (see section 5.1). FFMC is relatively insensitive to changes in rainfall but reductions in rainfall lead to increases in FWI. The greatest change in the FWI indicator is therefore in areas with the greatest reductions in rainfall, so the largest increase is therefore in the south rather than the east of England. ISI is more directly affected by changes in windspeed than the other indicators, and the projected reductions in windspeed explain why this indicator increases less rapidly than the others.
The MOFSI and DHA indicators are based on absolute, rather than spatially-variable percentile thresholds. The spatial variability in these indicators is therefore more determined by variability in the reference conditions—specifically how often the thresholds are currently exceeded—than by variability in climate change.
4.2. Seasonal distribution of change in fire danger
More fires currently occur in spring than summer, and few fires occur during winter and autumn (de Jong et al 2016, Glaves et al 2020). Figure 8 shows change in seasonal fire danger across the UK for the six indicators (note that the axis limits vary between regions because the purpose of the plot is to show differences between seasons, not regions). MOFSI very high and exceptional warnings currently occur almost exclusively in summer and summer sees the greatest increase, but in the east of England fire danger increases too in autumn. There is little apparent increase in spring fire danger with the MOFSI exceptional warning indicator. In contrast, the DHA amber warning indicator has the greatest number of danger days in spring: this is primarily because the criteria used to define an amber warning change between May and June. The number of danger days in summer, however, increases more rapidly than the number of danger days in spring. The three percentile indicators show the greatest increase in fire danger in summer and autumn, with much smaller increases in spring. This suggests that the increase in fire risk (a product of chance of ignition and fire danger) may be smaller than the increase in annual fire danger.
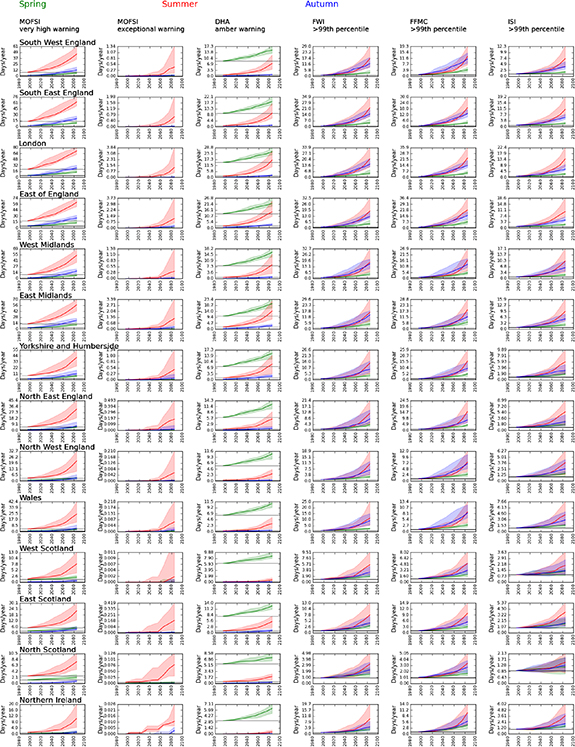
Figure 8. Seasonal fire danger with high (RCP8.5) emissions: median and range across the 15 HadGEM3 ensemble members. Note that the vertical axis limits vary between regions. The HadGEM3 ensemble. The plots show the range across ensemble members, together with the median.
Download figure:
Standard image High-resolution image4.3. Effect of reducing emissions on fire danger
Figure 9 compares the annual fire danger indicators under high (RCP8.5) and low (RCP2.6) emissions. It demonstrates that reducing emissions to a level consistent with an increase in global mean temperature of around 2 °C reduces very substantially the increase in fire danger, but does not eliminate it. With this low emissions scenario danger increases most in south east and eastern England, but is little changed across northern England, Wales, Scotland and Northern Ireland.

Figure 9. The effect of reducing emissions: regional fire danger with RCP8.5 and RCP2.6, using the HadGEM3 ensemble. The plots show the range across ensemble members, together with the median.
Download figure:
Standard image High-resolution image5. Drivers of change in fire danger
5.1. Relative importance of different dimensions of climate change and sources of uncertainty
The changes in fire danger discussed in the previous section are driven by changes in temperature, relative humidity, rainfall, windspeed and—to a much lesser extent via potential evaporation—net radiation. Figure 10 shows the relative importance of these different drivers for each indicator by region over the period 2071–2100, with the HadGEM3 ensemble. Each panel shows the effect of (a) just change in temperature (holding rainfall, relative humidity, windspeed and net radiation constant at 1981–2010 levels), (b) change in temperature and rainfall, (c) change in temperature and vapour pressure, (d) change in temperature, vapour pressure and rainfall, and finally (e) change in all variables.

Figure 10. The relative importance of changes in temperature, rainfall, relative humidity and windspeed on indicators of fire danger, by region over the period 2071–2100 with the HadGEM3 RCP8.5 ensemble. The plots show the median and range: the grey dashed lines show the 1981–2010 mean. Note that the axis limits vary between regions.
Download figure:
Standard image High-resolution imageJust under half of the change in the FFMC percentile indicator is due to the increase in temperature, and just over half is due to the reduction in relative humidity (with the importance of relative humidity less further north where the changes are smaller). Change in rainfall has very little effect on change in FFMC. Most of the uncertainty in change in FFMC is due to uncertainty in change in relative humidity.
Change in rainfall has a greater effect on the ISI percentile indicator, although is still small compared to the effects of change in relative humidity. ISI includes windspeed, so the general reduction in windspeed offsets the effect of changes in the other drivers. The uncertainty range is again largely driven by uncertainty in the change in relative humidity.
FWI combines FFMC and ISI, with other components (figure 1). The sensitivity to windspeed is less than for ISI, and the effect of changes in rainfall are increased compared to FFMC. The rainfall and relative humidity changes have a similar magnitude effect—except in the north where relative humidity changes are small—and the uncertainty in changes in FWI are therefore driven by both uncertainty in rainfall and relative humidity. The two are not well correlated across the ensemble members, so the uncertainty range in FWI is large.
The effects of changes in different climate variables on the MOFSI indicator is similarly to effects on FFMC, but numerically different because MOFSI is based on absolute thresholds which are correspond to different percentiles in different parts of the UK. Uncertainty in the MOFSI exceptional danger level is particularly wide, and this is due to the combined effect of uncertainty in humidity and rainfall changes.
The amber DHA warning is based on combinations of the component codes, but sensitivity to change and the major sources of uncertainty are similar to those for the FFMC indicator.
Changes in fire danger are therefore a function of increases in temperature, reductions in relative humidity and, to a lesser extent, reductions in rainfall. For a given ensemble, uncertainty in relative humidity and rainfall changes have the largest effect on uncertainty in change in fire danger. The difference between the HadGEM3 and CMIP5 ensembles is partly due to the greater increase in temperature with the HadGEM3 ensembles, but partly due also to the greater reduction in relative humidity and, at least in some seasons, rainfall.
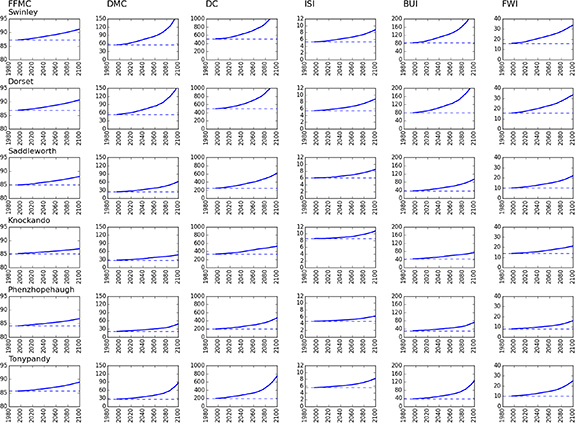
5.2. Changes in different components of fire danger
The FWI indicator is built up from five components (figure 1). Figure 11 shows the percentage change in these components, plus the FWI, for the six sample locations, for one member of the HadGEM3 ensemble. Each plot shows the annual 95th percentile of each component, calculated as a 30 year running mean. Note that the final FWI indicator is not a simple average of the five components, as each is given a different weight.
Figure 11. Change in the components of the FWI, at six sample locations. One member of the HadGEM3 ensemble. The plots show the 30 year running mean of the 95th percentile of the annual value of each component. The dashed line is the 1981–2010 mean.
Download figure:
Standard image High-resolution image
All the components of the FWI increase through time, and therefore all contribute to the increase in FWI. The proportional change in 95th percentile value of FFMC is small, but this component varies relatively little from year to year and small changes correspond to large changes in the frequency with which a given absolute value is passed.
6. Conclusions and implications
This paper has presented an evaluation of change in fire danger across the UK due to climate change. Fire risk is a function of danger and the chance of ignition, and given that the chance of ignition varies differently over space and through the year to fire danger, changes in risk will not necessarily follow exactly changes in danger. However, the results give an indication of how fire hazard in the UK will change over the 21st century.
The results show that fire danger increases across the whole of the UK, but the extent and geographical variability in change depends on the specific indicator of fire danger. The absolute danger now and into the future is greatest in the south and east of England, but danger increases too further north. The increase in fire danger is greatest in summer but this is not necessarily when the risk is highest due to the timing of sources of ignition. Reducing emissions to levels consistent with achieving international climate policy targets reduces significantly the increase in fire danger, but does not eliminate it.
There is a wide uncertainty range in how fire danger increases through the 21st century due to variability across plausible climate scenarios. Approximately half of the increase is due to increases in temperature and most of the rest is due to reductions in relative humidity. There is a large difference between the projections of change in danger between the two ensembles of climate projections, and the HadGEM3 ensemble generates larger increases in danger than the CMIP5 ensemble. This is because the HadGEM3 ensemble not only produces larger increases in temperature, it also produces greater reductions in relative humidity. The uncertainty in projected changes in fire danger is therefore determined by, in approximately equal proportions, by the combined effects of uncertainty in change in temperature, relative humidity and rainfall (uncertainty in rainfall has very little effect on the FFMC indicator).
There are several implications of these results. First, the projected large increase in wildfire danger across the UK implies that the risk should be given increased attention not only in emergency planning (such as in the National Security Risk Assessment and National Risk Register, Local Resilience Forum's Community Risk Registers and Fire and Rescue Service's Integrated Risk Management Planning) but also in land use spatial planning and management (infrastructure, development, agriculture, conservation, forestry etc). Second, greater caution and more stringent guidelines are needed for planning activities which can trigger wildfires. Controlled and prescribed burning is an important component of lowland and upland land management, for example, and changes in the risk of a fire spreading could influence practices. Third, the different indicators of danger give subtly different indications of where and how danger will change, and this implies a need for the further development of fire danger indices and indicators more finely tuned to UK fuel sources and meteorological conditions. Fourth, the results show change in fire danger: change in wildfire risk (in terms of area burnt, for example), will be strongly influenced by where fires are started and how the sources and locations of ignition might change. An improved understanding of current and future fire risk therefore needs estimates of change in danger to be combined with models characterising the likelihood of ignition.
Acknowledgments
This research was funded through the UKRI Climate Resilience programme (Grant No. NE/S016481/1). We thank Dr Ian Lisk, Met Office, for providing guidance on the MOFSI system, and Dr Jesús San-Miguel-Ayanz of the European Commission Joint Research Centre for providing the EFFIS fire data for the UK.
Data availability statement
All data that support the findings of this study are included within the article (and any supplementary files).