

Abstract
Seasonal forecast systems have demonstrated significant skill in forecasting the winter North Atlantic Oscillation (NAO) in recent years. This skill is a result of influences that have remote origins, such as the El Niño-Southern Oscillation or the stratospheric Quasi-Biennial Oscillation. Here we assess the role of the tropical troposphere and the extra-tropical stratosphere in driving North Atlantic-European wintertime sea level pressure, using numerical experiments in which conditions in these regions are constrained to be similar to observational reanalyses. We show that both of these remote regions play a role in influencing surface circulation. In particular, the East Atlantic Pattern—the second most important mode of regional winter variability after the NAO—is linked to convective anomalies in the tropical Atlantic. Tropical and stratospheric influences are shown to lead to the reproduction of observed large-scale pressure patterns in the majority of winters, but often by a single driver rather than a blend of both. We argue that while stratospheric influences are well represented, tropical influences are underrepresented in winter predictions. These results highlight tropical Atlantic predictability as an important focus for further research.
Export citation and abstract BibTeX RIS

Original content from this work may be used under the terms of the Creative Commons Attribution 4.0 license. Any further distribution of this work must maintain attribution to the author(s) and the title of the work, journal citation and DOI.
1. Introduction
Recent years have seen significant advances in the ability to forecast the winter North Atlantic Oscillation (NAO) at seasonal timescales (Scaife et al 2014, Athanasiadis and Bellucci 2017, Baker et al 2018). The NAO is the main driver of winter conditions over Northern Europe, with impacts on near surface temperature, winds, storminess and precipitation (Waltz et al 2018, West et al 2019), transport (Palin et al 2016), energy (Clark et al 2017) and hydrology (Svensson et al 2015), so improved forecasts of the NAO can provide major benefits. Skill for the NAO in models relies on capturing physical processes in the stratospheric polar night jet (Kidston et al 2015) and tropospheric Rossby wave propagation from the tropics (Scaife et al 2017). The latter is dependent on accurate simulation of the sources of these waves, resulting from shifts in convective rainfall driven by oceanic anomalies, primarily the El Niño-Southern Oscillation (ENSO, Toniazzo and Scaife 2006, Ineson and Scaife 2009).
While NAO skill is clearly highly desirable for a successful seasonal prediction, it is also clear that winter variability other than the NAO can make important contributions. Recent case studies of the performance of real-time operational forecasts provide examples of the significant impacts this additional variability can have on seasonal weather patterns. The record wet winter of 2013–14 in Northern Europe was associated with both the positive NAO (Huntingford et al 2014, Knight et al 2017) and a persistent trough to the west of the UK. This latter component led to south-westerly flow over the UK, tapping into to a moister airmass than that usually associated with positive NAO alone. The 2013–14 case, and the record wet start to winter 2015–16 (Maidens et al 2019), have been linked with Rossby waves originating in the Tropical Atlantic sector, and illustrate the important role played more generally by the tropics in giving rise to meridional flow in the North Atlantic-European mid-latitudes.
Principal component analysis of winter North Atlantic surface pressure attributes about 40% of the variance to the NAO (Fil and Dubus 2005, Zubiate et al 2016). The East Atlantic Pattern (EAP), characterised by ridging or troughing of surface pressure in the mid-latitude North Atlantic (centred on approximately 50° N, 25° W), is usually found as the second mode of variability (16% of variance). Along with the Scandinavian pattern (Fil and Dubus 2005), the EAP contains important information about the flow over North West Europe (Hall and Hanna 2018). It is known that these circulation patterns lead to different weather types and societal impacts (Gleeson et al 2019). Currently, seasonal forecast systems show limited skill in forecasting patterns other than the NAO (Baker et al 2017, Walz et al 2018), although some modest skill may be present for multimodel systems (Lledó et al 2020).
This study investigates the impact of tropical tropospheric and extratropical stratospheric influences on winter pressure patterns in the North Atlantic European sector. These factors have been shown to have teleconnections to the region (e.g. Stan et al 2017, Wulff et al 2017, Domeisen et al 2018). Here we look at the impact on surface pressure patterns more generally, and in particular at the EAP as the next mode of variability after the NAO. We use the well-established technique of atmospheric relaxation (e.g. Greatbatch et al 2012), in which the values of model variables in a given region are relaxed towards a reanalysis, so that the impacts outside the chosen region can be estimated. In effect, this allows us to address the question 'with perfect representation of the tropics or stratosphere, how much would predictions of the extra-tropical atmosphere at the surface improve?' Note that a perfect representation, imposed from reanalysis, is not the same as a perfect forecast, as there is no guarantee that the information added is in principle predictable. Nevertheless, analysis of connections may highlight aspects of prediction systems that could be a focus for development work.
2. Experiment design, data and index choice
Three sets of experiments were carried out using the Met Office GloSea5 seasonal prediction system (MacLachlan et al 2015). Each set consists of a historical reforecast (hindcast) over the period 1993–2015, comprising an ensemble of simulations initialised on 1 November of each year covering the winter season (December to February or DJF). Ensemble spread was generated via stochastic physics. The system uses the HadGEM3 climate model (Hewitt et al 2011) with a resolution of approximately 60 km in mid-latitudes, 85 vertical levels with a well-resolved stratosphere, and a quarter-degree ocean resolution. The freely-running hindcast, HCAST, consists of 21 members per year which were allowed to evolve freely from observed initial conditions. The relaxation experiments (30 members per year) had wind components u and v and temperature T relaxed towards reanalysis over a chosen region (with tapering on the horizontal and vertical boundaries) with an e-folding time of 6 h. The tropical relaxation experiment, TROP, relaxed the atmosphere between 22.5° North and South, up to a height of approximately 18 km (this is above the tropopause, but well below the level of the quasi-biennial oscillation). The stratospheric relaxation experiment, STRAT, relaxed the atmosphere north of 45° N and above 18 km. Further details of the experimental design can be found in (Maidens 2019).
Correlations of the model results with reanalysis were carried out using ERA-Interim (ERAI; Dee et al 2011) mean sea level pressure (MSLP). Where pressure-based indices were regressed onto global rainfall, data from the Global Precipitation Climatology Project (GPCP) were used (Pendergrass and National Center for Atmospheric Research Staff 2016). The leading modes of MSLP variability over the North Atlantic are well known (Fil and Dubus 2005, Comas-Bru and McDermott 2013, Gleeson et al 2019), and have impacts on European climate (Moore and Renfrew 2011, Hall and Hanna 2018). The NAO index we use is the difference in MSLP between the linearly interpolated values for Reykjavik and the Azores (64.0° N, 22.6° W and 37.8° N, 25.7° W respectively). This is the index most widely utilised (Cropper et al 2015), although other indices, such as derived from data for Reykjavik and Gibraltar (Jones et al 1997) or empirical orthogonal functions (EOF) of MSLP or 500 hPa geopotential height are also frequently used (Cassou et al 2004, Hurrell and Deser 2009). The East Atlantic Pattern Index (EAI) is commonly defined using the second rotated EOF (Barnston and Livezy 1987), but a station based series for Valentia Observatory, Ireland (51.9° N, 10.2° W), has been used in some studies (Moore and Renfrew 2011, Comas-Bru et al 2016). Most analyses feature a centre of action in the central North Atlantic west of Ireland, thus, for the EAP, we choose to use an index defined in terms of area-averaged MSLP over the region 45°–60° N, 15°–30° W. This is in preference to a station-based index at Valentia because the latter is not located at the centre of action of the EAP, although results obtained using a point index at Valentia are broadly similar (not shown).
3. Results
We first compare the variability of winter ensemble mean MSLP in the relaxation experiments with observations (figure 1, left-hand column). This allows us to highlight the regions where the stratosphere and the tropics have teleconnections with atmospheric circulation. In HCAST, predictability is high in the tropics but generally less so in the extratropics. Exceptions include the North Pacific Ocean, parts of the Southern Hemisphere mid-latitudes and parts of the northern high latitudes. There are positive correlations over each of the conventional poles of the NAO (Iceland and the Azores), albeit not statistically significantly so (in contrast to the GloSea5 operational system which has skill of 0.62; this HCAST has lower skill but was chosen to match the model used for the relaxation experiments, as discussed below). TROP tends to extend the region of high correlation further into mid-latitudes, and even to high latitudes in the Southern Hemisphere. STRAT maintains high correlations in the tropics and increases correlations in the northern high latitudes. Changes in correlation (figure 1, right-hand column) with respect to HCAST show that the tropics and the stratosphere have approximately complementary influences. The stratospheric relaxation experiment shows increased correlations in high latitudes and over the sub-tropical Atlantic Ocean and the Mediterranean. The tropical relaxation tends to show increased correlation in the mid-latitudes, particularly over the Atlantic sector. Since the atmospheric circulation is proportional to gradients in MSLP, this confirms that both tropics and stratosphere influence European weather. Our results are similar to those of Hansen et al (2019), who performed relaxation experiments using the ECMWF Integrated Forecast System (IFS).
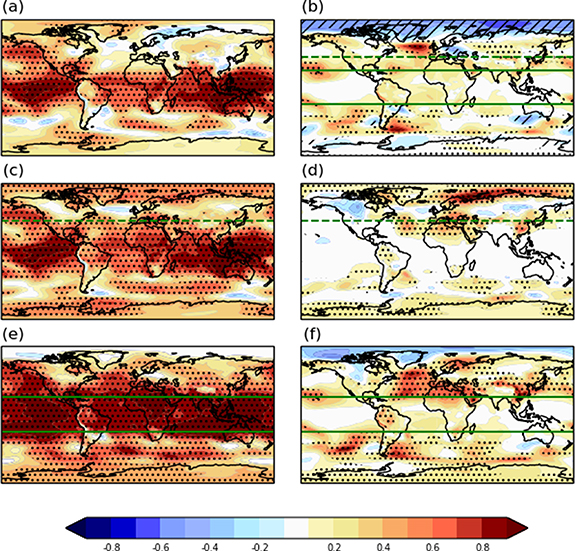
Figure 1. Influence of the stratosphere and tropics on atmospheric circulation. Correlation with DJF ERA-Interim MSLP for (a) HCAST, (c) STRAT and (e) TROP. Stippling indicates significance at the 95% level (two-tailed t-test). Panel (b) shows TROP minus STRAT, with stippling indicating regions where only TROP is statistically significant and hatching regions where only STRAT is significant. The change in correlation relative to the hindcast is shown in (d) STRAT minus HINDCAST and (f) TROP minus HCAST. Stippling shows regions where the correlation is statistically significant in the relaxation experiment but not in the hindcast. The green lines show the extent of the relaxation region in STRAT (dashed) and TROP (solid).
Download figure:
Standard image High-resolution imageA direct comparison of the two relaxation experiments (figure 1(b)) shows that tropical relaxation uniquely improves correlation in the central North Atlantic, in a region to the west of Europe, close to the centre of action of the EAP (Gleeson et al 2019). In the deep tropics, there is little difference in the Pacific or Indian Ocean (indicating that HCAST is already highly skilful in these regions: figures 1(d) and (f)), but in the tropical Atlantic there are regions where correlations in TROP are increased by up to 0.3 (albeit not statistically significantly: figure 1(f)). There is also a region of statistically significant improvement over the western Amazon Basin/Peru. Just within the boundaries of the relaxation region at 20° N we see two regions of statistically significant improvement, one east of the dateline, and the other east of Cuba. Both these regions have been identified in case studies as source regions for Rossby waves (Knight 2017, Maidens et al 2019).
The results of the TROP experiment suggest that it alone is able to match the variations in MSLP in the East Atlantic region. Figure 2 shows the time series of the standardised EAI for TROP and for reanalysis. The ensemble mean of TROP has a correlation with the observed EAI of 0.72; neither HCAST (−0.02) nor STRAT (−0.14) show significant correlation. We can compare this to the NAO, where the timeseries from TROP correlated with ERAI gives 0.59, compared to 0.53 for STRAT and 0.32 for HCAST (this value is considerably lower than that obtained for the Met Office's operational system, as noted above). This value is less than the NAO skill previously reported for the operational hindcast as the ensemble used here is smaller and it is known that correlation skill increases with ensemble size (Scaife et al 2014). Additionally, sampling effects create a spread in the NAO skill between different sets of hindcasts. Nevertheless, these values for the NAO confirm what previous studies have shown, namely that both the stratosphere and tropical troposphere are sources of predictability for the NAO. This suggests that the cause of a large fraction of winter mean EAP variations is to be found in the tropics. Note, however, that the high correlation does not imply predictability as TROP uses information from observations. The lack of skill for this region in the HCAST could mean that the GloSea5 system has errors but it is also possible that the tropical variations forcing the EAP are simply fundamentally unpredictable.

Figure 2. Standardised timeseries for the East Atlantic Timeseries of the EAI for ERAI (black) and TROP (green), giving a correlation of 0.72.
Download figure:
Standard image High-resolution imagePrevious work has shown that Rossby wave sources and resulting wave trains from the tropics to mid-latitudes are closely tied to tropical rainfall anomalies. Tropical rainfall variations and Rossby wave sources are generally predictable on seasonal timescales, at least at the ocean basin scale (Scaife et al 2017). Rossby wave sources occur where regions of divergent flow aloft meet strong gradients of absolute vorticity (Sardeshmukh and Hoskins 1988). With this link between rainfall and extratropical wave propagation in mind, figure 3 shows the regression of the EAI with tropical rainfall (colours) and with 200 hPa azonal streamfunction anomaly (contours; ERAI and ensemble means only). The observed relationship (figure 3(a)) shows anomalous rainfall near the main centre of action of the EAP, as expected since rainfall anomalies are associated with anomalies in surface pressure. The rainfall regression in the North Atlantic has a negative sign and is offset to the south of the region used to define the EAI, consistent with the frontal structure of cyclones in the North Atlantic storm track. Interestingly, however, there is an additional region in the tropical North Atlantic to the north of South America and east of the Caribbean, where the EAI has a positive regression with anomalous rainfall (such that high rainfall appears to be linked with high EAI). It is worth noting that this region has appeared in several case studies of forecast performance for individual years as a source of Rossby wave trains (Knight et al 2017, Maidens 2019) and is highlighted in studies of the predictability of the NAO (Cassou 2008, Scaife et al 2017) and ENSO teleconnections (Ayarzagüena et al 2018). The wave train visible in the regression of EAI onto 200 hPa azonal stream function reinforces the importance of this source region. In the absence of information from the streamfunction regression, it might be possible to argue that the pressure anomalies in the EAI region are driving rainfall anomalies elsewhere; however, the wave activity visible in the streamfunction anomalies indicates strongly that the source region for the activity lies in the tropics, and drives extra-tropical circulation patterns rather than vice versa. There is also a region of negative rainfall regression in TROP over the Eastern equatorial Pacific, suggesting a link with ENSO (although this is not evident in the reanalysis). It is possible this may be connected with eastward extension of the Walker circulation in strong El Niño years (Toniazzo and Scaife 2006).

Figure 3. Link between the East Atlantic Pattern and global rainfall. Regression of EAI with global rainfall, colours (mm d−1 hPa−1) and EAI with 200 hPa azonal streamfunction anomaly, contours ( ), for (a) ERAI MSLP and GPCP rainfall, (b) HCAST individual members, (c) TROP individual members, (d) HCAST ensemble mean and (e) TROP ensemble mean. Values in the rainfall regression which are not significant at the 90% level are masked out. Contour intervals for the streamfunction regression are
  for ERAI data,
  for model data, with negative values in grey. Heavier contours are significant at the 90% level.
Download figure:
Standard image High-resolution imageThe regression of the EAI with rainfall for individual ensemble members is shown for HCAST (figure 3(b)) and TROP (figure 3(c)). The similarity between these and the regression patterns for ERAI suggest that the model is capable of capturing the teleconnection between the tropical Atlantic and the EAI. In contrast, the regression of the ensemble mean EAI and rainfall in HCST (figure 3(d)) shows no connection with the tropical Atlantic, and the wave activity is very weak (and not statistically significant). Nevertheless, the ensemble mean of TROP (figure 3(e)) shows a tropical regression very similar to that found using ERAI. This suggests that while the teleconnection is present in the model, it may simply be unpredictable, so that different forcing of the EAI in individual members cancels out in the ensemble mean. When common tropical conditions are imposed in each member by relaxation, this creates a common forcing of the EAP that creates the regression between EAI and the tropics. There is evidence of some wave propagation from northern South America/Central America north-eastwards, but the positive and negative modes are all shifted relative to those in ERAI. However, the wave activity evident in the streamfunction anomalies strongly suggests that the tropics drives the extra-tropics, rather than vice versa.
In order to test the influence of the tropical west Atlantic/Caribbean on wave activity, we also regressed a tropical rainfall index (area average of 10°–20° N, 40°–70° W) onto the 200 hPa azonal streamfunction anomaly, but the results were inconclusive. A wave-like pattern emanating from the Caribbean/north coast of South America was seen in ERAI, but not in HCAST or TROP. The relaxation experiments described here, however, relax u, v and T towards reanalysis, but not moisture fields. This would explain why regressions onto MSLP seem to show a wave train in the relaxation experiments, since, as we noted above, Rossby wave sources are crucially dependent on the interaction of upper level divergent flow with the gradient of vorticity (Sardeshmukh and Hoskins 1988), and these flows are constrained by the relaxation process. In other words we have imposed the right dynamics, regardless of whether or not the outflow aloft is connected with either deep convection or a correct representation of the rain fields. However, because moisture is not constrained by the relaxation experiment, it may be that the model rainfall does not show the same relationship as is seen in reanalysis. The overall predictability of rainfall in this region, and the question of whether it could be predicted at a level of sufficient spatial resolution, is the subject of ongoing research. In summary, the regression analysis shows the tropical Atlantic is key for the teleconnections that influence the EAP but it remains unclear whether there is any predictability for conditions in the tropical source region.
We have shown above that tropical signals are important for driving the EAP, the second mode of variability in mid-latitudes in the North Atlantic. The first mode, the NAO, is also influenced by the tropics but additionally has an influence from the stratosphere. These individual modes represent the principal contributions to the meridional and zonal flow respectively, so taken together explain much of the overall patterns of regional MSLP variability. Here we use pattern correlations over the North Atlantic-European region (30–80 N, 80 W–40 E) to provide a measure how well a particular experiment can reproduce surface circulation patterns in a given winter. This recognises that although the amplitude of predicted signals is often underestimated in the Atlantic, the patterns are largely unaffected (the signal-to-noise paradox: Eade et al 2014, Smith et al 2020).
A sample of the anomaly patterns produced by the relaxation experiments is shown in figure 4, comparing ensemble means for winters between 2008–9 and 2013–14 with reanalysis (anomalies relative to the hindcast period climatology, 1992–3 to 2015–16). This subset of years is representative of the balance of high and low pattern correlations seen in the relaxation experiments. To assess the significance of pattern correlations between the simulated and reanalysis patterns, we calculate pattern correlations for random pairs of distinct ERAI winter mean MSLP anomalies (without repetition). The correlation level exceeded by 10% of these unrelated trials is 0.7. This number is relatively high because the regional atmospheric circulation is dominated by few large-scale modes like the NAO and EAP. With relatively few degrees of freedom, moderately high pattern correlations can frequently be generated by chance. Nevertheless, in four of the 6 years shown, the match between the ensemble mean and reanalysis anomalies exceeds this threshold. For example, the mean winter 2010–11 MSLP pattern is well reproduced in the ensemble mean of TROP. On the other hand, the MSLP anomaly pattern in winter 2012–13 is well reproduced by the ensemble mean of STRAT, while in the record negative NAO year of 2009–10, correlations with both STRAT and TROP are high. Note that the pattern correlation of TROP with ERAI for winter 2013–14 is 0.58, below the 0.7 significance limit, despite previous work demonstrating tropical connections in that winter (Scaife 2017). This illustrates that the significance test is stringent, and that remote influences may be present in more winters than just those reaching this confidence threshold. As noted above, the signal in the models is lower than that in reanalysis even when the pattern correlation is high, which may be due to tropospheric internal atmospheric variability, but is also characteristic of the signal to noise issue displayed by most seasonal to decadal prediction systems at a variety of timescales (Smith et al 2020).
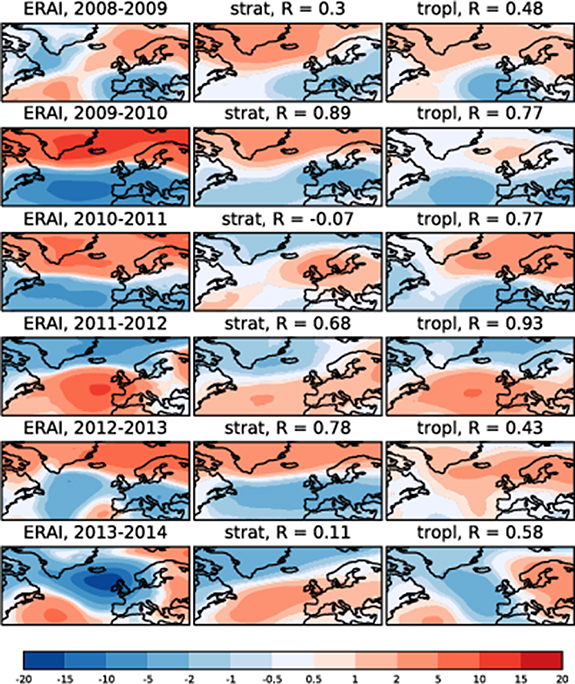
Figure 4. North Atlantic-European winter MSLP anomalies (hPa) for a representative sample of years. Columns show (from left): ERAI, STRAT, TROP. All simulated results show the ensemble mean. R gives the area-weighted pattern correlation between the ensemble mean and reanalysis for each winter.
Download figure:
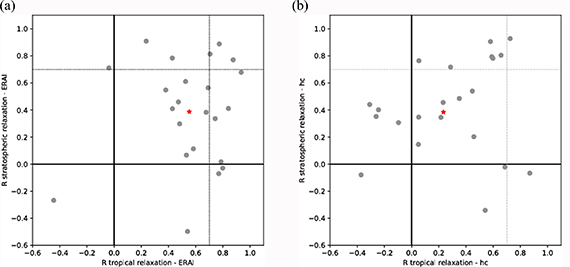
Standard image High-resolution imageThe full results for the 23 year hindcast period (1993–2015) indicate that remote forcing likely accounts for much of the winter MSLP pattern, at least in a significant fraction of winters, although the dominant source of teleconnections varies from year to year. A summary of ensemble mean pattern correlations with ERAI for the whole of the TROP and STRAT ensembles is shown in figure 5(a). For the 23 year period, we expect about 2 or 3 (10%) of the pattern correlations to exceed the significance threshold of 0.7 by chance. For STRAT, 6 years have pattern correlations in excess of this threshold; for TROP there are 10. These numbers are well above the chance level. Moreover, there is a clear tendency for the remaining pattern correlations to be positive; only one winter has near zero or negative correlations for both ensembles. While significant influences in these winters cannot be individually identified, collectively they add to the evidence of a significant influence of these drivers on observed winter MSLP anomaly patterns. In 3 years, both TROP and STRAT produce high pattern correlations. This could arise because both influences are acting in the same sense, or it could indicate degeneracy between them, with the tropics influencing the mid-latitude troposphere through an effect on the stratosphere.
Figure 5. Winter pattern correlations in the relaxation experiments. (a) Correlations with ERAI and (b) HCAST for the North Atlantic sector (22.5°–80° N, 15°–75° W). Dotted lines represent the 10% significance level (R = 0.7). Stars show the two-dimensional mean of the distribution.
Download figure:
Standard image High-resolution image
We also examined whether years with strong ENSO (either El Niño or La Niña), or with strong NAO (years lying in the outer quartiles in ERAI) performed better than the set of all 23 years. Subsetting in this way reduces the sample size still further (from 23 to approximately 12) but broadly speaking makes little difference to the overall result; both TROP and STRAT relaxation still outperformed the null hypothesis. The one notable improvement was in TROP for strong ENSO years, where 7 out of 12 (58%) lay above the threshold compared to 10 out of 23 (43%), though again because of the very small sample size, this result is not conclusive. We also considered each month individually, and all months grouped together to form a sample of 69 months. The increase in sample size is to some extent offset by two detrimental factors: an increase in noise at shorter timescales; and the fact that early winter and late winter typically respond differently to ENSO (Ayarzagüena et al 2018), with January forming a transitional month where different circulation patterns can be evident at the beginning and end of the month. We found that the ensemble of 69 separate months still exceeded the 10% threshold (15 out of 69 for STRAT and 19 out of 69 for TROP), but did not reach values as high in percentage terms as the 23 year set of DJF averages.
The results of the pattern correlation analysis show that both STRAT and TROP produce ensemble mean patterns that frequently match the pattern in reanalysis. We now wish to compare these ensemble mean patterns from the relaxation experiments with patterns in the ensemble mean of HCAST (figure 5(b)). For STRAT, 7 years show pattern correlations above 0.7 (compared to the 2–3 to be expected from random pairs of ERAI fields). This is similar to the 6 years showing high pattern correlations with ERAI. In contrast, only 2 years show significant pattern correlations between TROP and HCAST (compared to 10 with ERAI). Thus the frequency with which patterns in HCAST resemble STRAT is similar to that for ERAI, but the frequency with which they resemble TROP is much smaller than for ERAI, and is not different from the rate expected by chance. The average of the pattern correlations between the ensemble means of TROP and HCAST is 0.23, significantly less than the average value of 0.55 in the comparison with ERAI (determined using Welch's T-test which makes no assumptions about matched variances, Welch 1947, Crawley 2005). Average pattern correlations of STRAT with HCAST and ERAI anomalies are 0.40 and 0.39 respectively, which are not statistically distinguishable. These results reinforce those from earlier sections suggesting that the North Atlantic sector is influenced by the tropics via teleconnections that are independent of the stratosphere. In the prediction system, however, these influences are not predicted in the ensemble mean of HCAST.
4. Discussion
We have performed a suite of relaxation experiments in which we impose reanalysis data for the tropical troposphere and the extra-tropical stratosphere to assess their influence on the North Atlantic winter-mean tropospheric circulation. We demonstrate that both have a significant teleconnection to extratropical MSLP, and that they are complementary, with stratospheric conditions providing the primary driver at high latitudes, and tropical conditions influencing the mid-latitudes. Since mid-latitude circulation is linked to MSLP gradients, both play a role in determining the variability of winter climate in the Atlantic sector. Our results particularly highlight the connection between the tropics and the EAP in winter as imposing reanalysis conditions in the tropics results in a high correlation with the observed EAI.
The EAP's sensitivity to tropical conditions is investigated further through regression analysis using precipitation data. It is found that there are significant links to rainfall in the tropical/sub-tropical North Atlantic. Precipitation is a marker for tropical convective anomalies that can trigger Rossby waves which propagate into middle and high latitudes. The ability of these waves to alter atmospheric circulation makes them strong candidates for the mechanism of teleconnections between the tropics and mid-latitudes. The observed teleconnection also appears to be present in GloSea5, but is absent in ensemble means, suggesting that the tropical source regions may not be predictable on seasonal timescales. In this work, we cannot identify whether the Tropical North Atlantic is fundamentally unpredictable or whether improvements in its simulation could improve skill in predicting the EAP. Nevertheless, the importance of the EAP in creating anomalous winter conditions in Europe suggests that the Tropical Atlantic region should be an important focus for future development efforts to improve seasonal prediction systems.
The reproducibility of the EAP in the relaxation experiments, coupled with NAO skill already present in initialised predictions, suggests that winter MSLP patterns are successfully reproduced either by stratospheric or tropical influences in a majority of years. Individual winters showing these influences tend to be dominated by one or the other factor, with only a few having patterns that are reproduced in both relaxation experiments. We also compare the patterns in the ensemble mean of the GloSea5 hindcast with those in the relaxation experiments. Matches with the stratospheric relaxation experiment are found with similar frequency to the matches found with reanalysis. Matches with the tropical relaxation experiment are rare, however, and occur no more frequently than expected by chance. This again highlights that the hindcast ensemble mean North Atlantic atmospheric circulation contains only weak influence from the tropics either as a result of model error or limited predictability of details of the tropical sources.
Acknowledgments
This work was supported by the Joint UK BEIS/Defra Met Office Hadley Centre Climate Programme (GA01101). We thank Craig MacLachlan and Nicola Martin for their help in setting up the suites of numerical model experiments used in this study. We are grateful to the two referees for constructive and insightful feedback on earlier versions.
Data availability statement
The data that support the findings of this study are available upon reasonable request from the authors.