

Abstract
Though a number of studies have shown positive relationships between flooding events and infectious diarrhea, there is a paucity of rigorous evidence regarding the net effect of flooding on diarrhea incidence, controlling for existing pre-trends and meteorological confounders. The study treats the 2016 catastrophic flood event in Anhui Province, China as a natural experiment using a difference-in-differences design with propensity score matching to exclude background variations of diarrhea occurrence and meteorological effects, thus isolating the net effect of flooding on diarrhea. A triple-differences analysis was further deployed to identify the potential effect modifiers, including gender, age, occupation and community health resources. By analyzing 359 580 cases of diarrhea that occurred before, during and after the flooding, we show that the 2016 flood event significantly increased the risk of dysentery (RR: 1.29, 95%CI: 1.15–1.46) in during-flood period, and also increased the risk of all-cause diarrhea (RR: 1.21, 95%CI: 1.17–1.26), typhoidal diarrhea, dysentery, and other infectious diarrhea in post-flood period. Children, males and non-farmers were particularly vulnerable to flooding impacts and the density of health professionals was found to be protective against diarrheal risk in both during-flood (RR: 0.81, 95% CI: 0.72–0.92) and post-flood (RR: 0.83, 95% CI: 0.77–0.88) periods. This study employs quasi-experimental design and provides a better understanding on both acute and sustained effects of flooding on diarrhea, which is important for accurate health impact assessments and developing targeted intervention strategies.
Export citation and abstract BibTeX RIS

Original content from this work may be used under the terms of the Creative Commons Attribution 4.0 license. Any further distribution of this work must maintain attribution to the author(s) and the title of the work, journal citation and DOI.
1. Introduction
A widespread flooding along the Yangtze River basin in southern China this year reminds us again the enormous impact of climate change on human health. Anthropogenic climate change is expected to increase the frequency and intensity of heavy rainfall and flood events [1]. In China, populations exposed to severe flooding are predicted to increase [2], which will have great implications for human health. In particular, a number of studies have explored the relationship between floods and diarrhea and have found outbreaks or increases in diarrheal cases after flooding [3–5]. In the context of the global COVID-19 pandemic, higher requirements have been put forward for disaster response and disease control.
Globally, the incidence of diarrhea is between 1 and 5 billion cases per year, which are responsible for 1.4–1.9 million premature deaths and accounts for 10%–12% of all deaths in children under 5 years old [6]. Diarrhea constitutes a substantial proportion of the global burden of disease and is one of the leading preventable causes of death and disability among people in low-and middle-income countries [7, 8]. Infection with pathogens such as bacteria, viruses or parasites is a principal pathway of diarrhea, and such infectious diarrhea (also known as gastroenteritis) is mainly transmitted by food and water contaminated with pathogens, as well as person-to-person transmission [9].
Public health authorities have been lacking effective methods to comprehensively assessment of population health risks caused by flooding. Although previous studies have shown that diarrhea is associated with flood events in the US, UK as well as in many developing countries [3, 4, 10], a lack of accurate estimation of the net effect of flooding on diarrhea prevents recognition of the magnitude of the health threat, and thus limit targeted intervention and resource allocation for flooding responses. Flooding is usually caused by continuous heavy precipitation, but the spatial distribution of precipitation and the regional distribution of flooding are uneven, which means heavy precipitation may not cause flooding. Thus, the health effects of flooding should be related to but also different from the health effects of extreme precipitation, although many studies have used indicators of extreme precipitation to characterize the flood event and assess its flooding impact on diarrhea diseases [11–13].
However, several inferential challenges remain in isolating the net effect of flooding. First, in the situations that a strong pre-event trends, and unmeasured confounders such as other concurrent events that also happening in the exposed period or exposed group, a single group interrupted time series design [14] or comparative analysis on multigroup cross-sectional data [15] could be problematic for isolating the effect of interest. Second, existing quantitative evidence of multiple flooding events on diarrhea failed to take time-varying meteorological conditions into the analysis [16]. Although it has been documented that meteorological factors including temperature, humidity and precipitation could affect diarrheal incidence through their imperceptible effect on pathogens [3, 17], there is no consistent conclusion on the response curve, lag window and interaction effect of meteorological conditions on diarrhea, which may further rise the difficulty when adjust for meteorological factors in the model. Third, previous research exploring population vulnerability to flood have typically conducted subgroup analysis and often reported overlaps between confidence intervals of each group, neither of which catch the net effect of flooding on subgroups nor set up appropriate reference group to distinguish which group is more vulnerable [18, 19]. Therefore, detecting the net effect of flooding is especially critical and also the first step for developing appropriate intervention strategies.
To address inferential challenges of the flooding effect on infectious diarrhea, here we propose a novel design to treat a specific and particular event as a natural experiment, balancing the distribution of measured confounders (principally meteorological factors) between exposed and unexposed groups, and using unexposed period and unexposed group to control pre-event trends and unmeasured confounders. In the study, we employ a quasi-experimental approach on the 2016 catastrophic flood event in Anhui Province, China by using propensity score matching (PSM) to control the effects of meteorological confounders and using difference-in-differences (DID) design to exclude the effects of pre-event trends and unmeasured confounders. We also extend the DID approach to difference-in-difference-in-differences (DDD) design [20] to investigate any potential risk modification by demographic characteristics and socioeconomic factors.
2. Methods
2.1. Study location and period
Anhui Province is along the middle and lower reaches of the Yangtze River and the Huai River, located in the eastern part of China. The warm humid climate, abundant rainfall and its topography on the lower reaches of the river make Anhui one of the most flood-prone areas in China [2]. The land area of Anhui is 140 139 km2, consisting of 16 prefecture-level cities which include 105 counties, with a total resident population of 62.55 million in 2017. According to the Anhui Prlovincial Meteorological Disaster Statistical Yearbook in 2017 [21], long-lasting and heavy rainfall which started on 18 June 2016 resulted in a devastating flood, with inundation of 11 cities, 34 people died and 12.89 million people were affected in this flood disaster, which also caused 11.37 thousand km2 of crop damage, 50 578 collapses and 164 360 serious damages of houses, and the estimated 54.72 billion CNY (7.77 billion dollar) in economic loss.
In the present study, 11 inundated cities were classified as the 'flooded area', and the other five cities were classified as the 'non-flooded area'. The study period was divided into three time period: pre-flood period (18 June 2013–17 June 2016), during-flood period (18 June 2016–31 August 2016) and post-flood period (1 September 2016–31 August 2017) to capture the pattern of diarrhea cases and to control for long-term changes such as population acclimatization and urban infrastructure changes [21, 22].
2.2. Data collection
Individual data of infectious diarrhea cases included date of birth, date of onset, gender, occupation, and county administrative code from 18 June 2013–31 August 2017 were obtained from China's Notifiable Disease Surveillance System. According to the definition of infectious diarrhea, we collected cases of cholera, typhoid and paratyphoid, dysentery and other infectious diarrhea (OID). Individual case data were aggregated to daily cases of infectious diarrhea by flooded area and non-flooded area in Anhui province.
The sociodemographic data of Anhui Province were acquired from Statistical Yearbook of Anhui Province in 2017 [23]. Meteorological data from 24 stations over the study period were acquired from the National Meteorological Information Center of China [24], with 18 stations in flooded cities and six stations in non-flooded cities. The meteorological factors included daily averages of temperature and relative humidity, and daily cumulative rainfall. We calculated the daily average value of these meteorological factors for flooded and non-flooded areas.
2.3. Statistical analyses
2.3.1. Propensity-score matching
PSM are commonly used to minimize selection bias in non-experimental studies [25]. Rather than form a comparable population, PSM was used in the present study to balance flooded and non-flooded area on a set of meteorological factors by filtrating days with similar meteorological condition across flooded and non-flooded area, therefore form a comparable time series [26]. We estimated the propensity score for each observed day using a logistic regression, with measured time varying covariates included: daily mean temperature, daily cumulative precipitation, daily mean relative humidity, which may affect the exposure and transmission of diarrhea. Although day of the week and statutory holiday are as same in different areas, these two variables were also put into the model to avoid an uneven distribution on matching days.
A propensity score for each day was finally obtained and was used to match days in flooded area to similar days in non-flooded area within a 0.02 caliper. The balance of measured covariates was tested by t-test or chi-square test before and after matching to assess the quality of the PSM process. The authors matched days in pre-flood, during-flood and post-flood period between flooded area and non-flooded area, respectively. Analysis were implemented in R 3.4.4 using the 'Matrix', 'lme4', 'tableone' and 'nonrandom' packages.
2.3.2. The DID analyses
DID design, also called a comparative interrupted time series design or a nonequivalent control group pretest design [20], is a quasi-experimental design that aims at estimating a causal effect of interest by using the trends in one or more control groups to reproduce the counterfactual trajectory in the treated group in absence of the treatment of interest [22, 27]. Such a DID design, through the parallel trend and common shock assumptions represent an efficient strategy to control both time-varying and fixed measured and unmeasured confounders [28]. Similar designs have been increasingly used in environmental epidemiology and economics research in recent years [22, 29].
After two time series were acquired through PSM procedure, the authors applied two types of DID models both of which considered the pre-flood period as a control period. The first DID model compared the difference of diarrhea cases between flooded and non-flooded areas and between during-flood and pre-flood periods. As Anhui province was divided into flooded and non-flooded areas, the counterfactual quantity of interest is the difference in the number of daily cases of diarrhea between flooded and non-flooded areas that would have occurred in during-flood period if the flood had not happened.
To further adjust temporal patterns and consider overdispersion in diarrhea outcomes, a quasi-Poisson regression model with DID framework was used to analyze the data:
 is the daily cases of diarrhea at
  in
in  ;
;  is the time since the start of the study;
  is a dummy variable indicating flooded area (coding as 1) or non-flooded areas (coding as 0);
  is a dummy variable indicating flooding occurrence, namely before flood (coding as 0) or during flood (coding as 1). The temporal patterns were controlled using a natural cubic B-spline function, we changed degrees of freedom (df) from 4 to 13 per year and choose the df according to the minimum quasi-AIC (Akaike Information Criterion). The coefficient of the primary interest is
  , the interaction term between the indicator of area (flooded or non-flooded) and flood occurence (pre-flood or during-flood).
To quantify the impacts of flooding on a specific type of diarrheal disease, we applied the above DID model to detect flooding impacts on all-cause diarrhea, typhoid and paratyphoid, dysentery and OID, respectively. We did not analyze flooding impacts on cholera because only nine cases of cholera occurred in the entire study period. For the second DID model, we repeated this analysis for the post-flood period, considered the pre-flood period as a control period. Analyses were implemented in R 3.4.4 using the 'Epi', 'tsModel' and 'splines' packages.
2.3.3. The DDD analyses
The heterogeneity of flooding effects on different sub-groups were calculated by the DDD analyses [20, 22, 26]:
where,  is the daily cases of diarrhea of group
  in area
  at
at  ;
; is a dummy variable indicating different sub-groups, including reference group (coding as 0) or non-reference group (coding as 1);
  ,
,  ,
,  , and
, and  are as same in the equation of DID model and we also used minimum quasi-AIC to choose the df in natural cubic B-spline function. The coefficient of the primary interest is
  .
.
To evaluate the differential effects of flooding on different sub-groups, study population were categorized into groups according to these variables: (a) sex: male vs. female; (b) age: <5 years vs. 15–64 years; 5−14 years vs. 15–64 years; ⩾65 years vs. 15–64 years; (c) occupation: farmer vs. non-farmer. According to personal data of patients, diarrheal cases were categorized into farmer, non-farmer, and no occupation (most being preschool children or retirees); and (d) community health resources: high vs. low, which were evaluated by density of health professionals (number of health professionals per 1000 people) and density of hospital beds (number of hospital beds per 1000 people). In 2016, the average number of health professionals and hospital beds (per 1000 persons) in Anhui Province were 4.79 and 4.56, respectively [23] According to the average value of density of health professionals (as shown in figure 1) and hospital beds of their respective counties, personal cases were categorized into high- and low-density of health professionals and hospital beds groups by taking provincial average values as cut-points.
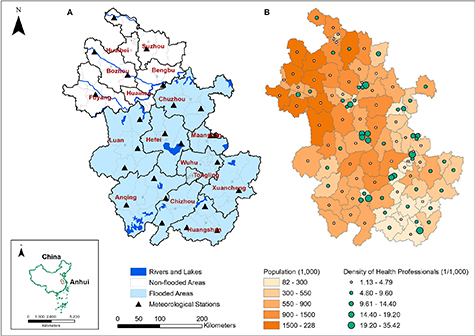
Figure 1. Flooded areas (A), population and density of health professionals (B) of Anhui Province in 2016, China.
Download figure:
Standard image High-resolution imageThe reference groups for DDD estimates were female, 15–64 years, non-farmer, low-density of health professionals, and low-density of hospital beds groups, respectively. 15–64 years old cases were taken as a reference group because in general, people aged 15–64 have better physical fitness and lower physiological vulnerability to diarrhea than other age groups.
We repeated this analysis for the during-flood period and post-flood period. Analyses were implemented in R 3.4.4 using the 'Epi', 'tsModel' and 'splines' packages.
2.4. Sensitivity analyses
Considering that meteorological factors may have delayed effects on diarrhea incidence, we conducted sensitivity analyses by involving the daily mean temperature, daily cumulative precipitation and daily mean relative humidity of the concurrent day and six previous days in PSM models as measured covariates, to balance the possible effects of meteorological factors across flooded and non-flooded areas.
To check our control for season and trend, we performed additional sensitivity analysis using 4–13 df per year in natural cubic B-spline function of time or replacing natural cubic B-spline function of time with time-stratified categorical variables (including year, month and day of the week).
The effects of the flooding on dysentery in during-flood period and on all-cause diarrhea, typhoid and paratyphoid, dysentery and OID in post-flood period were robust and the heterogeneities of the flood's effect between sub-groups were observed in all above sensitivity analyses. We did not find significant effects of flooding on all-cause diarrhea, typhoid and paratyphoid, and OID in during-flood period through the sensitivity analysis.
3. Results
During the study period, 359 580 cases of diarrhea were reported in the entire Anhui province, including nine cases of cholera, 1106 cases of typhoid and paratyphoid, 35 682 cases of dysentery and 322 783 cases of OID (supplemental material, table S2 (available online at https://stacks.iop.org/ERL/15/125015/mmedia)), which were principally reported based on clinical diagnosis. The average number of daily cases of diarrhea was 259, with a minimum of 55 cases and a maximum of 655 cases per day for the whole of Anhui province. Flooded areas and non-flooded areas, population and density of health professionals of Anhui Province were shown in figure 1. Table 1 presents descriptive statistics of daily cases of diarrhea before, during and after the 2016 flood event for flooded and non-flooded areas. Nearly all types of diarrhea cases and cases among each sub-group peaked at during-flood period and then decreased at post-flood period, except cases of under 5 years old and cases of 5–14 years old which maintained increase in during flood and post-flood periods.
Table 1. Descriptive statistics of daily diarrheal diseases in Anhui Province, China.
| Daily diarrheal rates mean (SD) | Pre-flood period | During-flood period | Post-flood period | |||||
|---|---|---|---|---|---|---|---|---|
| Non-flooded area | Flooded area | Non-flooded area | Flooded area | Non-flooded area | Flooded area | |||
| All-cause diarrhea | 2.97 (1.55) | 4.35 (1.39) | 5.06 (0.75) | 7.81 (1.42) | 3.46 (1.72) | 6.10 (2.17) | ||
| Disease category | ||||||||
| Typhoid and paratyphoid | 0.01 (0.02) | 0.01 (0.02) | 0.02 (0.03) | 0.02 (0.02) | 0.01 (0.02) | 0.01 (0.02) | ||
| Dysentery | 0.68 (0.45) | 0.26 (0.15) | 0.74 (0.2) | 0.38 (0.11) | 0.42 (0.24) | 0.22 (0.11) | ||
| OID | 2.27 (1.16) | 4.08 (1.30) | 4.29 (0.67) | 7.41 (1.40) | 3.02 (1.54) | 5.87 (2.12) | ||
| Gender | ||||||||
| Male | 3.41 (1.73) | 4.79 (1.54) | 5.37 (0.92) | 8.25 (1.58) | 3.82 (1.75) | 6.68 (2.34) | ||
| Female | 2.54 (1.46) | 3.91 (1.34) | 4.75 (0.87) | 7.37 (1.43) | 3.10 (1.78) | 5.51 (2.10) | ||
| Age | ||||||||
| 0–4 | 10.96 (7.34) | 36.65 (17.08) | 9.88 (3.19) | 47.82 (13.62) | 11.66 (5.65) | 55.62 (21.18) | ||
| 5–14 | 1.41 (0.87) | 2.21 (1.00) | 1.54 (0.62) | 3.14 (1.08) | 1.25 (0.81) | 3.61 (2.97) | ||
| 15–64 | 2.00 (1.19) | 2.34 (1.01) | 4.33 (0.86) | 5.46 (1.16) | 2.46 (1.72) | 2.99 (1.64) | ||
| >65 | 5.55 (3.50) | 4.79 (1.92) | 10.96 (2.24) | 9.22 (2.09) | 6.95 (4.59) | 6.22 (2.68) | ||
| Occupation | ||||||||
| Farmer | 6.93 (4.12) | 5.74 (2.29) | 14.45 (2.31) | 12.08 (2.37) | 8.60 (5.86) | 7.36 (3.67) | ||
| Non-farmer | 0.75 (0.47) | 1.73 (0.81) | 1.46 (0.47) | 4.08 (0.95) | 0.88 (0.60) | 2.36 (1.27) | ||
| No occupation | 2.94 (1.83) | 8.65 (3.56) | 2.95 (0.81) | 12.03 (2.93) | 3.05 (1.30) | 12.83 (4.57) | ||
| Density of health professionals | ||||||||
| High | 1.80 (0.92) | 2.54 (0.87) | 3.03 (0.69) | 4.25 (0.91) | 2.10 (0.99) | 3.36 (1.17) | ||
| Low | 0.90 (0.52) | 1.53 (0.52) | 1.55 (0.23) | 3.23 (0.62) | 1.05 (0.59) | 2.45 (1.03) | ||
| Density of hospital Beds | ||||||||
| High | 1.60 (0.91) | 3.11 (1.21) | 2.50 (0.67) | 5.59 (1.21) | 1.82 (0.86) | 4.44 (1.67) | ||
| Low | 1.06 (0.59) | 1.62 (0.49) | 1.85 (0.27) | 2.91 (0.51) | 1.24 (0.67) | 2.23 (0.85 | ||
Daily diarrheal rate: daily case of diarrhea per 10 00 000 people.Pre-flood period: from 18 June 2013 to 17 June 2016.During-flood period, from 18 June 2016 to 31 August 2016.Post-flood period, from 1 September 2016 to 31 August 2017.No occupation: most being preschool children or retirees.OID: infectious diarrhea other than cholera, typhoid, paratyphoid and dysentery.
After matching the propensity scores in flooded and non-flooded areas, 984 d before flood, 53 d during flood, and 331 d after flood were considered. Overall 203 d were excluded because the meteorological disparities existed between flooded and non-flooded areas in these days. Covariate balance for daily mean temperature, daily cumulative precipitation, daily mean relative humidity, day of the week and public holiday across flooded and non-flooded area during pre-flood, during-flood and post-flood periods was mostly achieved (p > 0.05) (supplemental table S2 and figure S1). After PSM, similarity in secular trends before flooding was also achieved through matching and visual inspections (supplemental figure S2), which meet the parallel trend assumption of DID model.
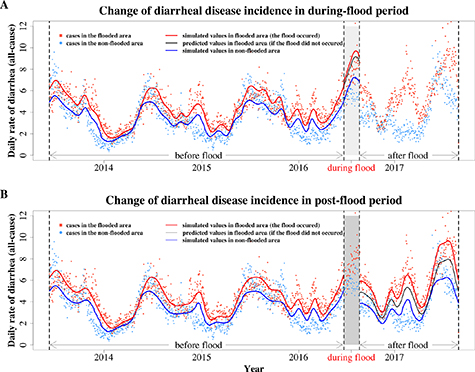
The DID model showed that daily cases of all-cause diarrhea did not increase in during-flood period but increased by 21% (RR:1.21, 95%CI: 1.17–1.26) in post-flood period (figure 2). Specifying by diarrhea type, in during-flood period, only dysentery risks increased; in post-flood period, the flooding had increased all risks of typhoid and paratyphoid, dysentery and OID (table 2).
Figure 2. Changes of daily rate of diarrheal disease in during-flood period (A) and in post-flood period (B). Daily diarrheal disease incidence means daily case of diarrhea per million people. The spots show the observed values and the lines show simulated values. The black lines show predicted incidence of diarrhea by setting the interaction terms in DID models to zero.
Download figure:
Standard image High-resolution image
Table 2. Net effects of flooding on diarrheal disease incidence in Anhui Province, China.
| Flooding impact in during-flood period | Flooding impact in post-flood period | |
|---|---|---|
| Relative risk (95% CI) | Relative risk (95% CI) | |
| DID model | ||
| All-cause diarrhea | 1.06 (0.98, 1.14) | 1.21 (1.17, 1.26) a |
| Typhoid and paratyphoid | 1.21 (0.71, 2.08) | 1.50 (1.13, 1.99) a |
| Dysentery | 1.29 (1.15, 1.46) a | 1.36 (1.27, 1.46) a |
| OID | 0.97 (0.90, 1.04) | 1.09 (1.05, 1.13) a |
| DDD model | ||
| Age | ||
| 0–4 years old vs. 15–64 years old (ref) | 1.34 (1.09, 1.65) a | 1.37 (1.24, 1.52) a |
| 5–14 years old vs. 15–64 years old (ref) | 1.19 (0.95,1.50) | 1.80 (1.58, 2.04) a |
| >65 years old vs. 15–64 years old (ref) | 0.90 (0.80, 1.02) | 1.00 (0.93, 1.07) |
| Gender | ||
| Male vs. female (ref) | 1.08 (0.97, 1.21) | 1.08 (1.01, 1.14) a |
| Occupation | ||
| Farmer vs. non-farmer (ref) | 0.84 (0.73, 0.96) a | 0.89 (0.82, 0.97) a |
| Health resources of community | ||
| Density of health professionals: high vs. low (ref) | 0.81 (0.72, 0.92) a | 0.83 (0.77, 0.88) a |
| Density of hospital beds: high vs. low (ref) | 1.12 (0.98, 1. 29) | 1.07 (0.99, 1.15) |
a P< 0.05;ref: reference group;OID: infectious diarrhea other than cholera, typhoid, paratyphoid and dysentery.
Table 2 also shows that in during-flood period, under-5 children were at a higher risk. In post-flood period, children under-5 and aged 5–14 also had a higher risk of diarrhea than 15–64 years old group. Males had higher risks than females in post-flood period. Interestingly, farmers were at lower risks than non-farmers both in during-flood and post-flood periods. We also found that people who belonged to counties with high density of health professionals had a lower risk of diarrhea, both in during-flood period (RR: 0.81, 95% CI: 0.72–0.92) and in post-flood period (RR: 0.83, 95% CI: 0.77–0.88). However, we did not detect any protective effect with respect to the density of hospital beds.
4. Discussion
This study provides rigorous evidence for both acute and sustained effects of flooding on infectious diarrheal disease. It should be emphasized that translating the rapid advances in understanding of extreme weather prediction is needed for reducing disease morbidity and mortality in a changing climate, and the accurate estimation of health impacts of extreme weather events such as flooding is particularly necessary in this regard [30]. While quasi-experimental approaches for example DID model are routinely used to evaluate the effects of healthcare policy [22, 27], such approaches can also be used in identifying the net effect on health issues associated with other extreme weather events, such as droughts, wildfires and hurricanes. This kind of study can also help with data needs and optimal web of sensors for monitoring the natural-human system interactions in the context climate and health by assimilating these data into earth system predictions for human health.
An abrupt increase of diarrheal cases in the non-flooded areas in during-flood period implies that there might be other potential reasons behind this phenomenon [31, 32]. If diarrhea in the non-flooded area is also affected because flooding increases the activity and the spread of diarrheal pathogens, the net effect of flood events may be underestimated. But in this study, our main aim is to detect the net effect of exposure to flooding inundation rather than a flood event, thus the effects would not be underestimated. However, future study should be strengtherned on the mechanism of flood on diarrheal, so as to estimate the net effect of flooding enundation and flood event more precisely.
As a hydrological disaster, flooding mainly affects health by overwhelming water systems and causing backflows that lead to contamination of groundwater and other drinking water sources, damaging sanitation infrastructure, deteriorating living environment and interrupting health service provision, which can be prevented by oriented flood response and early warning system [33]. The high confidence that flooding results in infectious diarrhea has moved our focus to another important issue: what public health initiatives can be developed and implemented to better prepare and respond to flooding? However, there is limited research to provide guidance for setting up appropriate coping strategies. Emergency response strategy should identify and target individuals living in flood prone areas [34], while long-term adaptation strategies should focus on enhancing community resilience to the health impacts of flooding through investment in more robust public health infrastructures and climate-resilient health systems.
In the exploration of factors affecting individual vulnerability, our study found that age gender and occupation are modifiers of the relationship between flood and diarrhea, which echoes the recent findings from the USA [11], but differs from some previous studies in China [35]. However, all these previous studies reported overlaps between confidence intervals of each group, which cannot provide decision-makers with the required level of confidence in the information. The underlying mechanisms for the effect modification remain unclear. The gender difference in risk may be due to the male's hygiene habits and rescue efforts, which are more likely to lead to the exposure of diarrheal pathogens during the flood events, while the age difference may be due to the immature intestinal immune function of young children [15]. The risk difference between farmers and non-farmers might because that farmers have more experience dealing with floods. It may also suggest that mountain flash floods and urban inland inundation have differentiated effects on diarrhea, which requires more exploration in future research.
Another significant social modifier detected in our study was the health resources of community. High density of health professionals showed substantial effect on reducing the risk of infectious diarrhea posed by flooding. The Intergovernmental Panel on Climate Change recommends that improved health services, better disaster management and poverty alleviation can reduce the negative effects of climate change on health [36]. Coping with health threats of climate change, improving public health and health care services were categorized as incremental adaptation [37], which means a more complete diarrhea surveillance system, a better disaster risk communication and management, effective community-based health promotions and local public health actions in the flooding context, and also a closer coordination between health and other sectors to respond to flooding [38]. Thus, health professionals can reduce vulnerability, narrow adaptation deficit and enhance the capacity of a community to address flooding impact while sustaining the social and environmental determinants of health [39, 40].
There are some limitations to our study. First, reported data of diarrhea might be lower than the actual morbidity because cases with mild symptoms may not come to the hospitals. In the future, establishing community-based disease active monitoring network may be recommended to better coping with flooding and public health risks. Second, we divided the cases into specific county according to the hospital where the cases from, which could lead to misclassifications as some patients may not visit the hospital in their counties. However, the probability of differential misclassification is expected to be small given that diarrhea is acute but not fatal and people will usually approach the nearest hospital. Third, because accessing fine scale data is unattainable, we have assessed the flooding effects without considering the spatial variability of the flood's magnitude (e.g. duration, depth and area) throughout the flooded area. Further studies should take into consideration flood magnitude across different regions when detecting modifier factors or exploring underlying mechanisms.
In conclusion, this study provides evidence that flooding considerably increases the risk of infectious diarrhea with a noted effect modification by age and gender, and also highlights the important role of health professionals in the face of nature disasters. The quasi-experimental design can successfully quantify both acute and sustained net effects of flooding on human health, which identifies the need for targeted interventions and evidence-based decisions during and after the flood events.
Acknowledgment
This work was supported by the National Key R&D Program of China (2018YFA0606200); National Natural Science Foundation of China (72074234); Fundamental Scientific Research Funds for Central Universities, P.R. China (SYSU-20ykpy85), China Medical Board Open Competition (CMB-OC 19-337).
Data availability statements
All data that support the findings of this study are included within the article (and any supplementary information files).
Conflict of interest
We declare no competing interests.
Author Contribution
CH and WL designed the study and drafted the paper; CH, and WL prepared and analyzed the data. JW, LY, TB, XL, RM, AS, WM and SZ assisted with interpretation of the data, edited on drafts of the manuscript.