

Abstract
More than half of the world's population lives in urban areas (UN Population Division 2018 The World's cities in 2018 (UN: New York)), which are especially vulnerable to climate extremes (Field et al 2012 Managing the Risks of Extreme Events and Disasters to Advance Climate Change Adaptation: Special Report of the Intergovernmental Panel on Climate Change (Cambridge: Cambridge University Press)). Urbanization itself is known to increase surface temperatures, but its quantitative effect on extreme precipitation remains very uncertain. Using decadal convection-permitting climate simulations in four midlatitude megacities (Paris, France; New York City, USA; Tokyo, Japan; Shanghai, China), we show that urbanization can strongly increase the frequency and intensity of extreme urban precipitation. Frequency increases far more than intensity, by +16% (11%–22%) (95% confidence interval) for 1 year daily extremes, and +26% (11%–41%) for 1 year hourly extremes, downwind of city centers. Intensities of the same events increase by +5% (3.2%–6.4%) (daily extremes) and +6% (3.2%–9.8%) (hourly extremes), respectively. The intensity and frequency of extremes increases more for the rarest, most extreme events considered, and there is some indication that hourly extremes increase more than daily extremes. Our simulations also show that direct urban anthropogenic emissions of heat could be an important factor driving these changes. Urbanization is expected to continue in the future, and our results indicate that these effects should be considered in urban planning decisions to make cities more resilient to extreme precipitation.
Export citation and abstract BibTeX RIS

Original content from this work may be used under the terms of the Creative Commons Attribution 4.0 license. Any further distribution of this work must maintain attribution to the author(s) and the title of the work, journal citation and DOI.
1. Introduction
Urban areas have a different climate than surrounding areas, and often experience higher surface air temperatures. This well-known urban heat island (UHI) effect [1] is especially strong at night and during summer, exacerbating the health impacts of deadly summer heat waves [2]. UHI is primarily due to increased solar absorption and reduced turbulent and radiative cooling in street canyons, associated with the low surface albedo and high heat storage capacity of artificial urban surfaces [3]. Urban temperatures are also increased by direct anthropogenic heat emissions (AHE) by domestic heating, air conditioning and combustion engines [4]. UHI intensity is closely linked to urban population numbers [5], but the background climate is also important for the efficiency of UHI, particularly during summer [6]. Cities in dry climates have a smaller UHI effect than in other climates, and in the former the UHI effect can even lead to cooling. In wetter climates, dissimilarities in evapotranspiration and convective efficiency are the main factors explaining the urban-rural temperature differences [5].
Observations and modeling indicate that urbanization can also enhance precipitation in cities, especially downwind of major urban centers [7–9]. This urban-induced rainfall has been linked to the surface heating associated with UHI, destabilizing the atmosphere and triggering convective rain, and to the surface roughness from tall buildings, slowing down surface winds and enhancing low-level moisture convergence [10].
Urban areas are especially sensitive to extreme precipitation events, which can overwhelm sewer systems and cause costly, life-threatening urban floods [11]. It is then societally crucial to understand the drivers of extreme urban precipitation, in order to build more resilient cities and mitigate the risks from future urban floods.
In the past decades, many studies have shown enhanced thunderstorm activity in the vicinity of large cities, using surface and satellite-based observations of rainfall and lightning [10, 12]. However, it is still difficult for long-term observational studies to separate urban effects from other drivers of extreme precipitation change in cities, such as climate change and aerosol changes (concentration, composition and size). In addition, the very high natural variability associated with extreme precipitation events makes it very difficult to identify any urban effects. In fact, the vast majority of recent past climatological studies did not provide a confidence interval when quantifying urban induced rainfall [13]. As a result, although there is more and more observational evidence that urbanization enhances extreme rainfall, the quantitative contribution of urbanization to these changes is still very uncertain. On the other hand, modeling studies, which are able to separate the different drivers of urban rainfall, have in the past mostly investigated the effect of urbanization on single extreme precipitation events [9, 14–16]. Long-term climatological model studies have usually focused on the summer period [13], even though extreme events can occur in all seasons and especially in the fall [17]. To our knowledge, all previous modeling studies have also focused on single cities or on urban areas in one specific region. Some of these studies have also used short simulation periods of less than 10 years [13, 18, 19], which might be insufficient to properly quantify extreme precipitation statistics. Furthermore, simulating urban-induced extreme precipitation requires long-term high-resolution simulations to properly resolve urban areas and convective systems, which only became computationally feasible recently [20].
In order to improve our quantitative understanding of the effect of urbanization on extreme urban precipitation statistics, we quantify in this study for the first time the effect of urbanization (defined as the presence of urban surfaces and AHE) on daily and hourly extreme urban precipitation statistics in four large megacities (Paris, France; New York City, USA; Tokyo, Japan; and Shanghai, China) using decade-long, all-year-long, convective-permitting simulations.
2. Methods
2.1. WRF model and setup
For each city, we perform two sets of 10 year (2008–2017) experiments (20 year for Paris, 1998–2017), using the Weather Research and Forecasting model version 3.9.1 [21], run at a convective-permitting 3 km resolution. Simulations are performed as 13 month time slices starting on December 1 and ending on January 1. Initial and boundary conditions are from the ERA-Interim reanalysis. The model is run with three nested domains, at horizontal resolutions of 45 km, 15 km, and 3 km, with 50 vertical levels from the surface to the 50 hPa level. The 3 km resolution domains are 483 km × 483 km wide. In the 45 km domain, horizontal wind, temperature and geopotential height are spectrally nudged to the ERA-Interim reanalysis. The detailed model setup is given in the supplementary table S1 (available online at stacks.iop.org/ERL/15/124072/mmedia), and the simulation domains are shown in figures S1 and S2. No convective parameterization is used in the 3 km domain. In the other domains, the Grell–Freitas cumulus scheme [22] is used. Urban physics are calculated by the Single-Layer Urban Canopy model [23] embedded in the Noah Land Surface Model [24] coupled with WRF.
2.2. Description of the Urban and NoUrban simulations
For the first set of simulations, called 'Urban', we simulate the regional weather using an AHE inventory (described below) and land cover information obtained from the MODIS satellite instruments [25, 26]. In the second, counterfactual set of experiments, called NoUrban, the main contiguous urban area for each city is replaced in the model by the main periurban land type, usually cropland, and there, AHE is cut completely. The difference between the Urban and NoUrban simulations then gives the effect of urbanization on the local urban climate.
The urban model represents urban areas as three urban categories of different densities. In order to set urban densities in our simulations, we calculated the human settlement index [27] (HSI) using satellite remote sensing observations, as:
Where NDVI is the maximum normalized difference vegetation index in the year, obtained from the 1 km resolution SPOT-4 VGT S10 satellite product [28] for 2013, and OLS is the normalized light intensity, from the DMSP-OLS satellite Nighttime Lights product version 4 [29] for 2013. Once the HSI is calculated for each WRF surface grid cell, the 30% urban grid cells with the highest HSI are set as high-density urban areas, the next 50% as mid-density, and the bottom 20% as low density [30]. In the NoUrban simulations, the 45 km and 15 km domains use the same land use map as in the Urban runs, but in the 3 km domain the main contiguous urban area for each city is replaced grid cell by grid cell by the most common surrounding land type. This approach has the advantage of minimizing the urban-periurban contrast in the NoUrban run, while focusing on the effect of the presence of urban land and AHE, instead of investigating the effect of broader regional land use change (e.g. widespread deforestation) that would arise when using pre-settlement maps for NoUrban. The resulting Urban and NoUrban land use maps are shown on supplementary figure S1. This approach neglects some of the structural differences across cities, by using the same percentage for each urban category, and by using the same urban parameters for each city. However, using these simplifying hypotheses, and comparing relatively similar midlatitude megacities, allows us to better identify the common features of the extreme precipitation response to urbanization in midlatitude megacities (sections 3.2–3.5) and to aggregate results between cities to quantify the influence of urbanization on extreme precipitation statistics in midlatitude megacities (sections 3.3 and 3.4). In the Urban simulation, AHEs are from a top-down 30 arc seconds, 1 h-resolved global inventory [31] (shown in supplementary figure S2). Large uncertainties remain in any AHE estimate, which ultimately require detailed knowledge of energy use and characteristics at the building scale in each city. Even though the AHE inventory used here is based on a global, top down approach, we note that it has shown good agreement with more detailed city-scale AHE models [31]. In the NoUrban simulation, AHEs are set to 0 W m−2 where the Urban area is replaced.
2.3. Extreme precipitation indices
The model output includes daily and hourly total precipitation. Precipitation indices presented in this study are calculated in each grid cell, then averaged over the whole 20 year or 10 year time period before calculating the Urban–NoUrban change. In sections 3.2–3.4, indices are also averaged over the whole urban area for each city before calculating the Urban–NoUrban change (see details in these sections). In sections 3.3 and 3.4, indices are also averaged only over the part of each city's urban area where mean precipitation increases (see details in these sections).
In this study, we calculate extreme precipitation indices for different event return periods. For example, the 1 year event in a given grid cell correspond to the top tenth strongest precipitation event in this grid cell in a 10 year dataset (or top 20 in 20 years). For daily precipitation, this also corresponds to the 99.726 all-days percentile, and for hourly precipitation, to the 99.989 percentile. We call the difference between 1 year precipitation amounts in millimeters in the NoUrban run and 1 year precipitation amounts in the Urban run the 'intensity change' of 1 year events due to urbanization. For each of these precipitation indices, we also calculate a 'frequency change' due to urbanization. For 1 year events, we calculate this frequency change as follows: the 1 year event intensity in millimeters is first calculated in each urban grid cell in the NoUrban run, then the number of events exceeding that threshold in NoUrban is calculated (by definition ten events per decade). Next, we calculate the number of events exceeding the same NoUrban threshold in the same grid cell in the Urban case. This event count is averaged over the urban area, and compared to the NoUrban number to calculate the average Urban–NoUrban frequency difference. When aggregating extreme precipitation statistics for the four cities (sections 2.3 and 2.4), we also give the 95% confidence interval (2.5% to 97.5%) in our aggregated metrics, calculated using a one-sample Student t-test.
3. Results and discussion
3.1. UHI and urban-induced precipitation in Paris, France
Figure 1 shows the 20 year mean simulated effect of urbanization in Paris on 2 m temperature, mean precipitation and extreme daily precipitation with a 1 year return period. The base simulated results in the Urban runs are also compared to surface observations from the Global Summary Of the Day version 7 dataset [32]. The model root mean square error (RMSE) for temperature is 1.8 K, and for mean and extreme precipitation normalized RMSEs are 27% and 9% respectively. We find that the simulated UHI effect in Paris is 2.1 K for the annual mean, 1.7 K in winter, and 2.4 K in summer, similar to the value of 2.6 K in June observed in a previous study [33]. Furthermore, urbanization has a clear effect on wintertime (December–January–February, DJF) mean precipitation and wintertime extreme daily precipitation, and increases precipitation northeast of the urban area, downwind from the prevailing southwesterly wind direction. Further downwind, far outside the urban area, precipitation decreases.
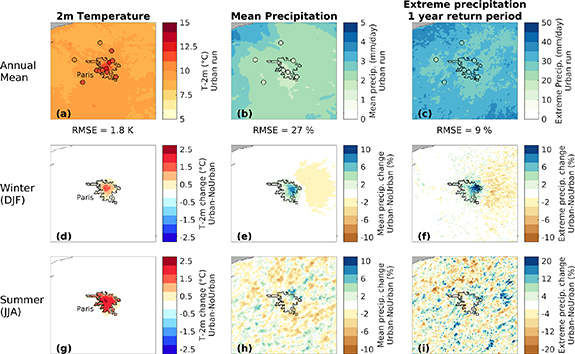
Figure 1. Effect of urbanization in Paris, France on seasonal mean temperature, seasonal mean precipitation, and seasonal extreme daily precipitation with a 1 year return period. 20 year average of (a) 2 m temperature (b) mean precipitation (c) extreme daily precipitation, simulated by the WRF model (background fields) and observed in situ (dots). Middle and bottom rows show the 20 year average effect of urbanization on (d)–(f) wintertime (DJF) and (g)–(i) summertime (JJA) (d), (g) 2 m temperature, (e), (h) mean precipitation and (f), (i) extreme daily precipitation (Urban–NoUrban simulation difference).
Download figure:
Standard image High-resolution imageResults presented in figure 1 show why it is far easier to directly observe urban-induced mean rainfall than urban-induced extreme rainfall. The urban variability in simulated extreme precipitation, quantified by the normalized standard deviation of all the grid cells in the urban area of Paris, is 4.9%. This value overshadows our signal, the +2% average urban extreme precipitation change in Paris. This pronounced spatial variability is a well-known feature of extreme precipitation, and is largely due to the stochastic nature of convective rain. For this reason, it is possible to confuse these random effects with the actual urban signal when comparing observed trends inside and outside urban areas. In figure 1, we also note that the spatial variability in both the mean and extreme precipitation responses is especially high during summer (June–July–August, JJA), where highly variable convective precipitation is prevalent. However, even in this season, we find that the strongest changes in precipitation occur in northeastern Paris, as did a past case study [9], even though these values are comparable to the wider pattern of extreme precipitation variability, making this result very uncertain. In Spring and Fall, mean and extreme precipitation also increases in northeastern Paris (supplementary figure S3), with less spatial noise than in summer but more than in winter. Because of this large spatial variability, it is difficult to study this urban response at the local scale of a model grid cell. In the rest of the paper, we study these effects using coarser geographical averages over urban areas, in order to reduce this random noise and to better extract the climate signal of urbanization.
3.2. Urbanization increases extreme precipitation frequency far more than its intensity
To understand the pattern of small-scale variability and its robustness, figures 2(a)–(h) shows simulated precipitation indices averaged over the whole urban areas of Paris, New York City (NYC), Tokyo, and Shanghai, for the whole 10 year period (2008–2017). For Paris, figure 2 also shows error bars representing the standard deviation from an ensemble of 100 random 10 year periods subsampled without replacement from the full 20 year dataset for Paris. These error bars thus represent the uncertainty associated with the choice of our relatively short 10 year simulation period for calculating precipitation statistics in these four cities.
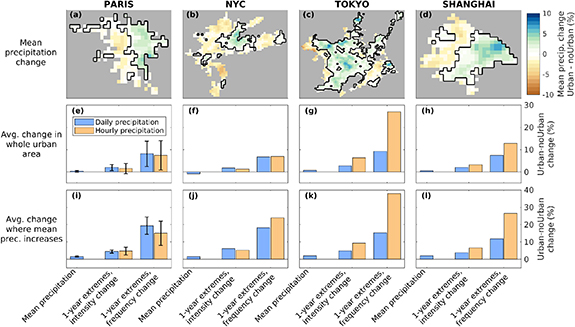
Figure 2. Change in (blue) daily and (orange) hourly precipitation due to urbanization in Paris (France), New York City (USA), Tokyo (Japan), and Shanghai (China). Top row: modeled mean precipitation changes (10 year average) due to urbanization. Middle row: mean and extreme precipitation changes (daily and hourly), averaged over each city's urban area. 'Intensity change' refers to the change in precipitation amounts between 1 year events in the NoUrban and Urban simulations, while 'frequency change' refers to the change (Urban–NoUrban) in number of events exceeding the 1 year extreme threshold. Bottom row: same as middle row, averaged only over part of the urban areas where mean precipitation is increasing, highlighted in black in the top row. For Paris, error bars show the standard deviation from random 10 year periods subsampled in the full 20 year dataset.
Download figure:
Standard image High-resolution imageFigures 2(e)–(h) shows that, on average, urbanization increases mean precipitation slightly in the urban areas of Paris, Tokyo and Shanghai (+0.4% to +0.8%), but decreases it in NYC (−0.8%). (see supplementary table S2 for the changes in the four cities). Extreme precipitation with a 1 year return period (top ten event in 10 years) increases in every city by +2% to +3% for daily extremes, and +1% to +6% for hourly extremes. However, the large standard deviation for Paris indicate that these results are very sensitive to the choice of a relatively short 10 year period, and thus quite uncertain. We find that differences between cities can be partly explained by the magnitude of the UHI temperature change. The 1 year extreme precipitation intensity change, averaged over the whole urban area, is well correlated with the annual and spatial mean UHI effect in the four cities, with correlations of 0.84 and 0.78 for daily and hourly extreme precipitation respectively. Remaining differences between cities reflect that additional factors, such as local climate and orography, play a role in the strength of the precipitation response [7].
Figures 2(e)–(h) also shows that urbanization increases the frequency of extreme urban events far more than either the mean precipitation intensity or the extreme precipitation intensity. The frequency of 1 year daily events increases by +7% to +9% above the NoUrban baseline, and hourly precipitation extremes increase in frequency even more, by +7% to +27% (see supplementary table S2 for changes in the four cities). Our results also indicate that changes in extreme precipitation frequency can occur during the whole year, whereas most previous studies have focused on summer only. On average, only half (52%) of the ten strongest simulated events in each grid cell of these four cities occur in summer (J), while 32% take place in fall, 14% in spring and 2% in winter. Even though the magnitude of the UHI temperature effect is largest in summer in the four cities, we find that in Paris the relative increase in daily extreme precipitation frequency is largest in fall, and in NYC and Shanghai it is largest in spring.
3.3. Urban-induced extreme rainfall is unevenly distributed within cities
The effect of urbanization on mean urban precipitation is known to be highly localized, with precipitation usually increasing downwind from a prevailing wind direction, and decreasing even further downwind [10]. Figures 2(a)–(d) indeed shows, as did figure 1, that there is a lot of spatial variability in the mean precipitation response to urbanization. Even in NYC, where, on average, urbanization decreases mean precipitation, vast areas northeast of the urban area experience increased mean precipitation. For this reason, past observational studies have usually quantified urban-induced rainfall only in specific areas most affected [7, 8]. Following a similar approach, figures 2(i)–(l) shows the changes in extreme precipitation only where mean precipitation increases (areas highlighted on figures 2(a)–(d)). There, we see much more similarities between cities, a lower overall uncertainty in our attribution, and a more consistent picture in the response to urbanization. These areas see enhanced annual mean precipitation, but also stronger changes in extremes than in the mean, and a consistently stronger response in frequency than in intensity. Aggregating these results for the four cities (figure 3), we find that the frequency of 1 year extreme precipitation increases by +16% (11%–22%) (95% confidence interval) for daily extremes and 26% (11%–41%) for 1 year hourly extremes. The intensity of the same events increases by 5% (3.2%–6.4%) for daily extremes, and 6% (3.2%–9.8%) for hourly extremes (see supplementary table S3 for changes in the four cities).
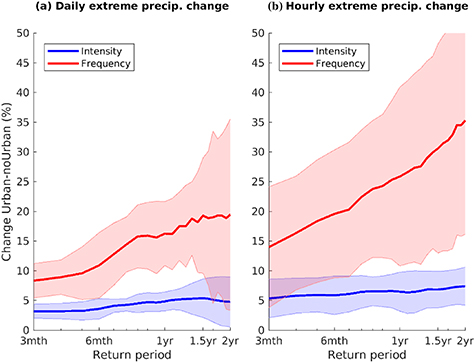
Figure 3. Simulated change in extreme precipitation intensity and frequency due to urbanization (Urban–NoUrban), as a function of the event return periods, averaged over four megacities. Changes are averaged only over the part of urban areas where mean precipitation increases, for (a) daily precipitation and (b) hourly precipitation. Color shading indicates the 95% confidence interval for the mean of the four cities.
Download figure:
Standard image High-resolution imageIn summary, where urbanization increases mean precipitation, we see an associated extreme precipitation response to urbanization that is robust and consistent between all four cities: enhanced extreme intensity compared to the mean, and further enhancement of extreme precipitation frequency. In the rest of the urban area (supplementary figure S4, panels i–l) the response is qualitatively very different. First, in the areas where mean precipitation decreases, the uncertainty is much larger than the extreme precipitation change signal. Second, in these areas there is no consistent response between different cities: frequency changes can either be smaller or larger than intensity changes, and extreme changes can be smaller or larger than mean changes. It is clear that the response shown on figure S4 is much weaker, and much more random and uncertain, than what is shown on figure 2. This is because these changes are not primarily due to urbanization, but are mostly associated with the random regional variability of precipitation. These results are consistent with previous studies that showed that only some areas within cities experience urban-induced rainfall. These findings also indicate that the urban-induced extreme precipitation response is highly heterogeneous within cities, which could be important for future adaptation and to understand extreme precipitation in existing cities
3.4. Urbanization enhances the intensity and frequency of rarer extreme events the most
Figure 3 shows that urbanization also has a stronger effect on the most extreme precipitation events. For example, the frequency and intensity of 1 year events increases faster than either 3 month or 6 month events. Our results also indicate that 2 year events might increase even more, but it is difficult to investigate return periods larger than 1 year with our limited 10 year dataset, as indicated by the large uncertainties on figure 3. Aggregating results for the whole urban areas of the four cities (instead of the areas most affected) shows similar effects, but with weaker responses and even larger uncertainties (supplementary figure S5). Figures 3 and S5 also indicate that, in these four cities, hourly precipitation extremes increase more than daily extremes, in agreement with a recent study over Kuala Lumpur, Malaysia [18]. However, for the intensity response, the statistical significance of this hourly intensification is quite weak, with t-test p-values (hourly minus daily change difference) of 0.078, 0.27 and 0.30, for the 6 months, 1 year and 2 year extremes respectively. For frequency, the hourly intensification of extremes is slightly more significant, but still does not reach the 95% statistical significance, with p-values of 0.062, 0.20 and 0.21 for 6 months, 1 year and 2 year extremes respectively. To reduce this uncertainty, longer simulation datasets would likely be needed to confirm that hourly extremes are indeed intensifying more than daily extremes. Simulations for additional cities, larger cities, or using more pronounced urban characteristics (density, building height, AHE) could also help better identify the nature of the urban precipitation response.
3.5. Sensible heat, including anthropogenic heat emissions, drives the increase in extreme precipitation
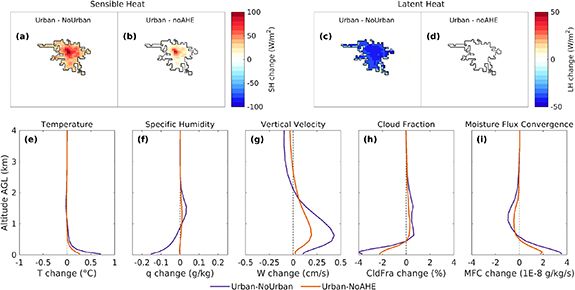
Figure 4 illustrates the physical processes responsible for these urban precipitation changes. Urbanization increases the surface sensible heat flux in cities, while decreasing the latent heat flux, causing a slight drying at the surface but also destabilizing the lower atmosphere. The resulting effect is an overall increase of upwards vertical wind velocity over Paris, which can trigger convection downwind of the urban area, a well-known driver of urban-induced rainfall [33, 34]. This can be seen on figure 4(h)–(i), showing an overall increase in horizontal moisture flux convergence  and high-altitude cloudiness over urban areas. Similar mechanisms were also shown to occur in Tokyo in a recent study [35]. In order to separate the effects of land use change and the effects of anthropogenic heat, we also show in figure 4 the results of a 2 year simulation (years 2008 and 2009) where we disabled AHEs over Paris, referred to as noAHE. We only performed the noAHE simulation for 2 years because of the high computational cost of performing 10 additional years of simulations, however supplementary figures S6 and S7 show that results in 2008 and 2009 are very similar, indicating that even a 1 year simulation would be sufficient to investigate these changes. Results presented in figure 4 indicate a proportionally large role of AHE, which increases sensible heat and decreases stability, without reducing evaporation and latent heat. As a result, half (51%) of the total moisture flux convergence change below 2 km over Paris is due to AHE, even though AHE contributes to only 32% and 31% of the total sensible heat and surface temperature changes due to urbanization. This suggests that reducing AHE in cities (for example, reducing total energy use or improving insulation) could have the important co-benefit of reducing the frequency of extreme precipitation events within cities.
Figure 4. Simulated effect of urbanization and anthropogenic heat in Paris on annual mean (2008–2009 average) surface energy fluxes, and on annual mean vertical profiles over the urban area. Top row: modeled Sensible Heat and Latent Heat changes due to urbanization (Urban–NoUrban) and due to anthropogenic heat emissions (Urban-NoAHE) in Paris for the simulated years 2008–2009. Bottom: vertical changes in temperature, specific humidity, vertical wind velocity, cloud fraction and horizontal moisture flux convergence due to urbanization (purple) and AHE (orange).
Download figure:
Standard image High-resolution image
4. Conclusion
In conclusion, our study shows that urbanization intensifies extreme precipitation events in large cities, and increases the frequency of extremes even more, making these events far more commonplace. This is potentially worrying because of the continued expansion of urban areas, which are expected to house 60% of the world's population by 2030 [7, 36, 37], and because of the simultaneous increases in extreme precipitation intensity and frequency due to climate change [38, 39]. Cities are very vulnerable to extreme precipitation, due to high runoff on artificial surfaces and high population densities. We show here that not all parts of cities are susceptible to urban-induced rainfall, which can be highly localized, meaning that detailed high-resolution studies could be necessary before designing infrastructure in fast-growing cities. In this work, we only investigated the effect of urbanization in midlatitude megacities; we hope future work will investigate if the same effects occur in smaller cities and in different climates, including drier climates. We also chose to study the effect on urban climate of urban land and AHE in current conditions; we think it will be interesting for future work to consider the combined effect of urbanization and historical climate change since pre-settlement conditions, as well as the combined effect of future urbanization scenarios and future climate change.
As in earlier studies, we find that increased sensible heat could be an important driver of urban-induced rainfall, by increasing vertical motion and moisture convergence over cities [14, 35]. In addition, we show a potentially large role of direct AHEs from domestic heating, combustion engines and air conditioners, which increase sensible heat without reducing surface specific humidity over cities. In order to limit urban-induced extreme rainfall, AHEs could be easier to mitigate than the UHI components from albedo, heat storage and street geometries. Further studies will be needed to assess the efficiency of different mitigation strategies.
Acknowledgments
The work has received support from the project SUPER (Grant No. 250573) funded through the Research Council of Norway. The project SUPER has also received support from the insurance company If. We thank the research group of Y Dong, A C G Varquez, and M Kanda for their help with using their heat emission inventory. DMSP-OLS image and data processing by NOAA's National Geophysical Data Center. DMSP data collected by US Air Force Weather Agency.
Data and code availability statement
The data that support the findings of this study are available upon reasonable request from the authors. The anthropogenic heat emission inventory is available online (www-old.ide.titech.acjp/~kandalab/ja/news/2016/AHE_release_20161212_files/AHE_release_20161212.htm). SPOT-VGT NDVI was obtained from the VITO database (www.vito-eodata.be/PDF/portal/Application.html). DMSP-OLS night light data was obtained from NOAA (https://ngdc.noaa.gov/eog//dmsp/downloadV4composites.html). The WRF 3.9.1 model is available at www2.mmm.ucar.edu/wrf/users/download/get_source.html
Author contributions
L M, G M and Ø.H designed the study. L M performed the simulations. L M and B M S analyzed the data. All authors contributed to the writing process and to the interpretation of the data.
Conflict of interest
Authors declare that they have no competing interests regarding this research.