

Abstract
Permafrost soils store huge amounts of organic carbon, which could be released if climate change promotes thaw. Currently, modelling studies predict that thaw in boreal regions is mainly sensitive to warming, rather than changes in precipitation or vegetation cover. We evaluate this conclusion for North American boreal forests using a detailed process-based model parameterised and validated on field measurements. We show that soil thermal regimes for dominant forest types are controlled strongly by soil moisture and thus the balance between evapotranspiration and precipitation. Under dense canopy cover, high evapotranspiration means a 30% increase in precipitation causes less thaw than a 1 °C increase in temperature. However, disturbance to vegetation promotes greater thaw through reduced evapotranspiration, which results in wetter, more thermally conductive soils. In such disturbed forests, increases in precipitation rival warming as a direct driver of thaw, with a 30% increase in precipitation at current temperatures causing more thaw than 2 °C of warming. We find striking non-linear interactive effects on thaw between rising precipitation and loss of leaf area, which are of concern given projections of greater precipitation and disturbance in boreal forests. Inclusion of robust vegetation-hydrological feedbacks in global models is therefore critical for accurately predicting permafrost dynamics; thaw cannot be considered to be controlled solely by rising temperatures.
Export citation and abstract BibTeX RIS

Original content from this work may be used under the terms of the Creative Commons Attribution 4.0 license. Any further distribution of this work must maintain attribution to the author(s) and the title of the work, journal citation and DOI.
1. Introduction
The boreal forest in North America is largely underlain by discontinuous and sporadic permafrost (Helbig et al 2016) and contains huge stores of soil organic carbon (Tarnocai et al 2009). Ecosystem properties are known to influence many components of the physical processes involved in permafrost thaw (Loranty et al 2018). Thaw can be limited by greater canopy leaf area, which reduces radiation at the soil surface (Marsh et al 2010). Moss cover is an effective insulator when dry in summer and increases conductive heat loss when wet or frozen in the shoulder seasons and winter (O'Donnell et al 2009). Soil organic matter also has a similar influence as mosses on thermal conductivity and hence permafrost thaw (Johnson et al 2013).
Permafrost beneath the boreal forest is sensitive to environmental change because it is close to its climatic limit, and may only exist as it is protected by these ecosystem interactions (Shur and Jorgenson 2007). Permafrost-ecosystem feedbacks are poorly understood, particularly related to disturbance and vegetation-active layer thickness (ALT) interactions (Grosse et al 2016). The complexity of these interactions means there are disagreements between model simulations of current permafrost extent and its climate sensitivity (Koven et al 2013, Mcguire et al 2016). Permafrost thaw has considerable potential to provide positive feedback to climate change because high-latitude soil C is the largest single climate-sensitive pool in the terrestrial carbon cycle (Schuur et al 2015). Therefore, uncertainty about thaw magnifies biases and errors in predictions of the Earth system.
As well as facing a future of increased precipitation and warming (Knutti and Sedláček 2012), boreal forests are experiencing greater frequency and intensity of fires (Turetsky et al 2011, Genet et al 2013, Brown et al 2015). Fires disrupt vegetation cover and combust mosses and soil organic matter (Harden et al 2006). The reduction in leaf area index (LAI) itself by fire could increase active layer thickness (the maximum depth of seasonal thaw each year) directly, by decreasing shading and therefore increasing energy inputs to the land surface. Additionally, the LAI effect could be indirect, with reduced vegetation cover lessening both intercepted precipitation and transpiration, leading to increased soil moisture and increased soil thermal conductivity (Fisher et al 2016).
Recently, field data from Canadian boreal forests across sites of contrasting fire disturbance showed that ALT is strongly influenced by landscape ecological characteristics, including LAI, moss layer thickness, and organic layer thickness, in that order (Fisher et al 2016), but critically that these influences were mediated by soil moisture. The over-arching influence of soil moisture suggests that changes in precipitation and evapotranspiration will be hugely important in determining thaw rates, but this sensitivity has not been critically evaluated. Indeed, other model evaluations suggest that permafrost is an order of magnitude more sensitive to air temperature than to precipitation changes (Mcguire et al 2016). Given the boreal forest in permafrost regions faces a warmer, wetter future, and with more fire, determining the relative importance of direct and indirect mechanisms and understanding the combined impact of fire-precipitation-warming changes is essential if future rates of thaw are to be projected successfully.
Here we use a process-based model (Northern Ecosystem Soil Temperature (NEST)) (Zhang et al 2013) to determine the mechanisms linking soil moisture and LAI to ALT, simulating the impacts of vegetation-soil disturbance by fire and climate change on ground thermal regimes for North American boreal forests. Field data provide critical parameters for the model, and allow a validation of the model's capacity to simulate permafrost, soil temperature and moisture dynamics realistically across key forest types. We use model experiments to diagnose thaw depth patterns in relation to LAI and its changes after burning. Finally we determine sensitivity of thaw to changes in soil drainage, air temperature, precipitation, and disturbance (fire) impacts on soil and vegetation. We then discuss the implications for thaw under expected global changes.
2. Methods
2.1. Field data
Field sites were located in the discontinuous permafrost zone in the Northwest Territories, Canada. The sites, near Yellowknife, cover varying fire histories, substrates and tree canopies, and included: two black spruce (Picea mariana) sites at Mosquito Creek (62° 42' 2.3''N, 116° 8' 8.8''W), one burned in 2008 (MS-B), and one unburned (MS-U); and two sites at Boundary Creek, a black spruce site (BS, 62° 31' 36.3''N, 114° 57' 41.3''W) and a paper birch (Betula papyrifera) site (BB, 62° 31' 37.7''N, 114° 57' 38.9''W). For all sites the local terrain sloped gently and surface soils had limited lateral drainage. A stratified survey of ecological and soil states within each site during 2014 recorded the finer scale patterns of covariation between ALT, vegetation and edaphic characteristics (Fisher et al 2016). Survey plot locations were selected ensuring that the full range of ground cover, tree canopy cover and moss and organic layer thicknesses were represented at each site. Plots were homogeneous over an area of at least 2 × 2 m, with sampling within the central 1 m2.
Overstory LAI was determined using hemispherical images (Nikon D5000 DSLR camera), 9 per plot, processed with CAN-EYE software. Understorey LAI was collected with a LAI-2000 optical plant canopy analyser (LI-COR, Lincoln, USA), as the difference of estimates generated above and below the understorey canopy. Total LAI varied from 1.7 to 2.7 for the unburned sites; the overstorey LAI ranged from 0.68 to 1.49, similar to other black spruce sites in the region (Morse et al 2016). Black spruce mortality at the burn site was complete, with many standing dead stems. Regeneration of shrubs since the fire had restored LAI to ∼50% of the unburned site (table 1).
Table 1. Canopy and soil characteristics of the study site locations during a survey in summer 2014. For extensive surveys across each site (N = sample number), we report the mean (standard deviation) for LAI, above ground biomass (calculated from stem survey, all stems >3 cm diameter at breast height), estimate height of vegetation (m), organic matter thickness (cm) and moss thickness (cm).
| Site | Dominant species | Leaf area index | Above ground biomass (kg m−2) | Veg. Height (m) | Organic matter thickness (cm) | Moss thickness (cm) | N |
|---|---|---|---|---|---|---|---|
| Boundary Creek Birch (BB) | Paper birch (Betula papyrifera). Sparse black spruce (Picea mariana) understorey, thick birch litter layer. | 2.66 (0.61) | 10.3 | 20 | 57 (23) | 0 | 24 |
| Boundary Creek, Spruce (BS) | Black spruce (Picea mariana). Understorey of moss and shrubs | 2.37 (0.55) | 5.95 | 10 | 51 (24) | 5 (3) | 24 |
| Mosquito Creek, burned (MS-B) | Shrub birch (Betula glandulosa), Rhododendron groenlandicum and Vaccinium vitis-idaea established post-fire (2008). Many standing dead Picea mariana trees. | 0.94 (0.48) | 0.0 | 2 | 46 (17) | 1 (1) | 30 |
| Mosquito Creek, unburned (MS-U) | Black spruce (Picea mariana). Understorey of moss, shrubs and forbs. | 1.70 (0.46) | 5.87 | 12 | 57 (15) | 7 (6) | 30 |
Moss thickness was determined by careful cutting of the moss layer, avoiding compression, and then direct measurement from the top of the moss layer to the depth at which decomposing moss had no discernible structure. This approach focused on quantifying the insulative properties of mosses present. Soil organic matter thickness was measured using a soil corer, from the base of the moss layer to the base of the O horizon. The mean topsoil organic layer thickness ranged between 0.46 and 0.57 m (table 1). We compared the burned black spruce site in Mosquito Creek (MS-B) to the neighbouring unburned site to estimate that the fire consumed the entire moss layer and, on average, 11 cm of the soil organic layer, typical of early-season burns in boreal North America (Turetsky et al 2011). Thaw depth was recorded through inserting a graduated stainless-steel rod inserted until impeded by frozen soil, with a custom-built temperature probe (British Rototherm Co. Ltd., Port Talbot, UK) used to confirm the depth of penetration of the 0 °C isotherm. ALT measured in August, was within the range recorded in the region (Morse et al 2016).
Soil temperature profiles were recorded through the growing season with five thermistors per site inserted in tubes sealed at the bottom and filled with antifreeze. Thermistors were left at a given depth to equilibrate until a constant value of resistance was displayed in a multimeter (model: Fluke 289) and values were converted to degree Celsius (accuracy determined at ±0.05 °C). Soil moisture profiles were monitored using a PR2 profile probe (sensors at 10, 20, 30 and 40 cm, Delta-T Devices Ltd, Cambridge, UK) inserted in access tubes installed in the profile using an auguring kit to minimize disruption of the soil structure. The manufacturer reported accuracy is 0.06 m3 m−3( 6%) (at 0 °C to 40 °C). The access tubes were initially placed as deep as thaw depth allowed and further inserted deeper as the soil thawed. Values of volumetric soil moisture (m3 m−3) were recorded from a HH2 meter (Delta-T Devices Ltd, Cambridge, UK).
2.2. Modelling
The NEST model was used to isolate and diagnose the mechanisms of ALT variation. NEST is a process-based model developed to quantify the impacts of climate change on ground thermal regimes in high latitudes (Zhang et al 2003). NEST integrates the effects of key factors on ground thermal dynamics, including atmospheric climate, vegetation, snow, soil composition and ground condition, soil moisture, soil thawing and freezing and associated changes in liquid water, soil thermal conductivity and heat capacity (see supplement for model details and a model schematic (available online at https://stacks.iop.org/ERL/15/114050/mmedia)).
For model climate forcing, daily minimum and maximum temperature, precipitation and rainfall were accessed from Yellowknife Airport climate station (beginning from 1943, WMO ID 71 936). Daily water vapour pressure, solar radiation, and wind speed during 1953–2005 were accessed from Environment Canada and the National Research Council of Canada (2007), which provide hourly data based on station observations. For the other periods (1943–1952, 2006–2016), water vapour pressure and solar radiation were estimated based on their relationships with daily air temperature developed using the data during 1953–2005 (Zhang et al 2012). The thickness of moss and soil organic layers in each model simulation was set based on field measurements at each site, determined from soil cores (table 1 and see supplementary material).
2.3. Ecological and climate sensitivity experiments
After model validation, we undertook a series of model experiments to diagnose and understand the processes that control the dynamics of ALT. We used modelling at the burned and unburned black spruce sites in Mosquito Creek (MS-B and MS-U) to understand how fire affects ALT through changes in vegetation and/or soils. Beginning from the same initial conditions, we introduced perturbations from 2008 based on observed differences in soil organic layer and vegetation between burned and unburned sites. The experiments comprised (i) changes to both vegetation, moss and organic layer (i.e. nominal disturbance case); (ii) change to the vegetation but not the moss, soil organic layer nor albedo; (iii) change to the moss, organic layer and albedo but not the vegetation; and (iv) nothing changed, i.e. no fire, as a control for moss, organic layer, vegetation and albedo. The experiments allowed quantification of the relative importance of different effects of fire on ecosystem states and thereby onto thaw. To investigate the sensitivity of ALT to LAI recovery post-fire, we imposed different successional trajectories in LAI. These included the observed recovery to LAI = 0.9 by 2014 (table 1), a recovery at half this rate, and no recovery of LAI at all.
To explore the direct and indirect effects of shading on energy balance, we then investigated the sensitivity of ALT to changes in vegetation cover (LAI) and soil moisture. Because climate varies day by day and year by year, we ran the model from 1942 to 2016 and analysed the averages during this period. Firstly, we varied LAI from 0 to 4, from no canopy to dense foliar cover for the black spruce site in Boundary Creek (BS). Then we repeated this sensitivity experiment thrice, with the following different adjustments: (i) keeping the soil at saturation (i.e. field capacity) all the time; (ii) increase soil draining by modifying surface lateral water flow parameters so the water table was kept below 0.4 m depth; and (iii) removing any LAI shading effects on solar radiation received on the land surface or snow surface if snow exists (the canopy still intercepts solar radiation). These experiments evaluated the importance of LAI interactions with soil moisture (i and ii) versus radiation controls (iii).
To understand the climate sensitivity of thaw in a boreal landscape we investigated the sensitivity of ALT to variations in air temperature and precipitation under different LAI based on the Boundary Creek black spruce site (BS). In northern Canada, the forecast for 2100 is for temperature increases of 2 °C –7 °C and precipitation rises of 10%–30% (Bush and Lemmen 2019). For our tests, daily air temperature was adjusted across the forcing data by changes from −2 °C to +5 °C, spanning the magnitude of expected temperature changes (certain to be increases) in coming decades (Bush and Lemmen 2019). Precipitation forcing was adjusted by a factor of 0.5–1.5 reflecting greater uncertainty in forecasts of precipitation in coming decades (Bintanja and Andry 2017). Other climate variables (e.g. diurnal temperature range, the timing of the precipitation, relative humidity and solar radiation) were left unmodified. The precipitation was treated as rainfall if daily mean air temperature >0 °C, otherwise it was treated as snowfall.
3. Results
3.1. Model validation
For soil temperature, the calibrated model was able to explain effectively the patterns observed through the soil profile and across the growing season (June to August) at all the sites (figure 1). Across the spruce and birch sites, the mean coefficient of determination (R2) was 94%, regression slopes were close to one (range: 0.9–1.15), and intercepts close to zero (range: −0.26–0.31), with a mean root mean square error (RMSE) of 1.5 °C (table 2). The simulations matched the observations of evolving soil temperature in both unburned and burned black spruce sites at Mosquito Creek, and resolved the differences in profiles down to 1 m. Some mismatches did occur in upper soil layers, for which data are more prone to local perturbations.

Figure 1. Modelled and measured soil temperature profiles for the unburned (top panels) and burned (bottom panels) black spruce forest sites in Mosquito Creek across four dates during the growing season. The curves are modelled (the dates are shown below each column) and the crosses are measured on the corresponding date at different locations within the study site. In all cases depth is from the soil surface at burnt sites and from the moss surface at unburnt sites.
Download figure:
Standard image High-resolution imageTable 2. Evaluation statistics for NEST model simulations of temperature and moisture estimates through soil profiles (up to 1 m depth for temperature, up to 0.4 m depth for moisture), and of thaw depth, from late June to late August 2014 at four sites in Northwest Territories, Canada. The statistics include coefficient of determination (R2), slope and intercept of regression of modelled on measured values, and the root mean square error (RMSE) of model outputs. Dominant vegetation is noted for each site, although for the burned site the vegetation was heavily disturbed. The observations used in the statistics were mean values for multiple samples at each site.
| Site | Variable | R2 | slope | intercept | RMSE |
|---|---|---|---|---|---|
| Boundary Creek (BB), Betula papyrifera | soil temperature (°C) | 0.94 | 1.15 | 0.28 | 1.74 |
| soil moisture (m3 m−3) | 0.78 | 0.52 | 0.07 | 0.05 | |
| Thaw depth (cm) | 0.60 | 0.55 | 25 | 6.2 | |
| Boundary Creek (BS), Picea mariana | soil temperature (°C) | 0.95 | 1.06 | 0.31 | 1.53 |
| soil moisture (m3 m−3) | 0.85 | 0.63 | 0.19 | 0.13 | |
| active layer thickness (cm) | 0.68 | 0.52 | 23.3 | 8.8 | |
| Mosquito Creek burned (MS-B), Picea mariana( charred snags) | soil temperature (°C) | 0.94 | 0.97 | 0.02 | 1.32 |
| soil moisture (m3 m−3) | 0.53 | 0.47 | 0.3 | 0.16 | |
| active layer thickness (cm) | 0.99 | 0.7 | 38.6 | 16.4 | |
| Mosquito Creek unburned (MS-U), Picea mariana | soil temperature (°C) | 0.94 | 0.9 | 0.01 | 1.52 |
| soil moisture (m3 m−3) | 0.76 | 0.41 | 0.23 | 0.22 | |
| active layer thickness (cm) | 0.76 | 0.48 | 22.8 | 5.9 |
For soil moisture, the model explained 73% of variability in mean observations over time, although there was clear bias (slopes ranged from 0.41 to 0.63) and mean RMSE was 0.14 m3 m−3( table 2). The model reproduced well the moisture conditions found in the lower profile (figure 2) but tended to over-estimate surface soil moisture (0.05 m depth). Both model and data suggested lower soil moisture values in the unburned sites (figure 2, top panel), although the model values were systematically larger than the observed values at 0.05 and 0.15 m depth. Soil moisture data were more varied across the sampling locations at each site than model simulations, likely linked to the natural variability of the samples.
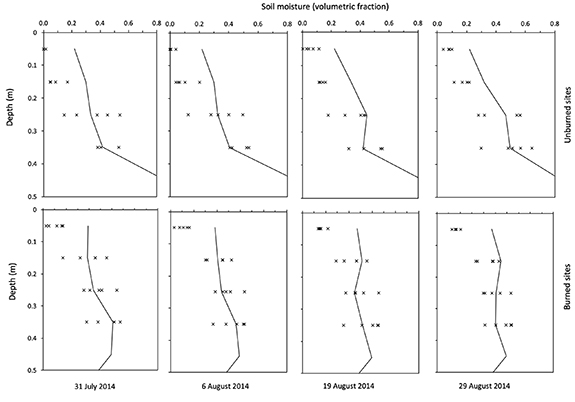
Figure 2. Modelled and measured soil moisture profiles for the unburned (top panels) and burned (bottom panel) black spruce forest sites in Mosquito Creek across four dates during the growing season. The curves are modelled (the dates are shown under each column) and the crosses are measured on the corresponding date at five locations within the study site. In all cases depth is from the soil surface in burnt site and from the moss surface in unburnt site.
Download figure:
Standard image High-resolution imageThe evolution of summer thaw depth in the model was comparable with observations, with a mean R2 of 0.76, and mean RMSE of 0.093 m (table 2). In terms of timing, rapidity of thaw and peak thaw depth, the model produced outputs similar to observations for both burned and unburned sites (figure 3). Transitions between modelled soil layers account for the step-like outputs. For the burned site (figure 3(b)), the model output was within the range of the five measurement locations, except for the initial measurement. For all sites the model tended to overestimate thaw depth in early summer by ∼10 cm, but this bias was reduced by late summer.
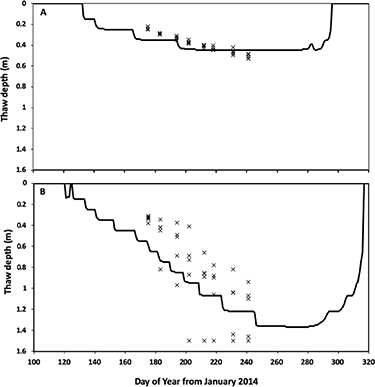
Figure 3. Modelled and measured thaw depths for unburned (a) and burned (b) black spruce forest sites in Mosquito Creek. The curves are model outputs and the crosses are independent observations at five locations within the study sites.
Download figure:
Standard image High-resolution imageWhile there are indications of bias in model outputs compared to observations (figure 2), the dynamics of soil variables, and their absolute differences between burned and unburned sites, are comparable for both observations and models. If model process sensitivity is close to linear (e.g. between soil moisture and thermal conductivity), then simulating the magnitude of changes/differences realistically is most important for representing the process interactions and feedbacks on ALT. The capacity of the modelling to explain the difference in ALT for burned and unburned sites over time based purely on local parameters supports this validity assumption (figure 3). The error (over-estimation) in soil moisture is systematic and has a limited effect on soil thermal conditions and surface energy fluxes, and therefore does not affect the conclusions of the paper. Overall the NEST model has been shown capable of simulating the soil biophysical dynamics of typical coniferous and broadleaf boreal forests of North America.
3.2. Key determinants of fire impacts
Our model experiments on the black spruce sites at Mosquito Creek show that the imposition of observed LAI loss from a fire in northern Canada is responsible for the majority of the observed increase in ALT and for soil warming post-fire, compared to lesser effects of observed losses of moss and organic layer thickness (figure 4). The effect of organic layer thinning post-fire, while important, is secondary in this case, because the post-fire combined moss and soil organic layer is still thick at our burned site (0.46 m) despite the largely complete removal of the moss layer.

Figure 4. Model predictions over 16 years of peak active layer thickness (ALT) under various removal scenarios of soil, moss and vegetation LAI cover for boreal sites in Northwest Territories, Canada. The no fire case (thick black line) uses soil and vegetation parameters from an unburned black spruce site. The fire case (red line) uses data from a site that burned in 2008. LAI was reduced to 0 post-fire and recovered linearly to 0.9 by 2014. Modelling assumed no recovery in soil or moss thickness post-fire.
Download figure:
Standard image High-resolution imageCritically, our analysis indicates that ALT sensitivity to LAI arises mainly through the effects of vegetation on soil moisture. Reduced LAI post-fire increases soil moisture in surface soils (figure 2), which boosts thermal conductivity and soil thaw. Dry organic soils, very effective insulators, are found under high LAI canopies, due to interception of precipitation and higher rates of transpiration. Fire reduces LAI, reduces interception and transpiration, leading to wetter soils which conduct heat to depth more effectively, boosting soil thaw. ALT dynamics are also highly sensitive to vegetation recovery after fire. Our modelling reveals that near-surface permafrost becomes unstable after fire removal of LAI, so thaw can reach a depth of 5 m depth and begin to enter bedrock after five years if LAI does not recover (figure 5). Ecological succession is then critical for stabilising permafrost post-fire, allowing re-establishment of a thin (<0.5 m) active layer as surface soils dry with recovery of LAI, transpiration and interception (figure 5). Conversely, shortened fire return periods and/or more intense fires can imperil permafrost by reducing mean LAI over extended periods.

Figure 5. Model predictions of ALT (m) under different conditions of vegetation recovery during eight years after fire disturbance in 2008. Different LAI scenarios are indicated: black = no fire disruption; blue dash = LAI recovered to observed value (0.9) after 8 years; green short dash = LAI recovered to 0.45 after 8 years; red = no LAI recovery (0 after 8 years).
Download figure:
Standard image High-resolution image3.3. Separating soil moisture and shading effects
We undertook additional model experiments for black spruce forests, forcing shading and soil moisture regimes, to determine their impact on ALT. Our results show that the vegetation (LAI) effect on ALT is mainly through changes in soil moisture, rather than the direct effect of shading on energy balance. Modelled soil moisture is responsive to LAI control on water input (interception) and output (evapotranspiration). Soil moisture is greatest at low LAI and declines rapidly with increasing LAI (black curves in figure 6(a)), due to rising interception and evapotranspiration. Surface moisture stabilizes in the model under greater LAI (>2), as soil drying restricts water uptake in the model. The experiment with removal of shading had only small effects on moisture (dashed black curves in figure 6(a)). There is a similar response for ALT, also declining with increases in LAI; the response is initially rapid, then gradually stabilizes at greater LAI (figure 6(b)). The experiments that remove shading again had little effect on ALT. In experimental conditions with increased lateral drainage, soil moisture is low and largely independent of LAI (red curves in figure 6(a)). In this case, representative of steeply sloping terrain, ALT decreases less and more gradually with increased LAI due to a limited potential for vegetation to influence soil drying (red curves in figure 6(c)). The modelling shows that ALT is lower in these more freely draining conditions due to drier soils. These drier soils thaw less deeply (63%–96% of the thaw under observed, local conditions), with greatest divergence at low LAI. Equally, if soil moisture is experimentally kept constant and saturated for all LAI (blue curves in figure 6(a), representative of low-lying wetland conditions) ALT is increased relative to observed conditions (compare figures 6(b) and (c)) and is less sensitive to LAI (figure 6(c)).
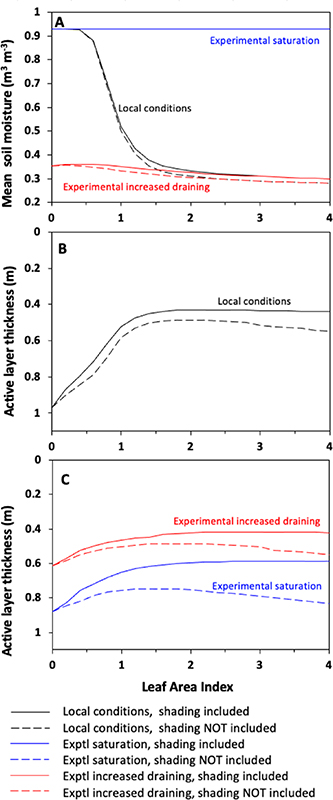
Figure 6. The sensitivity of ALT (active layer thickness) to changing LAI (leaf area index) and attribution of the underlying mechanisms. Model simulations partition the ALT-LAI coupling between soil moisture and land surface shading effects. (A) Sensitivity of mean soil moisture at a depth of 0.1–0.2 m from June to September to LAI variation for the local, Mosquito Creek black spruce, calibration and two hydrological experiments. Solid blue line and dashed blue curves are the same, hence the latter is not visible. The curves represent the averages of the modelled years 1942–2016. (B) The sensitivity of ALT to LAI variation under locally observed conditions, so that modelled soil moisture is a function of LAI. (C) Two experiments with adjusted hydrology: The blue curves repeat the sensitivity experiments with soils saturated under all conditions; i.e. soil drying from evapotranspiration is prevented. The red curves show the sensitivity with increased draining included; surface soils drain laterally, leading to drier soils, independent of LAI and associated evapotranspiration. The dashed line shows how sensitivity changes with shading effects removed.
Download figure:
Standard image High-resolution imageBoth the modelling and field observations (Fisher et al 2016) show that the LAI-soil moisture interaction is the more important biophysical determinant of ALT. With artificial removal of shading effects of plants on the land surface (dashed curves in figure 6), ALT still remains highly sensitive to change in LAI. The plant shading effects on ALT account for just 10% of overall LAI effects under field observed conditions, 32% for steeper sloping landscapes (high lateral drainage conditions), and 56% for saturating conditions (LAI decoupled from evapotranspiration). When LAI controls soil moisture dynamics in the model, as observed in the field, this LAI-soil moisture interaction is the more important biophysical determinant of ALT. Shading effects on ALT became relatively, but not absolutely, more important only under conditions of increased lateral drainage; and absolutely more important when soil moisture was kept saturated. In short, the LAI loss effect on soil moisture is the main driver of ALT deepening following disturbance in the landscapes we studied.
3.4. Sensitivity of thaw to air temperature and precipitation
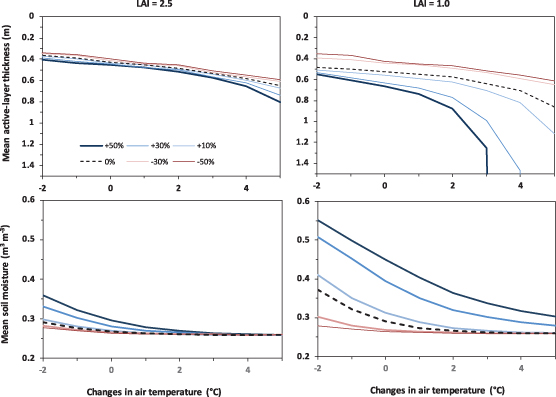
To determine the climate sensitivity of ALT and soil moisture, we modelled predicted changes in air temperature and precipitation. We found that the deepening of thaw with rising mean annual air temperatures was non-linear and strongly amplified by reductions in LAI and increasing annual precipitation. Fundamentally, the thaw responses to changes in surface temperature and precipitation are interactive. This interaction is multiplicative rather than independent or additive. The non-linear response is greatest in low LAI conditions (figure 7), when soil moisture is more sensitive to precipitation changes. There is an interactive effect between changes in precipitation and changes in air temperature regardless of LAI, but this interaction is much stronger in a disturbed landscape, where LAI = 1 (figure 7, right panels), than in landscapes with typical canopy cover (LAI = 2.5, figure 7 left panels). At LAI = 2.5 a 30% increase in precipitation increases the effect of 3 °C warming on ALT by 32%. At an LAI = 1 (fire disturbed landscape, figure 7 left panels), the temperature-precipitation interaction is much stronger, with a 30% increase in precipitation magnifying the thaw effect of 3 °C warming by >300% (table 3). The non-linear interactions demonstrated here at low LAI are striking (table 3). In disturbed forests (LAI = 1), increases in soil moisture linked to rising precipitation rival warming as a direct driver of thaw, with a 30% increase in precipitation at current temperatures causing more thaw than 2 °C of warming. Contrastingly, in undisturbed forest (LAI = 2.5), a 30% increase in precipitation causes less thaw than a 1 °C increase in temperature (table 3). The increased sensitivity of soil moisture to precipitation under lower LAI is clearly simulated (figure 7).
Figure 7. Modelled sensitivity of active layer thickness (top row, ALT) and surface layer soil moisture (lower row), averaged from 1942 to 2016, to variations in air temperature under different precipitation changes (shown as separate curves, legend in top left panel). The left-hand panels show results for LAI = 2.5, and the right-hand panels for LAI = 1.0.
Download figure:
Standard image High-resolution image
Table 3. Relative adjustment in active layer thickness under changes in mean annual air temperature (ΔT, rows) and mean total precipitation (ΔP, columns) for boreal vegetation with LAI = 1 (left hand columns) and LAI = 2.5 (right hand columns) as simulated by the NEST model. The numbers are determined as the ratio of ALT for each scenario compared to the baseline ALT (ΔT = 0, ΔP = 0).
| LAI = 1 | LAI = 2.5 | |||||||
|---|---|---|---|---|---|---|---|---|
| ΔP( %) | ΔP( %) | |||||||
| ΔT( °C) | 0 | 10 | 30 | 50 | 0 | 10 | 30 | 50 |
| 0 | 1.00 | 1.06 | 1.20 | 1.26 | 1.00 | 1.01 | 1.04 | 1.05 |
| 1 | 1.05 | 1.12 | 1.29 | 1.40 | 1.05 | 1.06 | 1.10 | 1.11 |
| 2 | 1.10 | 1.19 | 1.46 | 1.67 | 1.13 | 1.15 | 1.17 | 1.20 |
| 3 | 1.21 | 1.35 | 1.88 | 2.38 | 1.24 | 1.26 | 1.31 | 1.33 |
| 4 | 1.35 | 1.56 | 2.79 | 30.57 | 1.36 | 1.38 | 1.45 | 1.52 |
| 5 | 1.64 | 2.13 | 45.64 | 85.36 | 1.51 | 1.56 | 1.72 | 1.87 |
4. Discussion
Our biophysical model, evaluated across a range of North American boreal ecotypes, including both spruce and birch forests, and disturbance states linked to fire, reveals the complex interaction of climate and vegetation in driving variation in thaw depth. The model provides new insights into the ecological protection of permafrost through vegetation-soil moisture interactions (Shur and Jorgenson 2007). In agreement with Fisher et al (2016), the modelling shows that organic soil moisture is the critical intermediate variable between LAI and thaw (figure 6(a)). Our finding that the thaw impacts of surface temperature and soil moisture changes are multiplicative is mechanistically consistent with the Stefan solution—a standard theoretical equation used by permafrost scientists to estimate thaw (Burn 2004). The efficacy of evaporation in reducing thaw in a boreal region was previously shown in a numerical microclimate model by Smith and Riseborough (1983), but this did not draw attention to the effects of evaporation or transpiration on soil thermal conductivity. Our modelling supports and elucidates the conclusion of these authors, showing that to understand thaw we not only need to be tracking changes in air temperature but also changes in LAI and soil moisture.
The role of soil thermal conductivity on active-layer thickness is clearly related to heat transfer, but previous studies have tended to focus on the differences in conductivities of the active layer during freezing and thawing seasons (i.e. thermal offset) and the role of the offset in limiting active-layer depth and maintaining permafrost in organic-rich soils in the discontinuous, sporadic and isolated permafrost zones (Williams and Smith 1989, French 2017). Our study highlights and analyses the sensitivity of the thermal conductivity of the active layer to changes in soil moisture during the thawing season, linked to post-fire changes in evapotranspiration (figure 1, figure 2). Such work provides essential mechanistic understanding of the processes that drive permafrost thaw in the boreal zone.
The vegetation-soil moisture interactions on ALT demonstrated by our model experiments (figure 6) have major implications for simulating future rates of permafrost thaw. Changes to evapotranspiration caused by vegetation disturbance increase the sensitivity of permafrost thaw to precipitation relative to temperature changes (figure 7), challenging the conclusions from the model evaluations in Mcguire et al (2016). Our simulations show that when both air temperature and precipitation increase, there is an interactive amplification of active layer thickening due to changes in snow cover and soil moisture conditions. This interaction is particularly strong at low LAI (figure 7) due to the reduced capacity to intercept and transpire water, so that moisture accumulates in the active layer, increasing thermal conductivity and driving deeper thaw.
These interactions of precipitation, LAI and air temperature on ALT are of particular concern given that climate models suggest that air temperature and precipitation will rise across high latitudes through this century (Knutti and Sedláček 2012). On one hand, warming will increase rates of transpiration, potentially drying soils further, and may also increase plant growth, LAI, and upper organic layer accumulation. These factors may strengthen ecosystem protection of permafrost by reducing soil moisture and therefore thermal conductivity. However, greater amounts of precipitation eliminate this increase in protection (table 3). The thaw response to warming may be substantially greater than current predictions if LAI is reduced (figure 7). Furthermore, warming is predicted to stimulate fire ignition, intensity and spread by drying fuel and increasing fuel production, and could increase tree mortality through increased drought (Gauthier et al 2015, van der Werf et al 2017). Such disturbances, along with increased storm damage, pest outbreaks and forest harvesting will reduce LAI, changing soil moisture and thermal conductivity, and thereby disrupt ecological protection of permafrost and promote permafrost thaw (Gauthier et al 2015, Zhu et al 2016).
This study is focused on North American boreal ecosystems, for which our study sites are highly relevant and broadly generalisable. Black spruce (Picea mariana) forest is the most widespread type in interior Alaska, covering ∼40% of boreal Alaska (Van Cleve et al 1983). Spruce (white and black) are by far the most dominant forest cover type across Canada, covering 53% of its forested area (Government of Canada 2013). Paper birch and poplar are also important components of Alaskan boreal forests and the second most widespread cover type in Canadian forests. And 25% of boreal forest cover in North America is located on discontinuous permafrost (Helbig et al 2016). While the ecological principles we outline may be consistent with Eurasian boreal forests, potential differences related to phenology of their dominant species and the more common distribution of these forests on continuous permafrost (Helbig et al 2016) require further investigation.
Because our sites had relatively thick organic matter (>0.46 m, table 1) as compared to other boreal surveys (e.g. 0.23 m mean thickness in Turetsky et al (2011) and in Lafleur et al (2015)), we may have found a stronger vegetation disturbance effect relative to organic layer thinning than the norm. Importantly, our results show that even areas of greater soil C thickness, such as we studied, are vulnerable to thaw despite the thicker organic layer (figure 3). This vulnerability results because SOM, regardless of observed variations in thickness, is only an effective insulator when its soil moisture is low, for instance through drying by evapotranspiration (figure 7). Post-fire changes in soil moisture and evapotranspiration, which in turn alter soil thermal dynamics to impact ALT, will occur regardless of observed variations in SOM thickness. Thus, our conclusion that the dominant sensitivity on ALT is through LAI change over SOM change should remain broadly valid for much of the 1.4 M km2 of boreal forest on discontinuous permafrost in North America (Tarnocai et al 2009), particularly those with thick organic horizons and larger C stocks. Model validation showed a tendency to over-predict surface soil moisture (figure 2), so the extent of predicted impacts may be slightly less than the model forecasts. However, the effects of LAI on soil moisture (and thus thermal conductivity) and ALT are strong enough that our conclusions are valid.
The soil thermal regimes for dominant boreal forest types are controlled strongly by soil moisture and thus the balance between evapotranspiration and precipitation. Disturbance to vegetation leads to greater thaw, as lower LAI leads to reduced evapotranspiration, and wetter, more thermally conductive soils. In such disturbed forests, increasing precipitation rivals warming as a direct driver of thaw. There are important non-linear interactive effects on thaw between rising precipitation and loss of leaf area. Ultimately, warming will thaw boreal permafrost, interacting with soil organic layer thickness and snow depth. But we conclude that future rates of thaw cannot be predicted accurately without considering hydrological changes linked to increases in vegetation disturbance frequency and precipitation amounts, which are likely and will interact strongly and multiplicatively to substantially accelerate thaw (Abbott et al 2016). By identifying the dominant role through which vegetation controls permafrost dynamics, we emphasise that Earth System Models should evaluate the representation of these key processes to strengthen their applicability.
Acknowledgments
This work was funded by NERC through grant NE/K000292/1 to MW, NE/K00025X/1 to GKP, NE/K000179/1 to IPH, and NE/K000241/1 to JM. YZ's work was funded by Polar Knowledge Canada Science and Technology Program (project 186), and also contributes to a project affiliated to the Arctic Boreal Vulnerability Experiment (ABoVE), a NASA Terrestrial Ecology Program. MW, GP, JM, DC and IH devised the overall plan and oversaw the experimental and observational data collection. JF, GX and CEA collected field data. YZ and MW undertook the modelling. MW, YZ, GP, JM and IH wrote the manuscript with assistance from all other authors. We acknowledge the assistance of Aaron Thierry and Rachael Treharne in supporting field data acquisition. We thank Stephen Wolfe and Steve Kokelj for advice on site selection and for logistical support. Data are available at NERC EIDC (data collection 'Carbon Cycling Linkages of Permafrost Systems'). Authors declare no competing interests. Ideas expressed in this study have benefitted substantially from discussions with Chris Burn, Toni Lewkowicz, Steve Kokelj and Steve Wolfe about boreal ground thermal regimes and active-layer monitoring. The two anonymous referees are thanked for their valuable comments on an earlier version of the manuscript.
Field data are available freely online at: https://catalogue.ceh.ac.uk/documents/108ed94d-3385-4e54-ba96-d4ad387fcae1.
NEST model code is available on request from YZ.
Data availability statement
The data that support the findings of this study are openly available at the following URL/DOI: https://doi.org/10.5285/36f4e380-d01d-44a7-8321-7a677e6996b2.