

Abstract
Marine aquaculture (i.e. seafood farming in the ocean) has the potential to substantially support growing demand for animal protein. Despite vast amounts of suitable ocean space across the world, marine aquaculture development has been slow and geographically heterogeneous, indicating that factors other than suitable farming conditions are influencing industry growth. Using multivariate techniques, this study explores to what extent certain socioeconomic, governance, and biophysical factors can explain country-level patterns of mariculture production. We find that socioeconomic conditions are a significant contributor to whether a country produces mariculture and the magnitude of its production; our models explain up to 33% more of the variation in mariculture production compared to models including only biophysical parameters. These results are relatively consistent across types of mariculture production (i.e. finfish, crustaceans, molluscs, and algae). Our findings suggest that improving seafood farming infrastructure, creating local demand for seafood, and facilitating knowledge transfer from land-based and freshwater aquaculture could help countries develop stronger mariculture industries.
Export citation and abstract BibTeX RIS
1. Introduction
Marine aquaculture (mariculture), the farming of seafood in the ocean, is not subject to the same space and resource limitations that hinder the expansion of land-based aquaculture and agriculture [1, 2]. There are vast expanses of ocean space suitable for mariculture [3, 4], and the ocean environment provides several key inputs for production such as food (for filter-feeders like molluscs), nutrients (for algae), and natural oxygenation [5, 6]. Further, mariculture production can be one of the most efficient forms of animal protein production [7–10], and conservative estimates put potential global annual production for finfish species alone at 15 billion tons, over 100 times the current global consumption of all seafood [4]. Yet, as of 2016, mariculture represents just 36% of global aquaculture (freshwater, land-based, marine, and brackish) production and ∼19% of all seafood produced for human consumption [11]. Growth in production has been slow and geographically heterogeneous [4], and our knowledge is limited regarding the dynamics influencing geographical variation in mariculture production. Within this limited understanding, research has shown that suitable biophysical growing conditions for farmed species are not indicative of mariculture production levels [4]. Thus, there is a disparity between biophysical potential and actual mariculture production that raises the question of what other factors, including social, economic, and governance conditions, are driving mariculture production.
Research attempting to identify the relationship between mariculture development and non-biophysical drivers has made inferences based on the broader aquaculture industry or has focused on country or regional case studies to draw more general conclusions. Bostock et al [12] highlighted several factors, such as market demand and infrastructure, in driving the development of the aquaculture industry but did not assess the magnitude of these factors' influence, nor examine them within the specific context of mariculture. Mariculture warrants a more specific investigation than the current aquaculture literature provides as the ocean commons is a contested space where property rights are often not clearly defined, and use of the marine space is tangled up in a different conglomeration of social, cultural, economic, and political claims than land-based resources [13].
Within the mariculture-specific literature, governance appears to play a role in development [14, 15]. Other studies have evaluated public perceptions of mariculture, finding both public support and opposition to seafood farming depending on location and species [16, 17], but there has yet to be any work assessing the influence of these types of dynamics on where and to what extent the mariculture industry develops. Similarly, there is a growing literature exploring the economic dynamics of mariculture for individual species, such as the global integration of the salmon market [18] as well as the role of technological innovations in increasing industry productivity and improving market competitiveness [19]. However, attempts at understanding how economics influence production beyond individual species or countries are limited.
Conversely, our understanding of drivers of agriculture expansion and the complex causal mechanisms involved in that industry's development have been explored extensively on global [e.g. 2, 20], regional [e.g. 21], national [e.g. 20, 22], and local scales [e.g. 20, 23]. Population and income [2] as well as global trade markets, commodity prices, energy prices, and OECD agricultural polices [20] have been identified as major drivers of change in global agriculture, while per capita consumption [2], per capita income, evolving market chains, and shifting public policy often influence the industry at the country level [20]. These studies have provided a catalyst for several subgenres of agricultural literature, including evaluations of the global environmental impacts of industrial agriculture [e.g. 24, 25] and opportunities for more efficient and sustainable production [e.g. 26, 27]. Although this level of research attention has not been paid to mariculture, agriculture scholarship does suggest hypotheses of what factors, such as policies that enable industry growth and national development, might be driving mariculture expansion and change.
Here we present logistic and linear regression analyses to examine what factors, beyond biophysical parameters, are driving global spatial variability in mariculture production. We used 2017 mariculture production data from the Food and Agricultural Organization of the United Nations (FAO), classified at the country level and inclusive of all marine, coastal, and brackish water production [11]. This data included finfish, invertebrates, and aquatic plants such as seaweeds but excluded ornamental species. Predictor variables were selected based on reviews of current mariculture development research as well as analogous studies in agriculture, and included social, economic, and governance indicators in addition to variables describing a country's demographic and biophysical characteristics. We also included variables that reflect wild seafood harvest and freshwater aquaculture production to explore the relationship between different seafood sectors. There are differing hypotheses regarding the relationship between mariculture and capture fisheries production levels, with some arguing that there is an inverse relationship between the two [e.g. 28, 29], some identifying potential synergies [e.g. 30–32], and others finding no evidence of positive or negative impacts [33].
The relationship between freshwater aquaculture and mariculture is even less clear. Given that freshwater aquaculture and mariculture produce similar products, we predicted a strong potential for the presence of freshwater aquaculture to influence whether or not a country produces mariculture as a result of knowledge transfer and food processing infrastructure. Further, preexisting freshwater aquaculture could encourage mariculture expansion by facilitating access to established markets for farmed aquatic products. Due to the geographically heterogeneous development of the mariculture industry and the vast disparities in the volume of production in countries practicing mariculture, we examined whether different factors might influence whether a country has any mariculture production and the total volume of a country's mariculture production. Lastly, we examined total mariculture production and production for four taxonomic groupings (fish, crustaceans, molluscs, and algae) as different factors may be important for different types of species and farming practices.
This study provides the first multivariate, interdisciplinary examination of the influence of certain socioeconomic, governance, and biophysical factors on current country-level mariculture production and offers foundational insights for further exploration of mariculture production drivers. Our results reveal fundamental factors that may influence how and why mariculture develops at the country level, answering broad questions about drivers of industry growth and enabling and impeding conditions for industry expansion. We provide a foundation for a new research agenda that will improve understanding of an increasingly prominent component of the global food system. Furthermore, our research is useful for countries and regions seeking industry growth as it suggests possible supportive policies and programs.
2. Methods
2.1. Data
Our analyses used 2017 mariculture production data, and we selected 11 predictor variables reflecting important country-level social, economic, and governance dynamics based on the existing mariculture and agriculture literature and our hypotheses as to what may be driving mariculture development (table 1). Justification for the selected variables and the data used to represent them in our analyses can be found in the supplementary information. We used data recorded for the year 2017 (or the most recent year available for datasets not generated annually) to identify current patterns of mariculture production. Further description of predictor variables including data sources, transformations and scaling, and summary statistics are provided in supplementary tables S1–S6. We assessed whether there were significant differences between producing and non-producing countries using a Welch's two-sample t-test for all non-categorical variables.
Table 1. Descriptions, units, and sources of predictor variables. Variables are noted as socioeconomic (#), governance (^), and biophysical (+). Links and citations to source datasets are included in supplementary table S1.
| Variable | Description | Units/Scale | Source |
|---|---|---|---|
| Capture Seafood Volume# | Volume of wild capture seafood; proxy for processing infrastructure and a country's social and cultural ties to seafood | Metric tons | FAO |
| Development# | Human Development Index, based on life expectancy, education, and per capita income indicators | Index (0 to 1 scale) | United Nations Development Programme |
| Extractive Industries# | Proportion of natural resources rents (sum of oil, natural gas, coal, mineral, and forest rents) that comprise a country's GDP | % | World Bank |
| Foreign Direct Investment# | Net inflows of foreign investment divided by GDP | 2018 USD | World Bank |
| Freshwater Aquaculture# | Existence of freshwater aquaculture | 0 = does not have freshwater aquaculture; 1 = does have freshwater aquaculture | FAO |
| Marine Protected Areas^ | Proportion of a country's exclusive economic zone that is designated as marine protected areas | % | IUCN, UNEP World Database on Protected Areas |
| Marine Spatial Planning^ | Presence of a marine spatial plan | 0 = no marine spatial plan; 1 = marine spatial plan exists, but not as national policy (i.e. for only some of the country's EEZ); 2 = marine spatial plan for a country's entire EEZ | Santos et al 2019 a |
| Regulatory Quality^ | The ability of the government to formulate and implement sound policies and regulations that permit and promote private sector development | Index; Ranges from − 2.5 (weak regulatory quality) to 2.5 (strong regulatory quality) | World Bank |
| Chlorophyll Concentration+ | Average monthly chlorophyll concentration from 2000–2014 within a 24 nm boundary of each country's coastline; proxy for primary productivity | Mg/m3 | Bio-ORACLE |
| Inshore Area+ | The area that extends from shore to either 50 km offshore or to the 200 m depth contour, whichever comes first | Km2 | Sea Around Us |
| Temperature+ | Average monthly sea surface temperature from 2000–2014 within a 24 nm boundary of each country's coastline | °C | Bio-ORACLE |
a Frazão Santos et al, 'Marine Spatial Planning' in World Seas: An Environmental Evaluation, (Elsevier, 2019), pp. 571–592.
In addition to the predictor variables outlined in table 1 and supplementary table S1, we hypothesized additional potential drivers of mariculture production, including regulatory certainty and ease of starting a business (supplementary table S7). We conducted preliminary analyses of all hypothesized variables, some of which were excluded from the final analysis due to high collinearity with other variables and others due to their limited sample sizes. When we identified pairs of highly collinear variables, we retained the variable that we hypothesized would likely be more important based on the literature review, our working knowledge, the number of countries included in the dataset for a particular variable, and stepwise regression analysis. As such, we acknowledge the possibility that our retained variables could be capturing some of the influence of the variables that were removed due to issues of collinearity.
We attempted to include as many maritime countries in the analysis as possible and pursued gap-filling for three variables: Mariculture Production, Temperature, and Chlorophyll Concentration. Countries with missing data for mariculture production were treated as true zeroes, with the justification that while production statistics reported to the FAO might not be completely accurate, a country with a commercial mariculture industry is far more likely than not to report data to the FAO. Second, a simple averaging approach was used with the temperature and chlorophyll variables, reasoning that temperature and chlorophyll would likely be similar among proximate countries, unlike social, economic, and governance factors that can have great variability even across adjacent countries. For each country missing temperature and/or chlorophyll data, we took the average of the two closest countries by exclusive economic zone (EEZ) (a country's ocean jurisdiction extending 200 nautical miles out from its coastline). This approach prevented six countries from being removed from the sample. After these gap-filling approaches, 53 countries were removed for incomplete observations, leaving 129 countries for the final analyses (figure 1 and supplementary table S8). These 129 countries represent ∼98.6% of global mariculture production reported to the FAO. We did not pursue any gap-filling beyond the three aforementioned variables because we wanted to preserve the true underlying patterns in the data. In addition to total mariculture production, we also assessed the production of four major taxonomic groupings (fish, crustaceans, molluscs, and algae) to ascertain how drivers may differ across species groups. For the individual taxonomic groups, Capture Seafood Volume refers specifically to landings of that particular taxonomic group.

Figure 1. Map of countries included in analysis (N = 129) and their corresponding mariculture production volume.
Download figure:
Standard image High-resolution image2.2. Models
We used a logistic regression to assess the impact of the predictor variables on whether a country has any mariculture production (yes or no). The logistic regression uses a generalized linear model approach to estimate the maximum likelihood of model parameters. The same number of countries were present in the taxonomic logistic analyses as those for all mariculture production (n = 129; see supplementary table S8 for full list of countries included). We calculated a Tjur's r-squared [34] to assess the extent to which the logistic model explained the variation in the data.
To address our hypothesis that different factors could influence the volume of a country's production than those that affect whether a country is mariculture-producing, we removed countries with no production and applied an ordinary least squares linear regression to the same suite of predictor variables as those used in the logistic regression to predict mariculture production volume. We log-transformed the production data to normalize the distribution. This required us to remove one mariculture-producing country where the volume of production was less than 1 MT (Samoa), as decimals produce negative log values. Countries with less than 1 MT of production for any taxonomic group were excluded from the analysis only for that specific taxonomic group. This provided us with 94, 70, 55, 53, and 35 countries for all mariculture, fish, crustacean, mollusc, and algae production, respectively (supplementary table S9).
For both the logistic and linear analyses, we compiled global models (supplementary figures S1 and S2) with the 11 predictor variables and then ran every possible permutation of the model using the dredge function in R [35]. This approach ranks models based on their corrected Akaike information criterion (AICc) [36], and we selected the top-ranked (i.e. 'best') model for the logistic and linear regressions of total production and each taxonomic grouping. While the best models were selected based on those with the lowest AICc, we also retained any models with a ΔAICc ⩽ 2 to assess the extent to which the variables presented in the best models were generally consistent with other empirically supported models [37]. Additionally, we also hypothesized and tested several interaction terms between some of our variables (e.g. Development and Foreign Direct Investment). However, the models including these interaction terms neither ranked higher based on their AICc values nor provided greater explanatory power than the best models without interaction terms. As such, we present only models without interaction terms in the results section. We also assessed how the best models (which included the biophysical parameters Chlorophyll Concentration, Temperature, and Inshore Area) performed against a simplified regression model with only those three biophysical variables included. Given the disparity in scales and units among our predictor variables, we calculated the magnitude of their influence on the dependent variable by standardizing each data point (mean-centered and scaled by one standard deviation for continuous variables), rerunning each of the best models, and taking the absolute value of the resulting coefficients.
China produces substantially more mariculture than the rest of the world (55% of global mariculture production) [11]. To assess what impact this outlier might have on our results, we repeated the main analyses after removing China from the sample population. Removing China did not affect our mariculture presence results and had a minimal impact on the variables selected and the size of the coefficients for our mariculture volume results (supplementary table S10).
All analyses were performed in R v.3.6.1 [38] using the following packages: DescTools [39], dplyr [40], ggplot2 [41], jtools [42], MuMin [35], and tidyverse [43].
3. Results
3.1. Mariculture presence
Our results show that several variables are significantly related to whether a country produces any volume of mariculture (figure 2). Using a logistic regression to assess the impact of predictor variables, we find that Capture Seafood Volume, measured as the metric tons (MT) of seafood a country harvests from the wild and used as a proxy for processing infrastructure and a country's social and cultural ties to seafood, is significantly and positively associated with the presence of fish (p < 0.01), crustacean (p < 0.01), mollusc (p < 0.01), and algae (p < 0.01) mariculture production (table 2). This relationship is strongest for mollusc and algae production where a 10 000 MT increase in wild capture harvest is associated with an approximate 177% and 162% increase, respectively, in the probability of a country farming species within that taxonomic group. Socioeconomic development status (Development, assessed using a country's Human Development Index (HDI) score) is also a significant predictor for all mariculture production as well as for mariculture of fish, crustaceans, and molluscs. A 0.1 increase in a country's HDI score was associated with a 135% increase in the probability of a country having mariculture production. The HDI is on a scale of 0–1, so even a 0.01 increase in a country's score would be quite substantial, resulting in a ∼9% increase in the probability that they produce mariculture.

Figure 2. Distribution of country-level data for select predictor variables based on production status. Variables include Capture Seafood Volume (a), Development (b), Extractive Industry (c), Foreign Direct Investment (d), Marine Protected Areas (e), Regulatory Quality (f), Chlorophyll Concentration (g), Inshore Area (h), and Temperature (i). Boxes indicate the 25th and 75th percentile for both producing and non-producing countries. Horizontal lines indicate the median value of a given variable for each production status, and the yellow diamond indicates the mean value of the variable. P-values report the results of Welch's t-tests comparing producing and non-producing countries.
Download figure:
Standard image High-resolution imageTable 2. Logistic regression predicting the likelihood of producing any mariculture as well as mariculture for four taxonomic groupings: fish, crustaceans, molluscs, and algae. Capture Seafood and Freshwater Aquaculture Production variables are specific to taxonomic groupings. Top numbers are variable coefficients and standard errors are in parentheses below the coefficients.
| Best-fit Logistic Regression Models | |||||
|---|---|---|---|---|---|
| Dependent Variable | |||||
| All Mariculture | Fish | Crustaceans | Molluscs | Algae | |
| Capture Seafood Volume (10 000 MT) | 0.025 (0.016) | 0.034** (0.012) | 0.157** (0.058 | 1.020** (0.362) | 0.962** (0.351) |
| Development | 0.856*** (0.246) | 1.076*** (0.247) | 0.981** (0.321) | 0.626** (0.233) | |
| Temperature (°C) | 0.176** (0.058) | 0.098* (0.047) | 0.241*** (0.055) | ||
| Extractive Industries (% of GDP) | −0.040 (0.025) | −0.105* (0.053) | |||
| Inshore Area (10 000 km2) | 1.728 (1.103) | 1.412 (0.769) | |||
| Marine Spatial Planning (Entire EEZ) | −2.238 (1.297) | ||||
| Marine Spatial Planning (Part of EEZ) | 1.015 (1.199) | ||||
| Freshwater Aquaculture Production (Yes) | 1.545** (0.564) | ||||
| Regulatory Quality | −0.788 (0.479) | ||||
| Marine Protected Areas (% of EEZ) | −0.050 (0.027) | ||||
| Constant | −9.834*** (2.901) | −10.638*** (2.703) | −13.729*** (3.060) | −6.023** (1.862) | −0.998*** (0.249) |
| Number of Observations | 129 | 129 | 129 | 129 | 129 |
| Log Likelihood | −52.897 | −59.707 | −59.123 | −45.631 | −64.470 |
| AICc | 118.7 | 132.1 | 130.9 | 101.7 | 135.1 |
| Tjur's R2 | 0.305 | 0.368 | 0.379 | 0.527 | 0.180 |
Note: *p < 0.05; **p < 0.01; ***p < 0.001
Only two of the three biophysical control variables are significantly associated with any forms of mariculture production. Temperature (average sea surface temperature [°C] from 2000–2014) is significantly and positively associated with a country's mariculture production status for all mariculture (p < 0.01), fish (p < 0.05), and crustacean production (p < 0.001). We also find that Inshore Area, which we use as a proxy for the extent of a country's ocean territory that is feasible for mariculture based on distance to shore and depth, was not significantly associated with whether or not a country produces any form of mariculture. Our models that include socioeconomic and governance variables perform better than our models that include only biophysical predictors based on AICc and Tjur's R-squared values, explaining at least 12% and as much as 21% more of the variation in whether a country is mariculture-producing (supplementary tables S11, S12, and S14). Other than Capture Seafood Volume, Development, and Temperature, none of the predictor variables are significant in more than one of the models in table 2.
The breadth of our predictor variables and the variety of sources from which we collected them led to large variation in scaling and units that could skew the interpretation of the coefficients in our best models. To facilitate direct comparison of coefficient magnitudes, we calculated standardized beta coefficients that can be compared across all variables within a model (figure 3). Capture Seafood Volume has by far the largest magnitude of impact on whether a country has mollusc mariculture and appears to have the strongest influence on whether a country produces fish, crustaceans, and algae. While Development is present in the models for all mariculture and the production of fish, crustaceans, and molluscs, this variable appears to have a less substantial influence than some of the other variables, depending on the taxonomic group.

Figure 3. Standardized beta coefficients for logistic regression models. Coefficients were calculated by standardizing each data point (mean-centered and scaled by one standard deviation for continuous variables), rerunning each of the best models, and taking the absolute value of the coefficients. Significant variables are noted at the 0.05 (*), 0.01 (**), and 0.001 (***) levels.
Download figure:
Standard image High-resolution image3.2. Mariculture production magnitude
Using linear models to estimate the impact of our predictor variables on the volume of country-level mariculture production, we find Capture Seafood Volume is significantly and positively associated with production for all mariculture (p < 0.001), fish (p < 0.001), crustaceans (p < 0.01), and molluscs (p < 0.001) (table 3). In particular, we find an ∼8% increase in mollusc production associated with every additional 10 000 MT of wild mollusc harvest. Freshwater Aquaculture Production has a significant and positive relationship with all mariculture (p < 0.001), fish (p < 0.05), and algae (p < 0.01) production. Development is also a significant predictor for all mariculture (p < 0.01), fish (p < 0.01), and algae (p < 0.05) production. Notably, the coefficient for Development is negative for algae production (β = −2.428), indicating the more developed a country is, the less likely it is to produce algae. A marine spatial plan (the ocean equivalent to land-use planning) that comprises only a part of a country's EEZ is significantly and positively related to all mariculture production (p < 0.05). However, Marine Spatial Planning that encompasses a country's entire EEZ is not significant.
Table 3. Linear regression results of the influence of model variables on the volume of mariculture production. Production values were log-transformed. Capture Seafood and Freshwater Aquaculture Production variables are specific to taxonomic groupings. Top numbers are variable coefficients and standard errors are in parentheses below the coefficients.
| Best-fit Linear Regression Models | |||||
|---|---|---|---|---|---|
| Dependent Variable | |||||
| All Mariculture | Fish | Crustaceans | Molluscs | Algae | |
| Capture Seafood Volume (10 000 MT) | 0.009*** (0.002) | 0.009*** (0.002) | 0.040** (0.015) | 0.078*** (0.017) | |
| Freshwater Aquaculture Production (Yes) | 4.201*** (1.223) | 3.405* (1.561) | 1.655 (0.886) | 6.194** (1.962) | |
| Development | 0.640** (0.242) | 1.093*** (0.306) | −2.428* (1.019) | ||
| Marine Spatial Planning (Entire EEZ) | 0.041 (1.438) | ||||
| Marine Spatial Planning (Part of EEZ) | 2.710* (1.085) | ||||
| Inshore Area (10 000 km2) | 0.339 (0.180) | 0.183 (0.118) | 0.935*** (0.218) | ||
| Temperature (°C) | 0.356*** (0.090) | 0.281* (0.116) | |||
| Chlorophyll Concentration (mg/m3) | 2.813** (1.005) | ||||
| Regulatory Quality | 1.462** (0.432) | 3.739* (1.565) | |||
| Constant | −0.978 (2.177) | −4.592 (2.791) | −4.523 (2.380) | 6.064*** (0.513) | 15.624 (8.209) |
| Number of Observations | 94 | 70 | 55 | 53 | 35 |
| R2 | 0.426 | 0.346 | 0.504 | 0.455 | 0.508 |
| Adjusted R2 | 0.394 | 0.316 | 0.454 | 0.422 | 0.423 |
| Residual Std. Error | 2.869 (df = 88) | 3.005 (df = 66) | 2.945 (df = 49) | 2.716 (df = 49) | 3.418 (df = 29) |
| F Statistic | 13.079*** (df = 5; 88) | 11.614*** (df = 3; 66) | 9.966*** (df = 5; 49) | 13.650*** (df = 3; 49) | 5.992*** (df = 5; 29) |
Note: *p < 0.05; **p < 0.01; ***p < 0.001
Two of the three biophysical parameters are positively and significantly associated with production in at least one linear regression model. Primary productivity, as measured by Chlorophyll Concentration, is associated with crustacean production (p < 0.01) and Temperature is positively associated with crustacean (p < 0.001) and algae (p < 0.05) production. Our models that include our social, economic, and governance variables in addition to our biophysical variables have lower AICc values and explain 11%–33% more of the variation in the dependent variable than models with only the biophysical parameters (supplementary tables S11, S13, and S14).
Freshwater Aquaculture Production has the largest standardized beta coefficients among all variables for all mariculture production, fish production, and algae production, while it has a similar magnitude as Temperature for crustacean production (figure 4). Marine Spatial Planning in part of a country's EEZ also has a relatively large magnitude for all mariculture production. Capture Seafood Volume, followed closely by Regulatory Quality (a government's ability to implement sound policies and regulations), has the largest standardized coefficient for mollusc production.
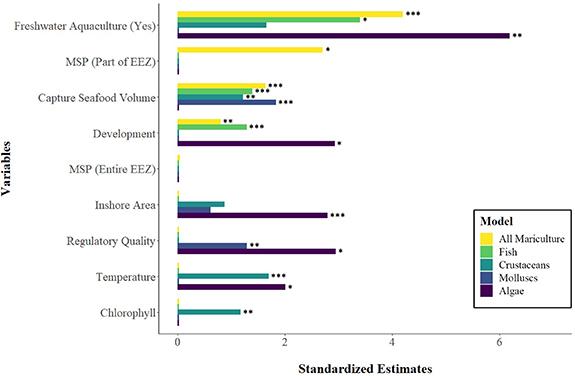
Figure 4. Standardized beta coefficients for linear regression models. Coefficients were calculated by standardizing each data point (mean-centered and scaled by one standard deviation for continuous variables), rerunning each of the best models, and taking the absolute value of the coefficients. Significant variables are noted at the 0.05 (*), 0.01 (**), and 0.001 (***) levels.
Download figure:
Standard image High-resolution image3.3. Model comparisons and inference
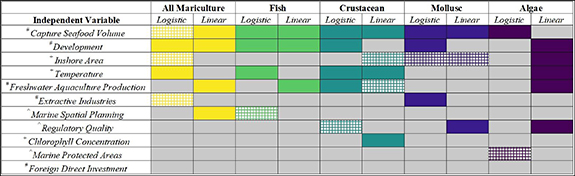
Comparing the logistic and linear regression models to determine whether different factors influence whether a country has a mariculture industry versus the magnitude of production in countries with an industry, we find that both model types include Capture Seafood Volume most frequently, followed by Development (figure 5). Capture Seafood Volume appears to have the greatest relative influence on whether a country produces any mariculture. Although Freshwater Aquaculture Production is only included in one of the logistic regression models, it is included in all linear models, except for molluscs, and is significant in the all mariculture (p < 0.001), fish (p < 0.05), and algae (p < 0.01) production models. Development is present in four of the logistic models and three of the linear models. However, it does not appear to be the strongest indicator of production for any group, though the variable's scaled beta coefficient for the linear regression of algae production is relatively large.
Figure 5. Presence of predictor variables in best model results. Variables are noted as socioeconomic (#), governance (^), or biophysical (+). Solid colored cells indicate variables that are significant at the 0.05 level and patterned cells indicate variables that are present but not significant within that model.
Download figure:
Standard image High-resolution image
In addition to key patterns across different model and production types, we find substantial consistency in the variables selected when comparing models with ΔAICc ≤ 2 (supplementary table S15). In particular, the inclusion of Capture Seafood Volume, Development, and Temperature in the best models tends to be consistent across all other models within the ΔAICc threshold. With the exception of the logistic analyses for all mariculture production and algae, the number of empirically supported models for each model type and taxonomic grouping was less than 10.
4. Discussion
As a growing global population puts increasing pressure on food systems, uncovering the drivers of commercial food production, especially sectors such as mariculture that have significant potential for growth, is critical to future food security. We find that some factors, such as Capture Seafood Volume and Development, are associated with both the presence of mariculture within a country (logistic model) and the volume of mariculture within countries with a mariculture industry (linear model). Other factors, such as Freshwater Aquaculture Production, only seem to influence production volume and are not predictive of the presence of mariculture. Further, our findings support conclusions by previous research [e.g. 4] that biophysical parameters alone do not explain the spatial heterogeneity in current global mariculture production. In our study, we find that the likelihood of a country producing any mariculture as well as their volume of production is influenced by socioeconomic and governance factors, and these factors add considerably more explanatory power (as much as 33% more) than biophysical parameters alone. Further, our methodological approach presented us with several potential models for each individual analysis and taxonomic grouping, but we find relative consistency in the variables selected across these models.
We find a strong, positive relationship between Capture Seafood Volume and mariculture production for both whether a country has any mariculture production and the volume of production. We theorize that this result could be a function of the well-established processing, distribution, and sales operations for wild seafood that could provide mariculture producers with crucial infrastructure for developing their products and access to markets to sell them. A lack of sufficient infrastructure is frequently cited as a barrier to mariculture development [3, 44, 45]. It is also possible that mariculture production is being developed more in countries that greatly depend on their capture fisheries but have experienced recent declines in their wild populations and need new ways to meet demand [46]. The positive relationship we have identified contributes to the broader discussion [30, 47] regarding the relationship between capture fisheries and mariculture, indicating that there are likely synergies between the two, though our findings do not elucidate any causal mechanisms.
Notably, the existence of freshwater aquaculture does not seem to influence whether a country has mariculture, contradicting our hypothesis that freshwater aquaculture operations can provide the necessary knowledge transfer and infrastructure synergies for a new mariculture sector. Rather, the presence of freshwater aquaculture is perhaps more indicative of the role of existing markets and domestic demand which can foster mariculture expansion once the industry is initiated. This appears to be especially true in developing countries with mariculture, as the export rate for farmed seafood is lower than that of wild capture seafood and farmed products remain largely within the domestic markets in these regions [48]. This finding could also have social implications for the mariculture industry. Froehlich et al [16] found that public perceptions of mariculture, particularly offshore operations, tended to be more negative than they were towards aquaculture more broadly. It is possible that having a freshwater aquaculture sector could provide the necessary example and information that would encourage greater familiarity with and trust of farmed aquatic products and thus lead to less opposition towards the expansion of mariculture operations [49].
Although other predictor variables had a larger influence on our results, we find that countries that are more developed tend to be associated with greater probabilities of producing mariculture as well as higher volumes of production. Developed countries often have stronger technological and industrial infrastructure and greater access to trade markets, which could provide enabling conditions for commercial-scale food production [50]. Further, increases in per capita income are associated with increased demand for animal protein, including seafood [51]. This increased demand in combination with the plateau in global capture fisheries yields, could be driving more developed countries towards establishing and expanding their mariculture operations.
One notable exception to the positive relationship between country-level development and mariculture was with algae mariculture. Development was not a significant predictor of whether a country produced algae, and there was a strong negative relationship between development and algae production volume. This outcome is consistent with the fact that 33 out of 40 countries with algae mariculture production are classified as developing or least developed and only two of the top twenty algae producers are developed countries (Japan and Russia) [11]. Algae production requires minimal inputs (e.g. no feed, little to no fertilizer, and no medicines) and does not necessitate intensive infrastructure or technology (as opposed to fish mariculture, for example), so marine algae farms are cheaper and easier to establish [52]. Additionally, the highest production potential for algae is found in developing regions [53]. There could also be political dynamics driving the algae industry in these areas. For example, governments and NGOs have promoted algal farming as a means of providing economic opportunities, supporting food security, and contributing to biofuel industries in developing African nations [54, 55].
Our study and analyses were limited by data availability. The variables we selected for inclusion were based on reviews of the literature but were also restricted to indicators available in comprehensive global datasets. This led to the exclusion of some variables that we had hypothesized as potentially important drivers. For example, we hypothesized subsidies to the mariculture industry would positively impact production, as they have been a strong influence on the expansion of the capture fisheries industry starting in the 1950s [56]. Additionally, strong tenure security can provide mariculture investors with the much needed assurance that they will be able to develop their operations and protect their investment [57] and has been shown to be a contributing factor to mariculture development in the Caribbean [15]. However, we did not include mariculture subsidies or tenure security in our final analyses as we were unable to identify globally inclusive datasets for either variable.
Even though we used global datasets, there were still substantial gaps in data availability, especially among small and developing countries, making our results biased towards larger and more developed regions. For example, only 11 out of 30 island nations and sovereignties in the Caribbean were represented in the final logistic regression sample. The Eastern Indo-Pacific also had several countries with data gaps, indicating these areas should be explored in more detail with region-specific data [e.g. 15]. We also acknowledge that our results are indicative of an association between the selected variables and mariculture production, not of causation, although this work provides a crucial foundation for future research assessing causality.
5. Conclusion
While our findings demonstrate that socioeconomic factors are significant drivers of the mariculture industry, these socioeconomic dynamics are often closely tied to governance mechanisms. As such, this work can guide strategic policy efforts in countries looking to start or expand their production. Given that driving factors seem to differ for whether a country produces any mariculture and how much it produces, countries looking to start and sustain commercial mariculture production will need to pursue long-term tactical approaches that account for both catalyzing and sustaining a mariculture industry. For example, countries can create policies and strategies that facilitate industry infrastructure development. Further, since it appears that the presence of freshwater aquaculture is related to growth of mariculture, governments seeking to expand mariculture production should consider initiatives to foster collaboration and synergies between these two sectors and/or provide incentives for freshwater operators to expand to the marine realm. Additionally, developing a marine spatial plan can support industry growth by identifying areas with suitable growing conditions, streamlining the permitting process for new operations, and providing greater regulatory certainty and transparency. The key indicators of production were quite similar across taxonomic groups, indicating that mariculture policies do not necessarily need to be tailored to a particular species or taxonomic group.
In addition to implications for policy, our findings contribute to a nascent literature on how mariculture develops and expands, offering a better understanding of an industry growing in both size and importance for global food security. Further, our work identifies potential pathways for future research, including hypotheses on the role of infrastructure, local demand, and knowledge transfer on mariculture development and industry growth. This study also expands our knowledge of the global food system more broadly. Considering how different food production industries respond to changes in socioeconomic conditions, as well as political and infrastructure dynamics, is critical to understanding how these industries will develop and how they will be able to collectively support the consumption needs of the growing global population.
Acknowledgments
The authors declare no competing interests. The authors would like to acknowledge financial support from the Waitt Foundation and the National Science Foundation (NSF Grant No. 1759559). The statements, findings, conclusions, and recommendations are those of the authors and do not necessarily reflect the views of our funders. The authors are grateful to their anonymous referees for their thoughtful comments on the manuscript.
Data availability statement
All data that support the findings of this study are included within the article (and any supplementary information files).
Supplementary data Experimental details including full setup information and measurements of the dimensions of the double slit.