

Abstract
Epidemiological studies have quantitatively linked adverse health outcomes, including stroke, to ambient temperature. However, such analyses cannot be applied to estimate disease burden attributable to climate change, because they assume a theoretical minimum risk reference based on an optimal temperature, which is a post hoc estimator that cannot be generalized to the unstudied locations. In this study, we used temperature anomaly (TA), an alternative indicator of climate change, in epidemiological studies to address this issue. We associated geo-coded nationwide stroke data (n = 11 144) from 2000 to 2016 in China to TA with a lag-distributed nonlinear model. For 0–2 lagged days, the risk of stroke increased by 20% (95% confidence interval [CI]: 3%–40%) for irregular cold and 19% (95% CI: 3%–37%) for irregular heat. The exposure-response function was estimated as a U-shaped curve centered at a TA value of 0. Based on the function, an estimated 3.42% of stroke cases were attributable to TA. In addition, there were more strokes attributable to heat (2.05%) than cold (1.38%). TA-attributable strokes due to climate change increased by 0.019% (95% CI: 0.008%–0.031%) per year. Furthermore, the long-term trend was dominated by the increase in events involving heat. In contrast to cold-attributable stroke, which potentially decreased by 0.004% (95% CI: −0.005%–0.013%) per year, the heat-attributable burden increased by 0.023% (95% CI: 0.012%–0.034%) per year. We also found that ischemic stroke was associated with cold (odds ratio [OR] = 1.18, 95% CI: 1.00–1.38), while hemorrhagic stroke was associated with heat (OR = 1.66, 1.07–2.58). Our findings are of importance to public health for climate change mitigation and for predictions of future effects in climate change scenarios.
Export citation and abstract BibTeX RIS

Original content from this work may be used under the terms of the Creative Commons Attribution 4.0 license. Any further distribution of this work must maintain attribution to the author(s) and the title of the work, journal citation and DOI.
This article was updated on 18 February 2021. The corresponding author details were updated.
1. Introduction
Anthropogenic emissions of greenhouse gas will result in climate change, which involves not only a higher mean temperature (Alexander and Perkins 2013) but also more occurrences of temperature anomaly (TA). Mean temperature has been widely utilized as an indicator to measure the health impacts of climate change. Specifically, in many time-series models, health risks attributable to both heat and cold weather above an optimal temperature have been quantified. Furthermore, they are used to explore the impacts of the long-term temperature trend. The optimal temperature is usually assumed to vary geographically and has to be estimated using city-specific models (Gasparrini et al 2015, 2017, Yang et al 2016). Therefore, such epidemiological findings are restricted to the studied areas, and cannot be utilized to develop risk assessments of climate change with completely spatial coverage, such as studies of the global burden of disease. Using TA instead of mean temperature can overcome this difficulty through assuming that individuals are adaptable to long-term variations in temperature. However, the association between TA and health rarely has been investigated.
Stroke is a leading cause of disease that harms global populations. In 2010, it contributed to 5.9 million deaths and the loss of 102 million disability-adjusted life years. Moreover, the incidence of stroke increased by 12% from 1990 to 2010 globally (Feigin et al 2014). In China, the prevalence of stroke is 2.06% in adults aged >40 years old. Moreover, the incidence of stroke rapidly increased by 8.3% from 2002 to 2013 (Guan et al 2017).
Comprehensively identifying risk factors for stroke is crucial to plan public health interventions. Conventional biological or behavioral contributors to the burden of stroke, such as hypertension (Guan et al 2017), have been studied thoroughly. Environmental risk factors that may trigger stroke are of public health importance because of the ubiquity of exposure among the general population. Researchers have suggested that outdoor temperature is associated with stroke mortality and morbidity worldwide (Wang et al 2003, 2016, Kyobutungi et al 2005, Lee et al 2008, Mostofsky et al 2013, Gomes et al 2015) and in China specifically (Liu et al 2004, Chen et al 2013, 2017, Yang et al 2016, Guo et al 2017, Luo et al 2018). Additionally, mechanistic studies also suggest that the temperature-stroke association is biologically plausible. Liu et al (2015) reviewed biological responses to extreme temperatures and suggested that cold enhances sympathetic activity and the renin-angiotensin system; both cold and heat can cause dehydration, and heat can induce a systemic inflammatory response. Both sympathetic activity and the renin-angiotensin system are associated with hypertensive responses and vascular function and thus can increase the risk of stroke (Everson et al 2001, Iadecola and Gorelick 2004). Studies have also linked dehydration with ischemic stroke (Swerdel et al 2017). Moreover, hot-mediated inflammation involves a multiorgan systemic reaction, including oxidative/nitrosative stress and systematic immune responses, which can impair vascular endothelial function and trigger stroke (Nawrot et al 2005).
Anthropogenic emissions of greenhouse gases are expected to increase mean temperatures and are contributing to temperature variability (Alexander and Perkins 2013). Studying the health impact of climate change depends on the comprehensive characterization of temperature–health associations, including the effective time windows of exposure, nonlinear (i.e. U-shaped) exposure-response curves, and susceptible subgroups. For example, Gasparrini et al (2015) found an association between total mortality and mean temperature on a global scale. Additionally, in a subsequent study, the same group predicted future mortality risk based on different scenarios of climate change (Gasparrini et al 2017). Considering that stroke is ranked among the top causes of mortality and disability worldwide, epidemiological studies that have investigated stroke risk associated with temperature also support policies aimed at mitigating global warming.
In China, stroke mortality is strongly associated with temperature on a national scale. Yang et al (2016) linked stroke mortality to mean temperature based on data from 16 cities and determined that the total deaths due to stroke were attributable to non-optimal temperatures (14.5%), particularly cold temperatures (13.1%). However, there is limited epidemiological evidence concerning the association between stroke incidence and TA, which may cause disability or death. Specifically, the overall map of stroke risk attributable to climate change in China is unclear.
Using a large national survey regarding stroke in China and a case-crossover design, the present study investigated the association between stroke/transient ischemic attack (TIA, also known as mini-stroke) occurrence and TA, and explored the susceptible subpopulations at risk for TA-associated stroke. In addition, we also briefly evaluated trends in TA-attributable stroke risk from 2000 to 2016 in China.
2. Materials and methods
2.1. Study population
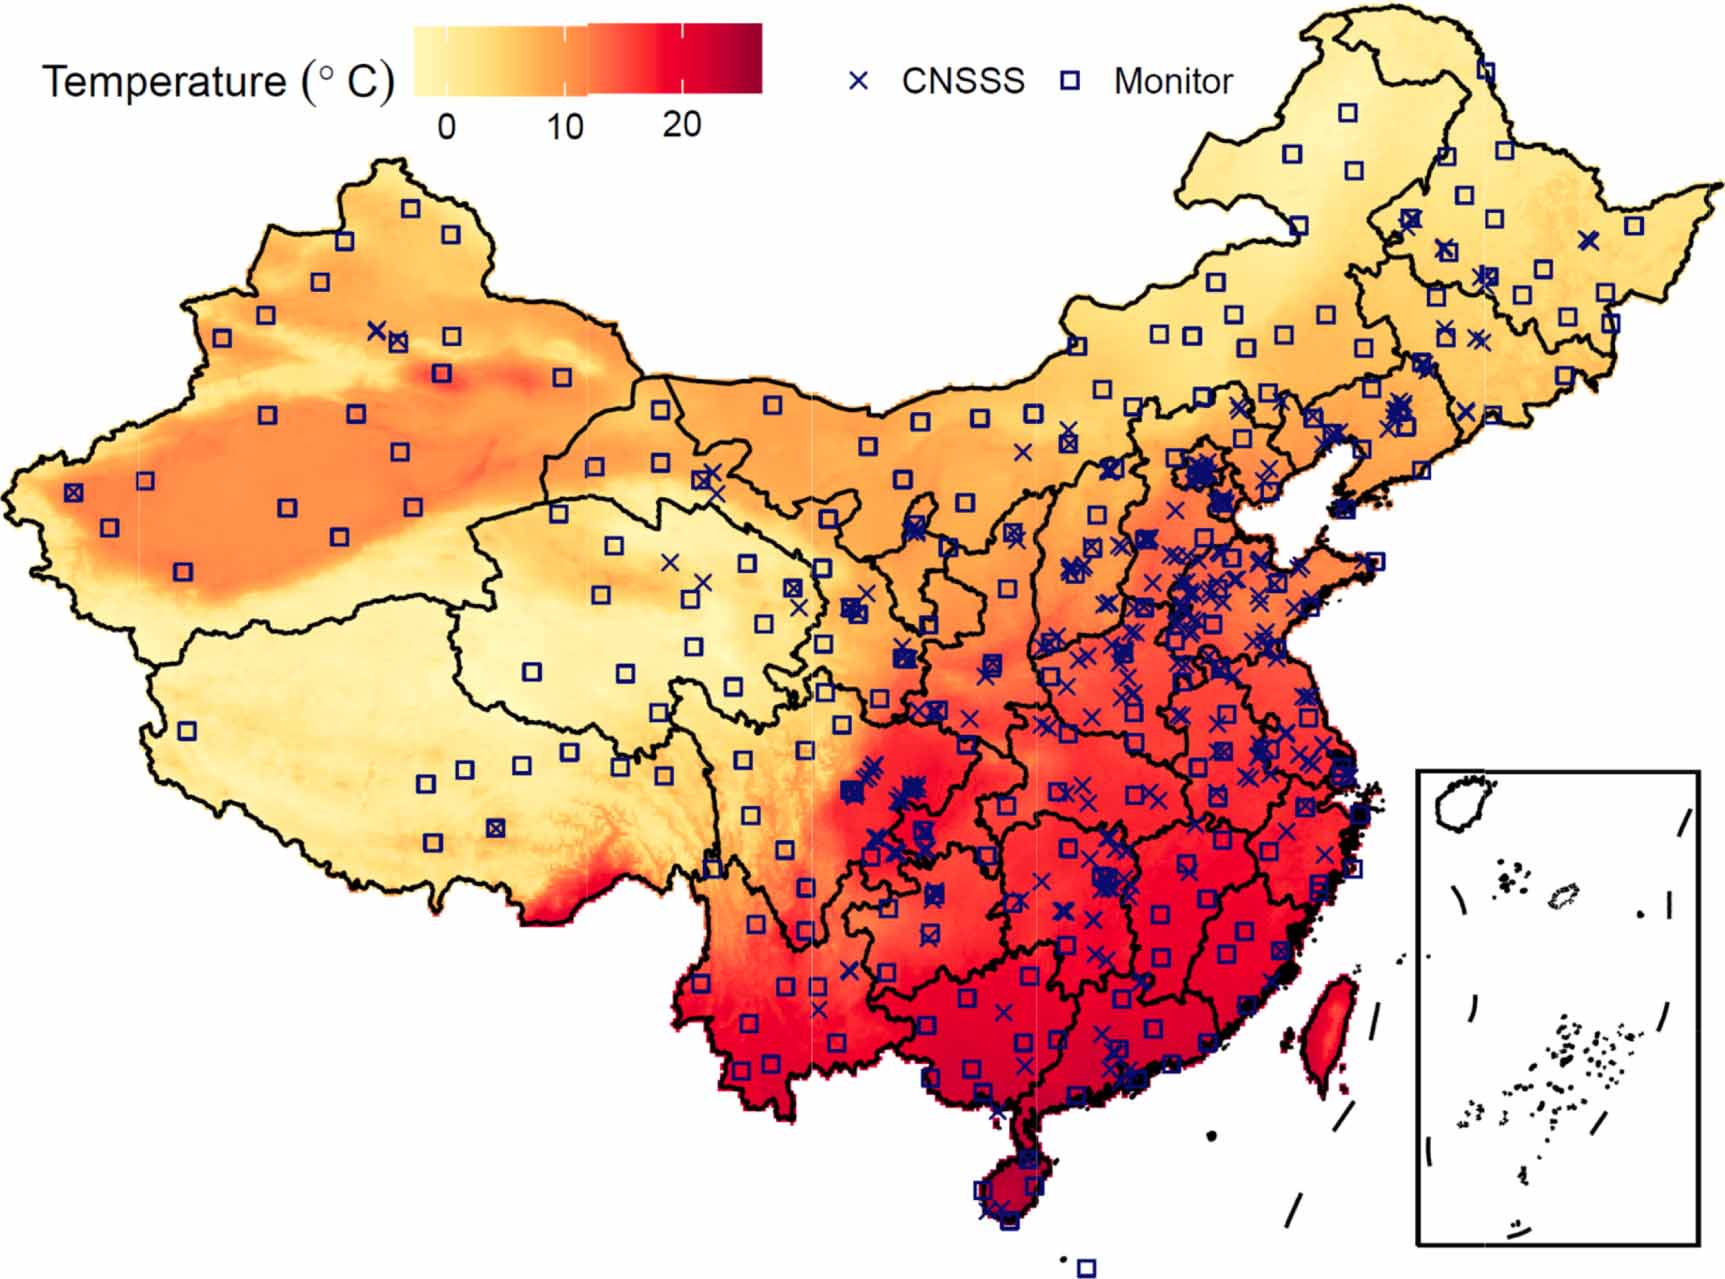
We obtained the complete records of 11 144 patients with a diagnosis of stroke or TIA after March 1, 2000 from the ongoing China National Stroke Screening Survey (CNSSS). This survey sampled ∼0.1% of Chinese adults >45 years of age from 339 communities (figure 1). Stroke and TIA cases were determined clinically using brain imaging. In the CNSSS, personal characteristics including urban residence, age, education, sex, consumption of fruits and vegetables, dietary intake of salt, smoking status, physical activity, hypertension, hyperlipidemia, diabetes, atrial fibrillation, and family history of stroke were collected using a questionnaire. The dates of diagnosis of the first and last occurrence of stroke or TIA were also documented. For more details concerning the CNSSS, please refer to Guan et al (2017) and Guan et al (2018).
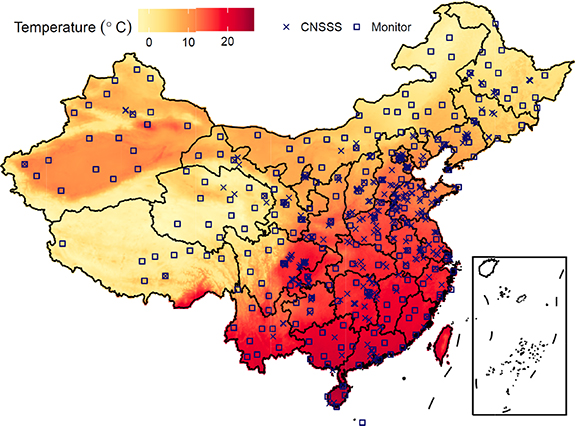
Figure 1. Average estimated temperatures in China, 2000–2016.
Download figure:
Standard image High-resolution image2.2. Temperature estimation and validation
Temperature data were obtained from a well-developed product (Xue et al 2019c), which assembled (1) in situ observations, (2) satellite remote sensing measurements and (3) weather research forecast (WRF) simulations. Monitoring data are usually considered to be the gold standard, but are limited in terms of spatial coverage. Numerical outputs of climate models (commonly known as weather forecasts) provide complete spatiotemporal coverage, but they are less accurate. As earth-observing satellites can scan the whole planetary surface within a 1 to 2 d period, their temperature products offer moderate coverage of spatiotemporal dimensions and have been utilized in health-related studies (Laaidi et al 2012). In a previous study, we combined the three types of measurements to produce an optimal predictor of daily temperatures (Toptimal ) with a spatial resolution of 0.1 degrees over China. According to the results of the ten-fold cross-validation analysis, we found that the Toptimal derived from data assimilation was in good agreement with the in-situ observation (correlation coefficient R2 = 0.96). The root-mean-squared error, a commonly-used statistical measure of modeling accuracy was reported to be 2.46 °C, which accounted for 19.4% of the standard deviation of temperature.
We also simulated daily maps of meteorological variables including temperature (Tw ), wind speed (WS), relative humidity (RH), surface pressure (SP), and planet boundary layer height (PBL) during the study period using the WRF model (ver. 3.5.1). The original resolution of the WRF simulations was 36 km × 36 km. For further details about the WRF model settings, please refer to our previous publications (Xue et al 2017, Zheng et al 2017).
2.3. Statistical analyses
Instead of directly linking stroke to the daily mean temperature, this study focused on TA, which measures how the daily temperature diverges from the long-term temperature trend. The spline-smoothing technique was used to calculate TA based on the following equation: Toptimal ,d = f(d) + TAd , where d denotes the index of the month and day and f(d) is a smoothening term for long-term daily temperature. TAd reflected the temperature perturbations, which were distinguished from regular or periodic variation in temperature. An example of TA derivation is shown in supplementary figure S2 (available online at https://stacks.iop.org/ERL/15/105014/mmedia). A TA > 0 or < 0 represents a warmer or cooler day, respectively, compared to the norm for that same month and day between 2000 and 2016.
The association between TA and the occurrence of stroke or TIA was determined using a case-crossover design by comparing exposure just before disease occurrence (defined as the hazard period) to that in other periods (defined as referent periods) for the same patient. Case-crossover study protocols have been widely used in the field of environmental epidemiology to determine the acute effects of air pollutants or temperature, and are advantageous due to their ability to control for constant population characteristics (e.g. age, medical history), which can be adjusted by the study design itself. In this study, the referents were bidirectionally selected as the two time-points, which were seven days apart from the hazard period (Bateson and Schwartz 2001), to further adjust for long-term trends, seasonal patterns, or weekly variation. As a case-crossover study compares exposures at different time-points during a short-term period (e.g. one or two weeks) for each individual, it actually links acute changes in exposures (e.g. temperature perturbations) to a health outcome and thus can control for long-term trends (e.g. inter-decadal and inter-annual variations). Next, a health outcome (i.e. TIA, stroke, ischemic stroke, or hemorrhagic stroke) was linked to the distributed-lag nonlinear terms of climate variables (i.e. TA, RH, WS, SP, and PBL) using conditional logistic regression. The technique of distributed lag non‐linear models (DLNM) characterizes both the lag-structure and nonlinear associations of the health impacts of temperature or other environmental variables (Gasparrini et al 2010). In this study, we modeled the effects of TA within a lagged period of 0–21 d and used B-spline functions with three degrees of freedom to estimate both lag-structure and nonlinear curvature for all climate variables, as was done in previous studies (Gasparrini et al 2015, Yang et al 2016). We calculated the OR for a single lag or the cumulative OR during a lagged period to evaluate the effects of TA on stroke or TIA.
In the sensitivity analyses, we first explored the modifications of the association between stroke and TA by population characteristics (e.g. sex) or a regional indicator. The differences between the TA effects of two subgroups (e.g. male vs. female) were examined using the Wald test. Second, to explore whether the association estimates were sensitive to adjusting for air pollution, we further incorporated a product of historical PM2.5 concentrations (with a spatial resolution of 0.1° × 0.1° and a temporal coverage from Jan. 1, 2000 to Dec. 31, 2016) into the above DLNM model. In previous studies, we found that stroke was strongly associated with PM2.5 (Guan et al 2018) but weakly associated with O3 (Xue et al 2019a). Therefore, PM2.5 was selected as a key indicator of the potentially confounding effect of air pollution. However, estimating the historical PM2.5 concentrations depends on inputting climate variables (e.g. temperature). We did not rely on PM2.5-adjusted regression as the main model to avoid overlapping information. Additional details on the PM2.5 dataset are documented in the supplemental text and our previous publication (Xue et al 2019b). Third, we also examined whether the association estimates were sensitive to different approaches of temperature exposure assessment. Among our three temperature datasets (i.e. WRF simulates, satellite and in situ observations), the WRF data were also eligible for the epidemiological purpose, due to their complete coverage in spatiotemporal dimensions. Therefore, we generated an alternative DLNM model by replacing the assembled temperature with the simulated WRF data.
In addition, we also quantified the AF of TA-associated stroke in each pixel of the 0.1° × 0.1° grid for each date during the 2000–2016 period based on the following equation: AFt = 1–1/(Πi=0 L RRt−i ), where t denotes the date index, i is the lagged time, AFt is the TA-attributable fraction of stroke risk at time t, and RRt−i is the relative risk (RR) of TA on lag day i. Assuming the rareness of strokes, RR can be approximated using the OR, which is the estimated association between TA and stroke.
All statistical analyses were performed using R (version 3.4.1). Inverse-distance weighted averages and UK analyses were performed using R package, gstat (Pebesma 2004). DLNM was constructed using the dlnm package (Gasparrini 2011), and the inference of the conditional logistical regression was performed with the survival package (Therneau 2015).
3. Results
3.1. Description
The map of the long-term mean temperature is visualized in figure 1, which displays the spatial variation in temperature with latitude (increasing from north to south), altitude (lower in the Tibet Plateau), and land cover (higher in the deserted area of Northwest China). The population-weighted average of Toptimal and absolute value of TA were 15.41 °C and 2.49 °C, respectively, in China.
The population characteristics of the patients included in this study are shown in table 1. A subset of the subjects had multiple strokes or TIAs. Among the 11 144 patients, there were 13 873 events of stroke or TIA. Among the 6719 stroke events, 88% (N = 5915) were diagnosed as ischemic stroke and the rest were hemorrhagic stroke. The summary statistics of the environmental variables for the surveyed communities are presented in table 2.
Table 1. Characteristics of the surveyed patients.
| Stroke | Transient Ischemic Attack | |
|---|---|---|
| Community number | 293 | 276 |
| Patient number | 6104 | 6052 |
| Total number of event (N) | 6719 | 7154 |
| By region (N) | ||
| Central | 736 | 604 |
| East | 2019 | 1595 |
| North | 2836 | 2664 |
| West | 1128 | 2291 |
| By sub-group (N) | ||
| First occurrence | 5991 | 5819 |
| Age over 60 years | 3409 | 3262 |
| Urban residence | 2627 | 3076 |
| Male | 3452 | 2736 |
| Education attainment above high school | 754 | 923 |
| Overweight or obese | 3247 | 2997 |
| Low vegetable and fruit consumption | 4352 | 4632 |
| Over-salt diet | 3499 | 3922 |
| Smoking | 1758 | 1422 |
| Alcohol drinking | 1021 | 970 |
| Physical inactivity | 2274 | 2886 |
| Hypertension | 4897 | 4061 |
| Hyperlipidemia | 2340 | 2414 |
| Diabetes | 1307 | 1027 |
| Atrial fibrillation | 626 | 1015 |
| Family history of stroke | 1955 | 1984 |
Table 2. Summary statistics of climate variables for the CNSSS communities from February 24, 2000 to December 31, 2016.
| Percentile | |||||||||
|---|---|---|---|---|---|---|---|---|---|
| Variable | Mean | SDb | 1% | 10% | 25% | 50% | 75% | 90% | 99% |
| Temperature (°C) | 14.03 | 11.24 | −16.77 | −1.6 | 6.36 | 16.02 | 23.22 | 27.11 | 30.64 |
| Temperature anomaly (°C) | 2.52a | 3.26 | −8.37 | −4.09 | −1.97 | 0.08 | 2.06 | 3.96 | 7.80 |
| Relative humidity (%) | 71.34 | 17.87 | 25.17 | 44.53 | 59.87 | 75.01 | 85.69 | 91.7 | 97.17 |
| Wind speed (m/s) | 2.47 | 0.94 | 0.94 | 1.43 | 1.81 | 2.32 | 2.96 | 3.7 | 5.43 |
| Planetary boundary layer (m) | 530.97 | 247.42 | 134.56 | 270.77 | 365.7 | 482.92 | 641.81 | 855.77 | 1351.64 |
| Surface pressure (bar) | 0.97 | 0.06 | 0.72 | 0.88 | 0.96 | 0.99 | 1.01 | 1.02 | 1.03 |
3.2. Associations
The associations between TA and stroke events are presented in figure 2. According to the lag-structure estimated by DLNM (figure S3), the effective exposure of TA occurred within 2 d of the diagnosis date of stroke or TIA. Therefore, figure 2 focuses on the associations on days 0–2, and generally displays a U-shaped curve centered at a TA of 0, particularly for the lag 0–2 cumulative effects on stroke. The U-shape of the curve suggests that a temperature change of either heat (defined as a positive TA) or cold (defined as a negative TA) may increase the risk of stroke. In addition, the valley value of zero suggests that normal temperatures can minimize risk. We also found that the association estimates were not sensitive to externally controlling for air pollution or using an alternative dataset of temperature (figure S4).
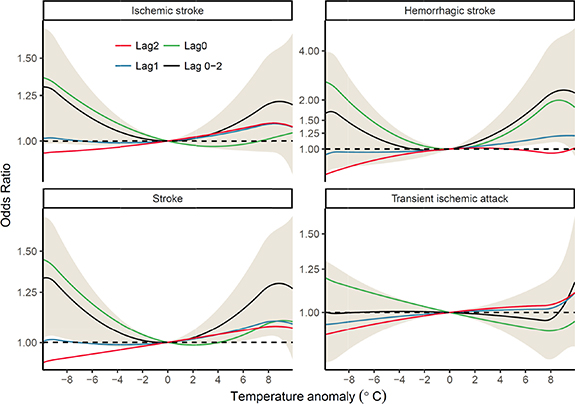
Figure 2. Associations between temperature anomalies and occurrence of transient ischemic attack, stroke, ischemic stroke, and hemorrhagic stroke over lags of 0–3 d in China.
Download figure:
Standard image High-resolution imageTo quantify the nonlinear effects of temperature, we calculated the ORs for the TA gaps as follows: the 99th percentile (7.80 °C) relative to the 90th percentile (3.96 °C), the 90th percentile relative to the 75th percentile (2.06 °C), the 1st percentile (−8.37 °C) relative to the 10th percentile (−4.09 °C), and the 10th percentile relative to the 25th percentile (−1.97 °C) for extreme heat, moderate heat, extreme cold, and moderate cold, respectively. The ORs of the effects of hot/cold temperatures on stroke of different lags are presented in table 3. In terms of the cumulative effect during a lag of 0–2 d, the risk of stroke was significantly increased by 20% (95% CI: 3%–40%), 19% (3%–37%), 4% (0%–9%), and 5% (0%–10%) for extreme cold, extreme hot, moderate cold, and moderate hot, respectively. Ischemic stroke was significantly associated with extreme cold (OR = 1.18, 95% CI 1.00–1.38) only, while hemorrhagic stroke was significantly associated with moderate heat (OR = 1.17, 95% CI 1.02–1.35) and extreme heat (OR = 1.66, 95% CI: 1.07–2.58). There were no significant associations between TIA and TA, except for weak effects of moderate cold at lag 0 d (OR = 1.03, 95%CI: 1.00–1.07). According to these results, TA is strongly associated with stroke, but only weakly linked to TIA. Therefore, subsequent investigations were focused on stroke only.
Table 3. Odd ratios of the effects of moderate or extreme cold/hot on stroke occurrence in China.
| Odd Ratios | |||||
|---|---|---|---|---|---|
| Outcome | Lag | P1 relative to P10 | P10 relative to P25 | P90 relative to P75 | P99 relative to P90 |
| Stroke | 0 | 1.23 (1.09, 1.38) | 1.06 (1.03, 1.10) | 1.01 (0.98, 1.05) | 1.09 (0.97, 1.21) |
| 1 | 1.02 (0.95, 1.09) | 1.00 (0.98, 1.02) | 1.02 (1.00, 1.04) | 1.06 (1.00, 1.12) | |
| 2 | 0.96 (0.90, 1.03) | 0.98 (0.96, 1.00) | 1.02 (1.00, 1.04) | 1.03 (0.97, 1.10) | |
| 0–2 | 1.20 (1.03, 1.40) | 1.04 (1.00, 1.09) | 1.05 (1.00, 1.10) | 1.19 (1.03, 1.37) | |
| Ischemic Stroke | 0 | 1.18 (1.04, 1.34) | 1.06 (1.02, 1.10) | 1.00 (0.96, 1.03) | 1.03 (0.92, 1.16) |
| 1 | 1.02 (0.95, 1.09) | 1.00 (0.98, 1.02) | 1.02 (1.00, 1.04) | 1.05 (0.99, 1.12) | |
| 2 | 0.98 (0.91, 1.05) | 0.99 (0.96, 1.01) | 1.02 (1.00, 1.04) | 1.05 (0.98, 1.12) | |
| 0–2 | 1.18 (1.00, 1.38) | 1.04 (0.99, 1.09) | 1.03 (0.99, 1.09) | 1.14 (0.98, 1.32) | |
| Hemorrhagic Stroke | 0 | 1.76 (1.22, 2.54) | 1.14 (1.03, 1.27) | 1.13 (1.02, 1.26) | 1.60 (1.15, 2.24) |
| 1 | 1.00 (0.81, 1.23) | 0.98 (0.93, 1.04) | 1.04 (0.98, 1.10) | 1.10 (0.92, 1.33) | |
| 2 | 0.83 (0.66, 1.04) | 0.95 (0.89, 1.01) | 0.99 (0.93, 1.06) | 0.94 (0.77, 1.15) | |
| 0–2 | 1.46 (0.90, 2.39) | 1.06 (0.93, 1.22) | 1.17 (1.02, 1.35) | 1.66 (1.07, 2.58) | |
| Transient Ischemic Attack | 0 | 1.08 (0.97, 1.21) | 1.03 (1.00, 1.07) | 0.98 (0.94, 1.01) | 0.96 (0.86, 1.06) |
| 1 | 0.97 (0.91, 1.03) | 0.99 (0.97, 1.01) | 1.00 (0.99, 1.02) | 1.01 (0.95, 1.06) | |
| 2 | 0.95 (0.89, 1.01) | 0.98 (0.96, 1.00) | 1.01 (0.99, 1.03) | 1.01 (0.95, 1.08) | |
| 0–2 | 0.99 (0.86, 1.15) | 1.00 (0.96, 1.04) | 0.99 (0.95, 1.03) | 0.98 (0.86, 1.12) | |
3.3. Effect modification
To identify the subjects who were most susceptible to TA-associated stroke, we developed regression models according to separate subpopulations. The detailed results are documented in supplemental table S1, and an example is presented in figure 3. We found that the lag-structure and nonlinear curvature of the TA–stroke association differed slightly according to various individual-level characteristics; however, the modifying effects of the majority of these characteristics were not statistically significant due to uncertainty. In terms of the cumulative effect on stroke with a lag of 0–2 d, the effects of extreme cold were most strongly linked to patients who attained an education above high school compared to the rest of the patients (OR = 2.06, 95% CI 1.24–3.41 vs. OR = 1.18, 95% CI 0.97–1.44). Moreover, the association between moderate cold and stroke risk was higher in the physically active group (OR = 1.08, 95% CI: 1.03–1.14 vs. OR = 0.98, 95% CI: 0.91–1.06). Heat was a stronger risk factor for stroke in those with recurrent stroke (extreme-heat OR = 2.00, 95% CI: 1.25–3.20; moderate-heat OR = 1.24, 95% CI 1.07–1.44) compared to patients who only experienced one stroke (extreme-heat OR = 1.12, 95% CI 0.96–1.30; moderate-heat OR = 1.03, 95% CI: 0.98–1.08).

Figure 3. Associations between first stroke or recurrent stroke and temperature anomalies during lags of 0–2 d in different regions.
Download figure:
Standard image High-resolution imageWe also estimated the association between TA and stroke according to the four regions of China (supplementary figure S5). The detailed results are shown in supplementary table S2. The association between stroke and TA was stronger in the north and west than in the east and central regions of China. Indeed, the cumulative exposure to extreme cold increased the risk of stroke by −27% (95% CI: −59%–30%), −18% (95% CI: −41%–13%), 43% (95% CI: 14%–80%), and 66% (95% CI: 12%–147%) in the central, east, north, and west regions, respectively. Moreover, the cumulative exposure to extreme heat increased the risk of stroke by −27% (95% CI: −56%–23%), −21% (95% CI: 40%–6%), 46% (95% CI: 19%–81%), and 43% (95% CI: −2%–109%) in these regions, respectively. This geographic variation reflects the complexity and heterogeneity of the association between TA and stroke.
3.4. Burden of TA-associated stroke
To further quantify the association between TA and stroke, we calculated gridded AF across the 0.1° × 0.1° map, according to the nation-level exposure-response curve (figure 2). In terms of the population-weighted average, the mean AFs were 2.05%, 1.38%, and 3.42% for hot temperature, cold temperature, and total TA, respectively. The spatial and temporal patterns of the mean AF are presented in figure 4. TA contributed the largest proportion (>4.5%) of stroke risk in the northeast plain (the provinces of Jilin, Heilongjiang, and Liaoning). The spatial pattern of heat- and cold-attributed risk was similar. According to the temporal trend, AFs for heat and AT significantly increased by 0.023% (95% CI: 0.012%–0.034%) and 0.019% (95% CI: 0.008%–0.031%) per year, respectively, whereas the AF for cold temperatures slightly decreased by 0.004% (95% CI: −0.005%–0.013%) of the national average. The trends in AF were consistent with the temporal and spatial variations. In terms of the population-weighted average, the absolute value of TA, positive TA, and negative TA increased by 0.0071 °C (95% CI: 0.0023–0.0120), 0.0113 °C (95% CI: 0.0059–0.0167), and −0.0042 °C (95% CI: −0.0098–0.00143) per year, respectively, between 2000 and 2016. The spatial distribution of TA is presented in figure S1. The above analyses suggest that, compared to cold, heat contributed more to the burden of stroke and dominated the slowly, but significantly increasing trend of TA-associated stroke in China.

Figure 4. The spatiotemporal trend of temperature-anomaly-attributable risk for stroke in China, 2000–2016. (a) Long-term mean of the attributed fraction (AF). (b) Monthly population-weighted average AF from 2000–2016.
Download figure:
Standard image High-resolution image
4. Discussion
The current study presents nationwide data on stroke occurrence and TA in China. We found a U-shaped and zero-centered curve between stroke occurrence and TA, which indicates that abnormal temperature (including both hot and cold fluctuations) could increase the risk for stroke. Based on our estimates, we determined that TA may have contributed 3.42% of the stroke incidence in China during the time period studied. The TA-attributed burden of stroke increased by 0.02% per year from 2000 to 2016, which may be related to climate change, particularly in regard to increased heat events.
4.1. Previous findings on temperature-stroke associations
The association between temperature and stroke has been well studied globally. In China, stroke mortality has been linked to temperature on both a national (Yang et al 2016) and a local scale (Zhou et al 2017), but studies focusing on stroke morbidity have been limited to the regional level (Liu et al 2004, Wang et al 2013, Chen et al 2017, Guo et al 2017, Luo et al 2018). Luo et al (2018) reported that cold rather than hot temperatures are significantly linked to both ischemic and hemorrhagic stroke admissions in Beijing. Similarly, Guo et al (2017) explored temperature and more specific classifications of stroke subtypes in Guangzhou and reported that cold temperatures were significantly associated with cerebral infarction and intracerebral hemorrhage only. Furthermore, Wang et al (2013) identified cold temperature as a risk factor for ischemic stroke in Jinan, but suggested that heat was protective. In contrast, a case-crossover study in Nanchang indicated that hot temperatures might be a risk factor for both hemorrhagic and ischemic strokes, and cold temperatures might be a risk factor for hemorrhagic stroke only (Chen et al 2017). Although the general association between stroke and temperature has been identified across China, detailed findings from local studies are mixed, which may be a result of differences in populations, study designs, interpretation of hot/cold temperatures, selection of exposure time-windows, and other aspects. In the current nationwide study, ischemic stroke was significantly associated with extreme or moderate cold at lag 0 d (OR = 1.18, 95% CI 1.04–1.34 and OR = 1.06, 95% CI 1.02–1.10, respectively) and with moderate heat at lag 1 or lag 2 d (OR = 1.02, 95% CI 1.00–1.04). Moreover, hemorrhagic stroke was significantly associated with extreme cold, moderate cold, extreme heat, and moderate heat at lag 0 d (OR = 1.76, 95% CI: 1.22–2.54, OR = 1.14, 95% CI: 1.03–1.27, OR = 1.60, 95% CI: 1.15–2.24, and OR = 1.13, 95% CI: 1.02–1.26, respectively). Our findings are generally in agreement with previous evidence relating to the geographic and subpopulation variation in temperature–stroke associations in China (tables S1 and S2).
4.2. Strengths of applying TA in exposure assessment
The association estimates in our study differed from others, because we used TA instead of temperature to assess environmental exposure. We assumed that a divergence from the regular variation in temperature rather than regular variation in temperature (i.e. periodic variation by season) would contribute to increased risk of stroke. Although regular seasonal variation in temperature may also be linked to stroke, such periodic patterns are not caused by human-induced climate change. For example, Guo et al (2017) defined cold temperature as a value below the median temperature in Guangzhou (23.4 °C) and concluded that the proportion of cerebral infarction and intracerebral hemorrhage cases attributed to cold were 9.06% and 15.09%, respectively. In other words, 9.06% of cerebral infarctions and 15.09% of intracerebral hemorrhages could have been eliminated if temperatures had been always >23.4 °C. However, outdoor temperatures in Guangzhou fluctuate below 23.4 °C, particularly in the winter, which means that the proportion of the modifiable burden of cerebral infarction or intracerebral hemorrhage cases is smaller than the reported AF in the long term. Instead of assuming a constant reference temperature (e.g. the median), we set the regularly varied temperature as a dynamic reference, so that our AF estimates were closer to the modifiable burden of temperature-associated stroke. The different assessment of temperature exposure in this study also explains why our estimates of TA-attributable stroke (3.42%) were smaller than those of previous studies such as Yang et al (2016), who reported a temperature-associated stroke mortality of 14.5% in China.
4.3. Inter-individual variations in the temperature-stroke association
Another explanation for the inconsistent temperature-stroke associations is the inter-individually varied susceptibilities, which may further lead to variance among different subpopulations. For instance, Guo et al (2017) reported that elderly individuals were more vulnerable to cold temperatures than younger individuals in Guangzhou, whereas Luo et al (2018) reported the opposite results in Beijing. Here, we found slightly higher ORs in association with both cold and hot temperatures in adults ≤60 years old compared to adults >60 years old. However, it is worth noting that a larger OR does not always signify increased vulnerability. Because case-crossover and time-series studies employ RR rather than absolute risk, effect modifications should be interpreted with caution. The incidence of stroke increases with age. Given the countervailing effects of a lower OR associated with temperature and a higher baseline incidence among the elderly than the young, it is unreliable to conclude that aging enhances or weakens the effects of heat/cold events without further exploration. In this study, analogous findings also included effect modifications of a lower level of education, a rural residence, a family history of stroke, and physical inactivity. Because of the complexity of effect modifiers, we are only able to conclude that patients who have already had a stroke are more vulnerable to abnormal variations in temperature compared to the rest of the population.
4.4. Trends of temperature-attributed stroke
Trends in TA-attributed risk of stroke had not been thoroughly investigated in China prior to this study. From 2000–2016, the burden of stroke increased by 0.02% per year. Gasparrini et al (2017) predicted global temperature-attributable total mortality (due to climate change), and reported a 1.5% increase in mortality during 2010–2090 (∼0.02% per year) in China under the highest emissions scenario. The projected increase was driven by a heat-related increase of 5.1% and a cold-related decrease of 3.7%. The projected trend of health impacts associated with climate change was comparable to the historical trend estimated in this study. Two studies have indicated that heat-related risks dominate the health impact of climate change in China, which may influence emissions-reduction policies. However, the risk assessment is preliminary and limited due to a lack of available data. Indeed, we had to assume a constant baseline risk in the spatiotemporal dimension due to a lack of historical data on the spatial distribution of stroke incidence. Moreover, we did not consider demographic dynamics, such as population aging, during the study period. We also ignored the effects of different susceptibilities and geographic variations on the TA–stroke association, and did not include human adaptation to the changing climate in our risk assessment. Finally, we did not estimate or simulate the CIs for AF, because of the massive computing burden of nationwide analyses. More elaborate assessments of TA-triggered stroke in China are beyond the scope of this study, and will be conducted in future studies.
4.5. Limitations
This epidemiological study on stroke risk and TA is also limited in the following aspects. First, although the patients were selected from a national survey, sampling bias could not be completely avoided. Because of heterogeneity in TA-stroke associations among different subpopulations, the surveyed cases may not have been representative of the whole population, which may have influenced the estimated effect at the population level. Second, temperature data were estimated using a data assimilation approach, which may have introduced exposure misclassification. Although there was evidence that the estimates were highly correlated with in situ observations, we were unable to completely eliminate errors in the exposure assessment. Third, due to the limited temporal resolution of the temperature data, we could not examine the acute effects of temperature on an hourly scale or other temperature metrics such as daily maximum or minimum. Finally, although meteorological covariates (e.g. RH, WS, SP, and PBL) that could co-vary with temperature and confound its effect on stroke were accounted for, other potential confounders may have been missed due to a lack of historical data. For example, air pollutants can be co-varied with temperature and some of them (e.g. PM2.5) have been found to be as risk factors for stroke (Guan et al 2018). Although our results were not considerably changed by controlling for ambient PM2.5, we could not further examine other species of air pollution, such as ozone and nitrogen dioxide, due to the lack of monitoring data before 2013. Ignoring such variables may have biased our results.
5. Conclusion
This nationwide study performed in China found an association between TA and the occurrence of stroke, including ischemic and hemorrhagic stroke. Irregular variations in temperature, including both hot and cold temperature changes contributed to 3.42% of stroke cases. In addition, due to climate change, TA-attributed percentage of stroke increased by 0.02% per year between 2000 and 2016. The long-term trend was predominated by increased occurrences of heat. Moreover, patients with prediagnosed strokes were more vulnerable to both cold and hot temperatures. Our findings are of importance for public health for stroke prevention and the mitigation of climate change in China.
Acknowledgments
We thank China Stroke Data Center (CSDC), National Health Commission of China for the support of the survey data in this manuscript. This work was supported by National Natural Science Foundation of China (Grant Nos. 81571130100 and 41701591), Ministry of Science and Technology of China (Grant No. 2015CB553401) and Medicine and Health Sciences and Technology Innovation Project, Chinese Academy of Medical Sciences, China (Grant No. 2017-I2M-1-004).
Data availability statement
The data that support the findings of this study are available upon reasonable request from the authors.
Conflict of interest
The authors declare no conflicts of interest.