

Abstract
To date, COVID-19 has claimed more than 100 000 American lives. Early inquiry suggests preexisting conditions are key risk factors contributing to COVID-19 mortality and air pollution exposure could exacerbate this relationship. Building on prior research linking deaths from respiratory viruses to air pollution exposures, we investigate how 2014 National Air Toxics Assessment hazardous air pollutants (HAPs) respiratory hazard quotient and respiratory hazard index are related to COVID-19 mortality. Our focus on HAPs builds upon the knowledge base linking poor air quality to COVID-19 mortality, since most (if not all) earlier studies only include criteria pollutants. Herein, we examine the relationship between HAP exposure and US-based COVID-19 mortality, while controlling for socioeconomic status, population health indicators, and exposure to PM2.5 and ozone. We fit county-level negative binomial mixed models, predicting COVID-19 mortality as a function of HAP respiratory toxicity levels and relevant covariates. We include models for combined exposure to HAPs, as well as for specific pollutants. We find that an increase in the respiratory hazard index is associated with a 9% increase in COVID-19 mortality. Although differing in magnitude, this association holds for individual HAPs acetaldehyde, and diesel PM. These findings help us to understand variation in US-based COVID-19 mortality rates, reinforce existing research linking air pollution to mortality, and emphasize the importance of regulatory efforts to limit air pollution exposure risk.
Export citation and abstract BibTeX RIS

Original content from this work may be used under the terms of the Creative Commons Attribution 4.0 license. Any further distribution of this work must maintain attribution to the author(s) and the title of the work, journal citation and DOI.
1. Introduction
In December of 2019, a novel coronavirus disease (COVID-19) appeared in Wuhan, China (Martelletti and Martelletti 2020). Since then, COVID-19 has become a global pandemic, and as of July 18, 2020, the World Health Organization has estimated that there are over 13 million COVID-19 cases worldwide and almost 600 000 deaths attributed to this disease. Public health professionals are urgently tasked with understanding and combating this disease, as well as assessing which populations might be more at-risk in contracting and succumbing to it.
While data are still emergent, early evidence suggests that long-term exposure to air pollution might constitute a major risk factor increasing the likelihood of severe outcomes from COVID-19 (Comunian et al 2020, Conticini et al 2020; Fattorini and Regoli 2020, Hendryx and Luo 2020, Ogen 2020, Wu et al 2020, Zhu et al 2020). These researchers build upon a study demonstrating a positive association between air pollution concentrations and mortality rate caused by severe acute respiratory syndrome (SARS), a closely related coronavirus, during a 2000 outbreak in China (Cui et al 2003). Research suggests that air pollutants may influence COVID-19 severity directly, by damaging the cilia and thus impacting the capacity of the lungs to expel pathogens (Brandt et al 2020, Conticini et al 2020), as well as indirectly, by aggravating pre-existing cardiovascular and respiratory conditions (Brandt et al 2020, Comunian et al 2020, Conticini et al 2020, Fattorini and Regoli 2020).
While prior work has focused mainly on measuring associations between COVID-19 mortality and population-based exposures to nitrogen dioxide (Conticini et al 2020, Fattorini and Regoli 2020, Ogen 2020, Zhu et al 2020), ozone (Fattorini and Regoli 2020, Zhu et al 2020), and particulate matter (Cole et al 2020, Comunian et al 2020; Hendryx and Luo 2020, Wu et al 2020), limited and preliminary work (Devara et al 2020, Pansini 2020) has been done to assess whether long-term exposures to hazardous air pollutants (HAPs) are also associated with increased risk of mortality from COVID-19. HAPs, also known as air toxics, include both volatile organic compounds and metals (EPA 2020b), and this unique group of pollutants have also been linked to an increased risk of respiratory and immune conditions (EPA 2020; Suh 2000). Therefore, our main study objective is to understand the relationship between exposure to elevated HAPs and COVID-19 mortality in the US. Unlike criteria air pollutants, which have been the focus of high-profile recent studies, HAPs are a less studied group of pollutants, but include a wide array of known toxics such as volatile organic chemicals, metals, pesticides, etc. We hypothesize that HAPs exposure could contribute to COVID-19 vulnerability because they are linked to chronic respiratory stress. Finally, the basis for HAP regulatory decision making relies on documented potential human health effects, so inquiry into COVID-19 mortality relationships are relevant. We fit multiple hierarchical statistical models, relating cumulative HAP exposure to COVID-19 mortality, while controlling for individual pollutants and other known risk factors. Results from this study add to emerging literature on links between air quality and increased risk of COVID-19 mortality.
2. Methods
For this study, we use a socio-environmental synthesis approach, publicly available data, and regression modeling (supplementary table 1 available online at stacks.iop.org/ERL/15/0940a9/mmedia). Our outcome variable is county-level COVID-19 mortality, obtained from The New York Times. These data are based on reports from state and local health agencies as of May 13, 2020 (NYT 2020).
HAP respiratory hazard index (HI) and respiratory hazard quotient (HQ) values were obtained from EPA National Air Toxics Assessment (NATA) for the year 2014 (EPA 2018). NATA is a HAP emissions population risk screening tool which estimates ambient concentrations of 187 HAPs released from point, nonpoint, and natural sources, as well as HAPs arising from secondary formation in the atmosphere. The HQ (for single pollutants) and HI (for multiple pollutants) represent the ratio of modeled yearly average ambient concentration to the concentration (known as the respiratory reference concentration or RfC) at which a negative respiratory health outcome is expected to be observed (See table 1). The respiratory HQ values for specific pollutants are summed to create the HAP respiratory HI. For example, in Onondaga County, New York, the 2014 NATA Respiratory HI metric (0.22) component chemicals include the summation of respiratory HQs for acetaldehyde (0.08), acrolein (0.03), formaldehyde (0.08), diesel PM (0.02), bromomethane (0.006), naphthalene (0.005), and all others (0.008). In 2014, US county-based average HI values ranged from 1.16 in Marshall County, Kentucky to 0.06 in Denali County, Alaska with a mean value for all US Counties of 0.44. Cumulative risk assessment approaches, such as NATA, help assess potential health effects of chemical mixtures. When applied to HAPs, such cumulative approaches provide stronger evidence linking exposures and adverse health effects (Jacquez and Greiling 2003, Stingone et al 2017, Sheth et al 2019).
Table 1. Top five hazardous air pollutants by average US respiratory hazard quotient (HQ).
| Hazardous air pollutant | Health effects | Reference concentration (RfC) (µg m−3 ) | US County average modelled annual concentration (µg m−3) (County range) | US County average HQ (County range) |
|---|---|---|---|---|
| Acrolein | Potent respiratory and ocular irritant (Bein and Leikauf 2011). Has been associated with cardiovascular/respiratory diseases and risk factors. (Henning et al 2017; Perez et al 2015) | 0.035 | 0 (0, 0.01) | 0.06 (0, 0.35) |
| Acetaldehyde | Eye and respiratory tract irritant. At higher concentrations, can cause damage to respiratory and cardiovascular systems in humans (Delikhoon et al 2018; Morris 1997). | 9 | 1.07 (0.2, 2.62) | 0.12 (0.02, 0.29) |
| Formaldehyde | Linked to eye irritation, dry and/or sore throats, inflammation, bronchial asthma-like symptoms, childhood asthma, and upper respiratory tract infections (Delikhoon et al 2018) | 9.8 | 1.25 (0.11, 2.64) | 0.13 (0.01, 0.27) |
| Diesel Particulate Matter | Consistently linked with respiratory and cardiovascular health effects (Mirowsky et al 2015; Steerenberg et al 1998; Tang et al 2012; Totlandsdal et al 2010) | 5 | 0.11 (0, 1.12) | 0.02 (0, 0.22) |
| Naphthalene | A possible carcinogen that is linked to inflammation of the lungs, damage to the nasal passages, and damage to lung tissue (Jia and Batterman 2010). | 3 | 0.02 (0, 0.11) | 0.01 (0, 0.04) |
In our study, we use both the combined HI and individual pollutant respiratory HQ for five specific HAPs: formaldehyde, acetaldehyde, acrolein, naphthalene, and diesel PM. We chose these HAPs because they are, on average, the top five pollutants that contribute to respiratory HQs, and collectively they account for over 50% of the total US respiratory HI in 2014 (table 1) (EPA 2018). Emissions levels tend to decrease over time, and the NATA respiratory HQ in 2014 is likely a good substitute for the average level between the years 2010 and 2019 (Ard 2015, EPA 2020).
We also include average county PM2.5 and ozone concentrations. Data for modeled average daily PM2.5 for 2000–2014 were sourced from the CDC Wonder Environmental data via the County Health Rankings and Roadmaps website (2020) and averaged. We obtained 2016 summer average 8 h maximum ozone concentrations from EPA's Environmental Justice Screening and Mapping Tool (EJSCREEN) (EPA 2020c). EJSCREEN reports using the EPA downscaler model to derive block group-level ozone estimates from monitored concentrations (EPA 2020c).
We include several covariates in our model. We use the R package 'tidycensus' to get American Community Survey (ACS) data from the US Census (Walker 2020) and averaged ACS variables for years 2012 to 2018. For county urban population percentage, we utilize 2010 US Census estimates. ACS variables included are median income, total population, a race variable for percentage of individuals self-identifying as Black, an ethnicity variable for percentage of individuals self-identifying as Hispanic, percentage of individuals below the poverty threshold, median house value, percentage of individuals achieving less than a high school degree, and percentage of individuals over 64.
Additional county-level covariates came from various sources (supplementary table 1). These include rates of adult obesity, preventable hospital stays, physical inactivity, and smoking from County Health Rankings, which derives data from the Behavioral Risk Factor Surveillance System (BRFSS) and Medicare claims data (Remington et al 2015, County Health Rankings & Roadmaps 2020). Hospital bed counts in 2019 were included from Homeland Infrastructure Foundation-Level Data (HIFLD) (HIFLD 2020). We also obtained dates when first cases were reported from each county as a way to account for infection spread in our model.
We fit negative binomial mixed models using county-level COVID-19 mortality as our dependent variable. Our statistical approach is like that of Wu and colleagues (2020). We include a state fixed effect and population offset to account for between-state variation and the fact that higher population counties will likely have both more cases and more deaths. All covariates were centered and scaled prior to analysis.
The negative binomial model statement is:
where  is the predicted death rate in each county,
  , for each state,
  ;
;  is a population offset for each county;
  is the vector of predictors for county
  in state
  ;
;  is the vector of coefficients for county
  for each state k; and
  is the vector of intercepts for each state
  .
.
We fit a combined regression model and single pollutant models for the five HAPs mentioned above (table 1).
We conducted additional sensitivity/robustness analyses to assess the potential of overcounting among the different pollutants. For example, PM2.5 may be counted individually as part of HAP particulates. We fit single pollutant models with only one pollutant included alongside our controls and in a subsequent multi-pollutant model containing each of the individual pollutants. We also tested for spatial autocorrelation using a Moran's I. While models did have signals of spatial autocorrelation prior to including the state fixed effect, after this was included no autocorrelation was detected.
All analyses were conducted in R version 3.6.3 (R Core Team 2020). The model was built and run using the 'glmmTMB' R package (Brooks et al 2017) . Sensitivity analyses for outliers, non-constant variance, and multicollinearity were done using the 'car' package (Fox and Weisberg 2011). The R code executing the data gathering, processing, and analysis are publicly available (https://github.com/lylla318/covid19-haps).
3. Results
As of July 11, 2020, there were 129 832 confirmed and probable deaths attributed to COVID-19 infection within 3223 US counties (1204 counties had no reported COVID-19 deaths). Figure 1 shows the spatial distribution of key predictors (NATA respiratory HI, PM2.5, and ozone) and COVID-19 mortality rates per county, which suggests higher mortality rates in populated areas as well as in rural southern counties; both areas also show higher respiratory HI levels.
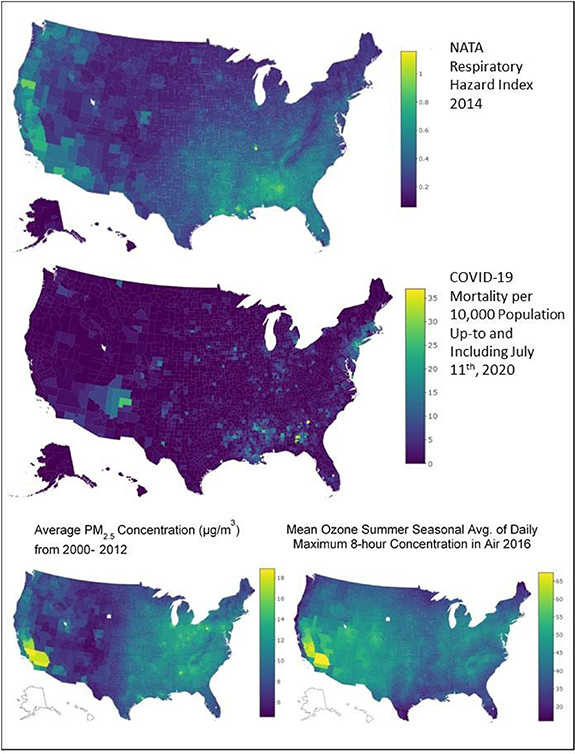
Figure 1. Spatial distribution of COVID-19 mortality, NATA respiratory quotient (HQ), PM2.5 mass concentration (µg m−3) and ozone (ppb) for all US counties.
Download figure:
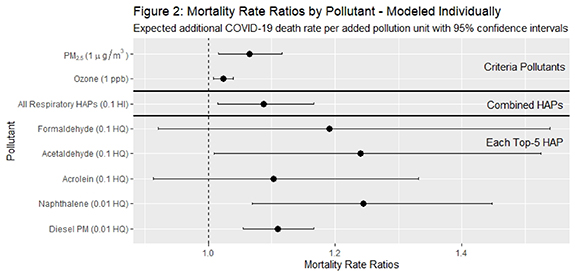
Standard image High-resolution imageIn figure 2, we present the effect on mortality rate ratios (MRR) and 95% confidence intervals (CI) for both combined and single-pollutant models. For NATA respiratory HI, our indicator of all modeled HAP exposure with non-cancer respiratory health impacts, the effect on MRR per 0.1 increase is 1.09 (CI: 1.01, 1.17). As a point of reference, a 0.1 increase in NATA HI is equivalent to 10% of the combined RfC level. Our model results for other air pollution exposures are: a 1 µg m−3 increase in PM2.5 and 1 ppb increase in ozone concentration correlate with a 7% (CI: 1.02, 1.12) and 2% (CI: 1.01, 1.04) increase in COVID-19 MMR, respectively.
Figure 2. Change in mortality rate ratios (MRR) for criteria pollutants, combined HAPs, and top five HAPs, including exponentiated coefficients and 95% confidence intervals. Results from the models include all covariates.
Download figure:
Standard image High-resolution image
Results show that an increase of 0.9 µg m−3 in modeled average annual ambient acetaldehyde concentration is associated with a 24% increase in COVID-19 mortality rate (MRR of 1.24 (CI: 1.01, 1.52)). For the single-pollutant model that includes diesel PM, NATA's indicator of diesel exhaust concentrations, the effect on MRR per 0.5 µg m−3 increase is 2.82 (1.70, 4.68), equating to a 182% increase in the mortality rate. Single pollutant models also estimate an increase in 0.3 µg m−3 of naphthalene concentrations resulting in a 791% increase in the mortality rate (MRR of 8.91 (CI: 1.96, 40.52)). No statistically significant associations were found for formaldehyde and acrolein.
Our secondary analysis fit one multi-pollutant model, which includes criteria pollutants and individual HAPs (table 2). This was performed as a sensitivity/robustness test for the single pollutant models due to possible interaction between pollutants and potential over-counting. In comparison to the models described earlier, the effect of controlling for multiple pollutants attenuates the impact of every individual pollutant on COVID-19 mortality except for acetaldehyde and diesel PM. For example, the single pollutant model for naphthalene estimates the effect on MRR of 39.02 (CI: 5.57, 273.22) per increase of 0.3 µg m−3 of ambient average concentration, and this effect is substantially reduced, and not statistically significant, when controlling for the effect of other pollutants (MRR of 17.17 (CI: 0.82, 357.47)) In the multi-pollutant model, only two pollutant effects on MRR are statistically significant at the 95% confidence level. These include acetaldehyde HQ (MRR of 3.34 (CI: 1.69, 6.63)), and PM2.5 (µg m−3) (MRR of 1.09 (CI: 1.01, 1.18)).
Table 2. Single- and multi-pollutant models of COVID-19 mortality using air pollutant predictors.
| Single-pollutant aExponentiated coefficient (95% CI) | Multi-pollutant Exponentiated coefficient (95% CI) | |
|---|---|---|
| Air pollutants | ||
| All respiratory HAPs | 1.09 (1.01 to 1.17) | − |
| All Other HAPS (0.1 HI)—except top 5 (0.1 HI) | − | 1.02 (1.01 to 1.04) |
| PM2.5 (µg m−3) | 1.07 (1.02 to 1.12) | 1.03 (0.87 to 1.21) |
| Ozone (1 ppb) | 1.02 (1.01 to 1.04) | 1.04 (0.91 to 1.10) |
| Formaldehyde (0.1 HQ) | 1.19 (0.92 to 1.54) | 0.34 (0.18 to 0.67) |
| Acetaldehyde (0.1 HQ) | 1.24 (1.01 to 1.52)) | 2.47 (1.51 to 4.05) |
| Acrolein (0.1 HQ) | 1.10 (0.91 to 1.33) | 0.92 (0.70 to 1.21) |
| Naphthalene (0.1 HQ) | 8.91 (1.96 to 40.52) | 5.66 (0.58 to 55.56) |
| Diesel PM (0.1 HQ) | 2.82 (1.70 to 4.68) | 2.19 (1.21 to 3.96) |
| Covariatesb | ||
| Median home value ($) | − | 1.05 (0.93, 1.18) |
| Less than high school education (%) | − | 1.68 (1.51, 1.88) |
| Below poverty line (%) | − | 1.21 (1.08, 1.36) |
| Days since first reported COVID-19 case (days from July 11th, 2020) | − | 1.74 (1.56, 1.93) |
| Black (%) | − | 1.28 (1.17, 1.39) |
| Hispanic (%) | − | 0.98 (0.89, 1.08) |
| Over 64 years old (%) | − | 1.25 (1.16, 1.35) |
| Median household income ($) | − | 1.40 (1.21, 1.62) |
| Population Living in Urban Areas (%) | − | 1.12 (1.04, 1.20) |
| Smoking rate (%) | − | 0.92 (0.85, 1.01) |
| Hospital beds (n) | − | 0.97 (0.92, 1.01) |
| Minimum temperature (° C) | − | 0.90 (0.79, 1.02) |
| Maximum temperature (° C) | − | 1.15 (1.02, 1.30) |
| BMI >30 (%) | − | 1.06 (0.94, 1.20) |
| No physical activity (%) | − | 1.02 (0.88, 1.17) |
| Preventable hospital stays (%) | − | 1.06 (0.98, 1.13) |
aSingle-pollutant models are individual model runs, including one pollutant and all covariates. bMean scaled valuesBMI = body mass index; CI = confidence interval; HAPs = hazardous air pollutants; HI = hazard index; HQ = hazard quotient; PM = particulate matter
Table 2 shows multi-pollutant model parameter estimates. While our main focus is related to key air pollution explanatory variables, some non-pollutant predictors are statistically significant, including, among others, the percentage of individuals identifying as Black (MRR of 1.28 (CI: 1.17, 1.39)), the percentage of individuals with less than a high school education (MRR of 1.68 (CI: 1.51, 1.88)), the percent of households under the federal poverty line (MRR of 1.21 (CI: 1.08, 1.36)), and the percentage of individuals over the age of 64 (MRR of 1.25 (CI: 1.16, 1.35)).
4. Discussion
Our analysis builds upon studies identifying air pollution as a factor contributing to increased risk of COVID-19 mortality (Comunian et al 2020, Conticini et al 2020, Hendryx and Lou 2020, Martelletti and Martelletti 2020, Ogen 2020, Wu et al 2020, Zhu et al 2020). Our models suggest increased chronic multi-air pollutant exposure, even at levels below expected impact thresholds, are associated with higher COVID-19 mortality rates when controlling for known socioeconomic and behavioral health influences. We contribute to the ongoing investigation of COVID-19 mortality by confirming related PM2.5 findings and helping to provide one possible explanation to why some rural counties, such as those in Georgia and Louisiana (figure 2), have experienced higher mortality rates than urban areas.
First, our findings highlight that enforcing pollutant release limits is indeed related to health betterment in society. Further, continuing to make pollution load information publicly available at the state and federal level is critical for inquiry. The potential link between pollution exposure and COVID-19 mortality should be expanded upon because such efforts can contribute to evaluating the efficacy of current pollution prevention measures. For example, our findings suggest that the decision to relax enforcement of the Clean Air Act may inadvertently exacerbate air quality issues in areas most vulnerable to increased COVID-19 mortality due to long term air pollution exposures.
Second, our analysis indicates chronic, cumulative exposure to HAPs at levels below reference concentration (RfC), an estimate of daily inhalation exposure likely to be without an appreciable risk of deleterious effects during a lifetime (EPA 2020d), may heighten population vulnerability to COVID-19 mortality. The RfC assumes health impact thresholds exist for certain toxic effects. Aligning with prior studies (Hendryx and Luo 2020), we identify signals of increased COVID-19 mortality rates occurring with small changes in low levels of diesel PM concentrations. For the first time, we also identify this pattern with acetaldehyde. Possibly, chronic exposure to these pollutants at very low levels, while not causing observable respiratory system damages, do reduce the body's ability to recover from COVID-19 in some way. Further scrutiny may reveal why these associations have appeared.
Third, we also find signals of cumulative exposure impacting COVID-19 mortality. These results are most striking in the context of cumulative exposure metrics and especially relevant to a holistic understanding of the socio-environmental system in which we live. Further, we reproduce findings showing that not all groups face the same level of vulnerability. For example, cumulative exposures are especially relevant in minority communities (Collins et al 2015) and among very young children (Grineski 2020). While cumulative approaches are beneficial to all, they are critical in the context of protecting vulnerable groups. NATA approaches HAP risk screening in a summative manner, accounting for the additional health burden of multi-pollutant exposure as a means by which EPA can identify areas for further regulatory action. By combining NATA results with public epidemiological and sociodemographic datasets, we provide useful information for future rulemaking. Currently, several risk and technologies reviews for HAP source groups are being finalized without accounting for cumulative exposure health risks (see https://epa.gov/stationary-sources-air-pollution/risk-and-technology-review-national-emissions-standards-hazardous) despite contrary recommendations from the EPA Science Advisory Board (Swackhamer and Milford 2010). Our results align with these recommendations and bolster emerging evidence linking air pollution exposures to increased COVID-19 mortality.
As with all ecologic studies, there are limitations. Our exposure variable, a one-year estimate from 2014, is an imperfect measure of chronic HAPs exposure, but this is the most recent and best data available. Additionally, HAP concentrations vary substantially within counties. When COVID-19 mortality data becomes available at the census tract level, finer grained analysis may be performed. These same limitations apply to fine particulate matter county average concentrations. These data are averaged and are inconsistent across available sources (Diao et al 2019) bringing further uncertainty to the results presented here. We necessarily assume that individuals who die because of COVID-19 infection have also been chronically exposed to HAPs over their lifetimes. Further, we assume that the most relevant pollutants are captured in NATA. Finally, we also assume COVID-19 exposure is widespread and randomly distributed throughout the United States. Inconsistencies in COVID-19 mortality reporting, as well as local changes in HAP concentrations over time, are also sources of possible uncertainty. As such, results are not appropriate for individual-level inferential statements. While these limitations do not allow for causal conclusions, we do come to several important and time sensitive conclusions about chemical risk management and public health policy. We present these findings with the goal of helping the US population maintain general pulmonary health resilience and safeguarding against future coronavirus pandemics.
While our study has limitations, it also has important implications. Further inquiry will benefit from including more detailed information about COVID-19 patients as well as state and county level social distancing policies. We emphasize the need for diligence in environmental and human health protection during this pandemic, but also call for further research relating air pollution to COVID-19 in the context of both mortality and the environment.
Acknowledgments
We thank Amanda Charette for her support and general feedback. This effort benefited substantially from the State University of New York's Discovery Challenge Fund.
Declaration of competing financial interests
The authors declare that they have no competing financial interests.
Data availability statement
No new data were created or analysed in this study.