

Abstract
Green bonds have emerged as a key instrument to fund projects contributing to climate change mitigation or environmental protection. However, a consistent, robust and comparable standard for the estimation of the environmental impacts of green bonds is lacking, hampering growth in sustainable finance. As encouraged by second-party opinion reports, the use of life cycle assessment (LCA) allows for the complete environmental evaluation of projects over their life cycle. Here we estimate the LCA-based impacts along several environmental metrics of a set of green bonds for renewable power plants issued by the European Investment Bank from 2015–2018. Life cycle avoided greenhouse gas (GHG) emissions varied by a factor of 12 from 29 to 359 t CO2 eq./M€ invested—information that is not available to investors at the outset, indicating that funds are unlikely to be allocated efficiently. Furthermore, linking environmental impact indicators to the Sustainable Development Goals unveils significant trade-offs. Bonds may perform well on water use and emissions, while having a negative impact on waste and land use. Conducting LCA of green bonds comes at a cost of additional methodological challenges and increased data needs compared with current reporting practices. However, the ready infrastructure of LCA databases and methodologies can provide the necessary tools to meet future reporting requirements as the EU taxonomy framework and standardization of impact reporting evolve.
Export citation and abstract BibTeX RIS

Original content from this work may be used under the terms of the Creative Commons Attribution 4.0 license. Any further distribution of this work must maintain attribution to the author(s) and the title of the work, journal citation and DOI.
1. Introduction
Substantial capital investments are required to meet the sustainability targets set by the Paris Climate Agreement and the Sustainable Development Goals (SDGs). The United Nations (UN) estimates that USD 5–7 trillion are needed annually to finance the infrastructure needed to reach the 17 SDGs by 2030, such as the goals 'Affordable and Clean Energy', 'Responsible Consumption and Production', or 'Climate Action' [1]. Over the same horizon, the OECD estimates that USD 6.9 trillion in annual infrastructure investments are required to meet the 2 °C 66% scenario [2]. Mobilizing private capital is critical to allocate financial resources to support the transition. However, despite considerable growth in sustainable finance, it remains a niche sector [2, 3].
Green bonds play an increasing role in financing investments for development and climate transition [4, 5], representing around 29% of the 2017–2018 average funds allocated to new projects in the broader category of climate finance [6]. Green bond issuance is driven by Nationally Determined Contributions to the Paris Agreement and institutional factors [7] and the demand from investors seeking to engage in sustainability [8]. In 2019, issuance reached USD 257.7 billion [9], representing about 3.8% of new bond issuance globally [10]. Differently from traditional bonds, issuers must provide information on the 'use of proceeds' (which projects are financed), project selection (how eligible projects are screened) and green additionality of the projects (if projects would have been financed otherwise)—ideally through reporting of qualitative and quantitative indicators.
As no global standard exists to report this information, a number of initiatives emerged to reduce the risk of greenwashing and increase transparency. The Green Bond Principles (GBP), the first international guidelines for issuers, were first published in 2014 [11]. Other guidelines have since emerged, emphasizing transparency and harmonization across definitions and reporting [12–14]. The Climate Bond Initiative leads the only official green bond certification. Alternatively, approved verifiers (e.g. Deloitte, Carbon Trust or DNV GL) can attest to the quality of green bond frameworks to gain investors' trust. In addition, it is market practice that issuers hire a second-party opinion provider (e.g. CICERO, Sustainalytics) to check and rate the green bond issuance from an environmental perspective [12]. Despite these efforts, the industry remains self-regulated.
A consistent, robust and comparable standard for estimation of the environmental impacts of green bonds is lacking, hampering growth in sustainable finance [15]. Data scarcity is the main cause of this shortcoming. Tolliver, Keeley [16] find that issuers often failed to publish reports with quantitative environmental indicators (only 51% of issuers in their study), and that this lack of definite information on green bonds' environmental impacts may undermine investor confidence. This is neither new nor unique: similar concerns about environmental integrity and additionality are raised in the market for carbon offsets [17, 18]. A survey conducted by the Global Impact Investing Network (GIIN) highlighted that 80% of respondents viewed transparent strategies and disclosure of results as a mitigation solution to 'impact washing' [19]. Second, lack of standardization in reporting impedes proper comparisons across bonds. Among the 79% of the green bonds with impact reporting issued prior to November 2017, more than 200 different indicators were used [20]. Furthermore, even typical indicators (e.g. avoided greenhouse gas (GHG) emissions) were often obtained by different methodologies. Third, the very extent to which green bonds are responsible for the existence of low-carbon projects they fund is under debate, as green bonds are often used to refinance existing projects or the simple choice of a green bond as a financing instrument is not vital to the funding of the project [8, 21]. This refers to the concept of 'green bond additionality', also mentioned by the European Commission's Technical Expert Group's (TEG) as a challenge for the assessment of green bonds [22].
Underlying this debate is the need to meet the demand from investors to fund projects that truly mitigate climate change or otherwise advance environmental protection rather than projects that do so only superficially. One solution identified by second-party opinion providers is the use of life cycle assessment (LCA) methodologies in order to gain a complete assessment of the environmental impacts of projects financed by green bonds [23, 24]. LCA is mentioned throughout the TEG's Taxonomy Technical Report as the best practice to determine the environmental impacts (principally GHG emissions) of a product or process throughout the sourcing, production, use, and disposal phases, which is required 'when better data is identified' [25]. Very few issuers use a comprehensive LCA-based standard, ENGIE [26] being a notable example. The proposed EU Green Bond Standard [27] offers guidelines to link issuers' project(s) to environmental objectives enshrined in the Taxonomy. The use of a standardized methodology could improve the transparency of, the comparability across, and the trust in green investments [28].
Literature suggests that the environmental sustainability performance of green bonds may not be properly measured and reported (e.g. [5].). In this context of data scarcity and heterogeneity in use of proceeds, we explore the following research questions. Is there any potential for LCA to support a more robust reporting framework? If yes, how does it compare to conventional accounting? And finally, beyond carbon accounting, can LCA give any indication of wider environmental sustainability consequences, such as those included in the SDGs?
We identify the challenges in terms of data needs and mappings to match project specifications to an LCA framework. We test this methodology using the green bonds statements issued by the European Investment Bank (EIB) and comparing the avoided carbon emission disclosed therein to our LCA-based estimates for different scenarios of reference-case emissions. We then extend the environmental assessment of green bonds to indicators other than global warming potential, such as local air pollutants and water use, or damage to ecosystems. Finally, we identify the factors that hinder the expansion of LCA as the methodology of choice for green bond impact assessment, and discuss how current impact-reporting practices among green bond issuers do not adequately convey a market signal to steer investments towards projects that most efficiently improve environmental outcomes.
2. Data
2.1. Green bonds
We assembled a dataset of green bonds and the projects they finance from the EIB's 'Climate Awareness Bonds' (CABs). The EIB is the multilateral bank of the EU, using debt instruments to finance strategic projects predominantly located in the EU, but also in third countries. It has pledged to invest EUR 1 trillion in climate projects until 2030 [29]. From 2015 to 2018, the EIB allocated EUR 15.4 bn funds raised from CABs issuance in approximately 270 transactions for 194 individual projects, across 47 countries. The 2015–2018 CAB Statements contain financial and environmental information on individual projects in the energy sector.
From this initial sample, we selected projects which could be mapped to processes in a life cycle inventory (LCI) database with minimal modifications, as detailed in SI section S1 (available online at stacks.iop.org/ERL/15/104045/mmedia). The sample includes electricity generation technologies, such as combined heat and power (CHP) projects, as well as hydro, solar, and wind power projects. We exclude projects in energy efficiency and transmission infrastructure and a handful of projects with incomplete information, due to high uncertainty and lack of readily-available corresponding process in ecoinvent (further details in SI section S2). Our final sample contains 61 projects in 27 countries, funded by 24 CABs, and covering 40% of the initial database in monetary terms.
2.2. LCI and life cycle impact assessment (LCIA)
Large-scale LCA of multiple products or processes generally starts with building an LCI, most often combining directly collected data with data from the literature and existing LCI databases. The latter are representations of the economy at different levels of granularity and detail. For green bonds, we need to estimate the environmental impacts of specific technologies over the stages of production and use from resource extraction to assembly, installation, and use. This is achieved utilizing a process-based LCI database, such as ecoinvent [30], which includes material and energy data on environmental impacts for thousands of products and technologies. Specifically, the database accounts for life cycle environmental impacts, ranging from the extraction of raw material to manufacturing, transportation, and power plant construction and operation. In the analysis, we did not consider the impacts of power plant decommissioning (see figure S1 in the SI for more details). From the ecoinvent database version 3.6, LCI data corresponding to the CHP, hydro, solar, and wind power projects was adapted for specific capacities across different countries.
For the LCIA, we compute environmental impacts associated with each project, beyond GHG emissions only. The environmental impact indicators all relate to various areas of protection (human health, ecosystems, and resources), and ultimately, to the SDGs. Some studies have linked LCA indicators to the 17 SDGs to identify synergies and trade-offs across SDGs [31–34]. We use the subset of SDG-relevant indicators proposed by Cavalett and Cherubini [31], which relies on several life cycle impact assessment methodologies [35–41]. The methods translate life cycle emissions and extraction of resources into environmental impact scores by using midpoint- and endpoint-level harmonized characterization factors, among others. Indicators include climate change impact, freshwater ecotoxicity, freshwater eutrophication, metal depletion, human toxicity, particulate matter formation, terrestrial acidification, land transformation (all midpoint indicators), but also damage to ecosystems (endpoint indicator), coal use (environmental flow), or ecological footprint (aggregate indicator).
3. Methods
3.1. Mapping green bonds to life cycle inventories
Project data from the EIB and third-party sources on the country, technology, and installed capacity were used to establish a link with the corresponding process in ecoinvent (figure S1). The final correspondence between the 61 EIB green bond projects and ecoinvent processes is presented in the SI (section S3, table S1).
3.2. Determining the reference case—electricity generation substitution
Avoided emissions, also referred to as emissions savings, are defined as the difference between baseline emissions (emissions that would occur from producing electricity without the project) and project (absolute) emissions. There is no consensus in the literature or among green bond issuers regarding the baseline scenario for emissions. For example, the Nordic Issuers recommend using a single value of 380 g CO2/kWh as the reference case emissions rate for the European mainland mix including Norway [42]. The EIB uses a sophisticated methodology to compute its reference case [43], and we define several different scenarios for our own LCA reference cases.
3.2.1. EIB methodology for determining the reference case
Unlike in a complete LCA, the EIB's carbon footprint calculations include only scope 1 and scope 2 emissions, using the scope concept defined in the World Resources Institute's GHG Protocol [44]. Scope 1 refers to direct GHG emissions produced by the project, such as fossil fuel combustion, while scope 2 refers to indirect GHG emissions associated with direct energy inputs to the project, i.e. energy consumed (but not produced).
In defining its reference case, the EIB distinguishes between operating margin, i.e. the next kWh provided by the existing grid, and build margin, i.e. the kWh generated by the next power plant built, following the recommendations of the UNFCCC for calculating emission factors of an electricity system [45]. The EIB gives more or less weight to the operating and build margin depending on the country's electricity demand growth and whether the new project is intermittent. With this method, Germany's emission factor varies between 366 and 596 g CO2 eq./kWh [43]. More details on the EIB methodology are given in the SI.
3.2.2. Determining the reference case
Three reference scenarios are considered for the LCA. In the first, called average mix, we assume that electricity is reduced by the average power generation mix in the country at the time of investment. This rate comes from the average mixes contained in ecoinvent 3.6 (cut-off).
In the second scenario, called marginal mix, we assume that the project generates electricity that reduces the electricity generated only at the marginal, unconstrained operating plants—those last in the generation dispatch merit order. This more accurately captures the set of power plants that a new power plant would substitute for [46]. The current marginal mix is extracted from ecoinvent 3.6 (consequential), while long-term marginal electricity supply mixes for 2030–40 were incorporated into ecoinvent 3.4 in 2017 [47]. The two approaches loosely represent, respectively, an upper-bound (very short term, or operating) and lower-bound (long term, build) of marginal mixes.
In the third scenario, called new NGCC, we assume that the project reduces electricity at a natural gas combined cycle (NGCC) plant, the likely substitute that would be built today to meet new electricity demand in the absence of the project. From an energy transition perspective, natural gas can provide near-term benefits when replacing more polluting fuels [48]. We use the country-specific NGCC technology process data from ecoinvent 3.6.
Table 1 summarizes the GHG emission rate for the different average and marginal mix scenarios considered.
Table 1. GHG emission rate for different average and marginal mix scenarios, unweighted average of all countries in sample.
| Scenario | Corresponding database | GHG emission factor (g CO2eq/kWh, unweighted average across sample countries) | Source |
|---|---|---|---|
| Average mix | ecoinvent cut-off 3.6 | 635 | [30] |
| Marginal mix | ecoinvent consequential 3.6 | 229 | [30] |
| ecoinvent consequential 3.4 (2030–2040) | 176 | [47] | |
| New NGCC | ecoinvent consequential 3.6 | 449 | [30] |
In all scenarios, the entire LCA environmental impacts for the reference case are included to make the appropriate comparison with our LCA estimate of environmental impacts associated with the project financed through a green bond. The choice not to follow the UNFCCC guidelines [45] used by the EIB was made for the purpose of comparison, as such results would, by construction, lie in the envelope shaped by the three scenarios.
3.3. LCA-based comparison with conventional impact reporting
In the EIB's methodology, renewable energy (RE) technologies are attributed zero absolute emissions, in compliance with the GHG Protocol, while the LCA methodology assigns additionally scope 3 GHG emissions to the RE technologies, due to the emissions produced during construction and at end-of-life. Like the EIB, we compute the avoided GHG emissions, in CO2eq, for each project for the different reference cases considered. Finally, for the marginal mix reference case, 24 other environmental impacts associated with each project as described in section 2.2 were calculated. In the next section, we analyze how avoided emissions per euro invested vary across technologies and countries.
4. Results and discussion
4.1. Life cycle vs. conventional estimations of avoided GHG emissions: the importance of the reference case
The largest projects in terms of installed capacity were hydropower, followed by wind, CHP, and solar, though average project costs were greatest for wind power. Avoided emissions, regardless of the calculation method, differed across technologies and were generally highest for wind and lowest for CHP and hydropower (figure 1). The choice of the reference case and the boundaries of the emissions considered (Scopes 1 and 2 for the EIB versus Scopes 1–3 for LCA) have a key effect on the estimate of avoided emissions, in particular in the case of wind power (figure 1).
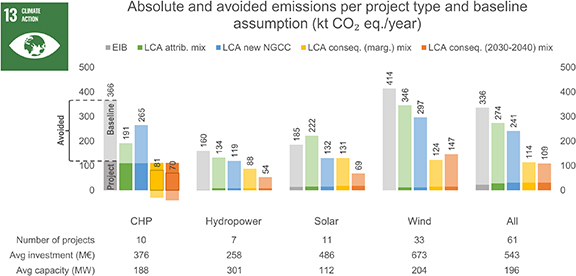
Figure 1. Avoided emissions across technologies, by reference scenario. Author calculations using project data [49] and ecoinvent 3.4 and 3.6.
Download figure:
Standard image High-resolution imageOverall and as expected, LCA avoided GHG emissions are lower than the EIB estimates, because LCA also includes emissions from the project from non-use phases, such as construction, lowering avoided emissions. Among the LCA reference cases considered, the average mix case was closest to the EIB estimate of avoided GHG emissions. Marginal mixes tend to have lower emissions, since old, carbon-intensive coal power plants have longer ramp rates and produce electricity at a lower cost, i.e. they are baseload plants that rarely operate on the margin. Marginal mixes in 2030–2040 are expected to be lower-carbon than current marginal mixes, given efforts to decarbonize the grid.
The choice of baseline or reference case emissions plays a key role in determining avoided emissions. New renewable power plants are not as effective at decarbonizing in countries with a low-carbon electricity mix. As green bonds become more commonplace, the selection of the reference case becomes increasingly complex: green bonds may indeed no longer be considered exogenous as modelling of long-term consequential mixes relies on market-based approaches and economic incentives [50]—including policies that support green bonds, green bonds themselves play a role in defining new electricity mixes. In this case they will therefore determine the marginal mix, which can no longer be used straightforwardly as a baseline. As an example, if the marginal mix of 2035 is financed to 40% by green bonds, then the performance of green bonds could instead be compared against the remaining 60%.
4.2. Life cycle GHG emissions across technologies
Due to their lower operation costs and intermittency, new renewable sources are in direct competition with marginal electricity sources [46, 51]. We therefore focus on the LCA marginal mix case. Figure 2 displays the variation in avoided emissions across technologies for this case. Each bar represents the estimated avoided emissions per euro, identified by country and grouped by technology, with the width of the bar indicating total project cost. Wind power projects cover a particularly wide range of emission savings and investments. Most countries deploying wind power (in terms of investment) already have a low-carbon marginal mix, which reduces the green bond-related decarbonization achieved. As wind power constitutes 70% of the total energy produced by all green bond projects (GWh per year), this also influences the overall total across technologies. We confirm these first-level results in a simple regression analysis discussed in SI section S4.
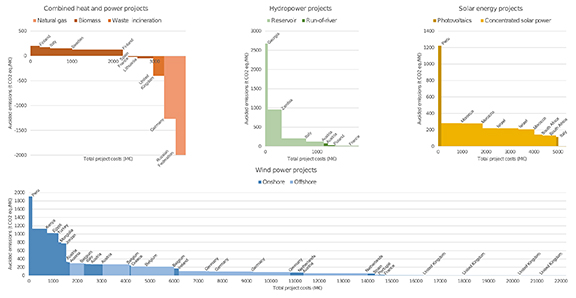
Figure 2. Avoided emissions (marginal mix scenario) per EUR, grouped by technology for CHP, hydropower, solar, and wind, per project.
Download figure:
Standard image High-resolution imageOverall, the variation in avoided emissions within a technology group is quite broad and overlaps with the ranges for the other technologies. It is thus difficult to draw a priori conclusions about the relative efficacy of one technology over another in terms of achieving emission reductions, as potential investors considering different green bonds might. We find that life cycle avoided GHG emissions per euro invested vary by a factor of more than 100 within RE technologies implemented in different countries. The same holds true when looking at variation in emission reductions per euro within a country and across technologies. Overall, the covered projects would save 153 t CO2 eq. per million euro invested (5.07 Mt in total), and 615 t CO2 eq./M€ if an average mix is the reference (15.0 Mt in total).
This high degree of variation means that investors would have difficulties in identifying the green bond project achieving the largest reduction in GHG emissions per euro, since the only information available to them at the outset is the type of RE technology and, in some cases, the country of implementation. Moreover, if investors were to study an issuer's history of emission reductions achieved on the basis of impact reporting for existing projects, they may have difficulties in identifying combinations of technologies and countries of implementation that achieve greater emission reductions than others. It follows that current practices in impact reporting across many green bond issuers are unlikely to guide funds to the most efficient emission-reducing projects.
4.3. LCA of other environmental impacts
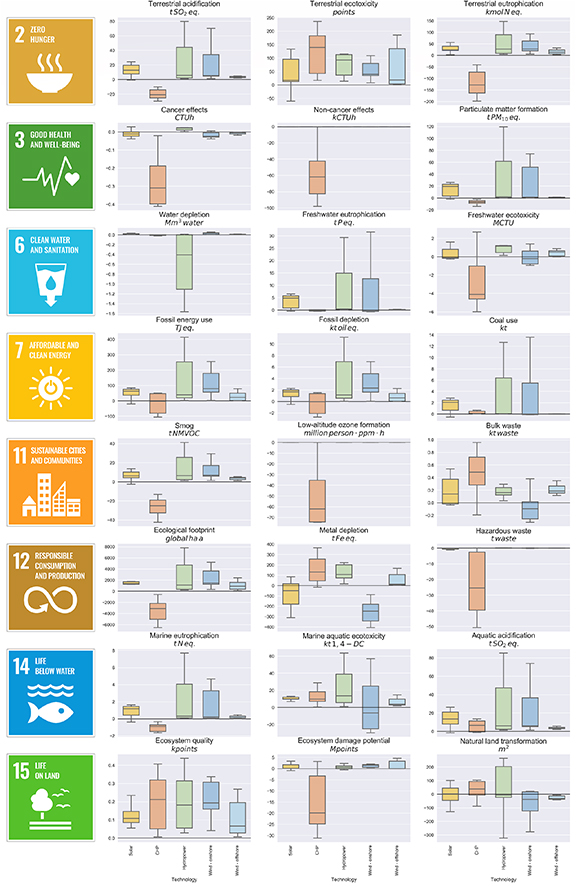
By linking the project information from the green bonds issued by the EIB to the ecoinvent LCI database, we estimated a wider set of environmental impacts aside from GHG emissions. While most of the 61 projects reduced GHG emissions relative to our LCA consequential mix reference case, the same does not hold for the other environmental indicators. Figure 3 presents the technology-average improvement across 24 different indicators relative to the LCA consequential, marginal mix reference case. The results show the impact of a 1 million euro investment on all sample projects of a particular technology type over 1 yr of the projects' lifetime. Issuers could use this information to choose investments that ensure the most significant sustainability impact across multiple environmental metrics. In some cases, there are trade-offs. Solar power, for example, performs better than the reference case on terrestrial acidification but worse on metal depletion. CHP projects cause the most degradations, performing worse than the baseline in more than half of the 24 environmental indicators considered, notably in soil-related impacts, toxic emissions, NMVOC emissions, ecological footprint, eutrophication, and damage to ecosystems.
Figure 3. Box and whisker plot showing the improvement (positive) or deterioration (negative) in various environmental indicators relative to the LCA marginal mix reference case, per million euro invested in the CAB pool, by technology. The box delineates the lower and upper quartiles with the median marked with a line, whiskers show smallest and largest values.
Download figure:
Standard image High-resolution image
4.4. From projects to bonds: environmental impact at the level of a bond
A single bond often funds multiple projects, and projects are often funded by multiple sources including multiple bonds. The previous analysis centered on projects. In this section, we combine project-level impacts to the bond(s) that provide part of the financing. Table 2 presents the aggregated environmental impacts for nine indicators (remaining 16 indicators in SI table S4) of the 24 EIB green bonds that provided partial or complete funding for the 61 projects in our sample. The environmental impacts of the projects are allocated to the bonds according to the share of the project cost covered by the bond. Not all of the proceeds from bonds have been allocated and therefore the results are valid only for the part of the bond already spent ('Allocated CAB'). The picture of a bond's impact is complete only at full proceeds allocation. In addition, the results presented are only valid for the value of the bond included in our sample ('CAB in Sample').
Table 2. Relative improvement (positive) or deterioration (negative) of a bond's projects relative to baseline (per million euro per year). Source: author calculations using project data and ecoinvent 3.4 and 3.6.
 |
Note: DCB—dichlorobenzene, P—phosphorus, Fe—iron, PM10—particulate matter of 10 micrometers in diameter or less, NMVOC—non-methane volatile organic compound, SO2—sulfur dioxide, 1,4-DC—1,4-dichlorobenzene. Positive numbers reflect improvements, negative numbers deterioration relative to the baseline. The 61 projects in our sample are financed partially or completely by the 24 Climate Awareness Bonds (CABs) described in this table.
For each indicator, there are different 'shades of green', highlighting the trade-offs and co-benefits between environmental impacts. All of the bonds except two bring savings in terms of climate change impact, while eight bonds would have a negative impact on the metal depletion indicator and all but five of them a negative impact on natural land transformation. Only two bonds led to improvements across all nine environmental indicators considered here. No particular bond scores the best or the worst across all categories. Nonetheless, such results could give investors the possibility to rank bonds according to their own environmental priorities.
5. Conclusions
Following a life cycle perspective to assess the environmental impacts of a green bond is useful for two reasons. First, it puts technologies on a level playing field, since some technologies have relatively low emissions during the use phase but at the cost of relatively higher emissions during the construction or end-of-life phase—a typical pattern of RE infrastructure. Second, linking projects to LCA databases allows for the inclusion of environmental impacts beyond GHG emissions. While some investors may only be interested in climate change mitigation, others may want to achieve climate change mitigation with as little cost to other environmental goals as possible.
The recently agreed-upon EU framework for sustainable finance explicitly requires economic activities to provide a 'substantial contribution' to one of the six listed environmental objectives while not doing 'significant harm' to any of the other environmental objectives for the economic activity to be deemed 'environmentally sustainable'. The draft proposal for the EU Ecolabel for Financial Products states that bond funds must show a share of 70% in fixed-income instruments that align with the Taxonomy in order to receive the EU Ecolabel [52]. As elements of this framework become legally binding in the future through delegated acts, conducting this kind of assessment over multiple indicators may become necessary. In this paper, we have shown how LCA and the ready infrastructure of LCA databases and methodologies can provide the tools necessary to meet such a reporting requirement.
The cost of LCA comes in the form of larger data requirements than traditional use-phase estimations that are limited to a single indicator. At least, the technology, country, and installed capacity must be matched to an existing LCI database that may or may not contain the information for the combination of technology, country, and capacity. Some issuers may conduct thorough analyses to provide use-phase estimates of avoided GHG emissions that are quite precise, yet estimating emissions along the entire supply chain may prove infeasible. In these cases, switching to an LCA estimate could lead to the loss of precision in the use-phase estimate of avoided GHG emission in order to include estimates from the other phases and for other indicators. Nevertheless, LCA guarantees consistency over a project's entire life cycle and across multiple environmental indicators.
Regardless of whether a green bond issuer reports environmental impacts considering only the direct vs life cycle scope, the selection of the reference case has a significant effect on the overall environmental impact estimates of projects, including those associated with green bonds. For the RE projects in our case study, the differences were substantial. GHG emissions avoided as an average for all technologies range from 153 t CO2 eq. per million euro in a consequential, marginal mix scenario (based on an already greener electricity grid for comparison) to 615 t CO2 eq. per million euro in the attributional, average mix scenario (based on a more carbon intensive average electricity grid). For comparison, EIB estimates were 11% higher than the LCA-based attributional (average mix) case. The annual reductions in GHG emissions achieved across projects varied by a factor greater than 100 within RE technologies implemented in different countries.
Assessing a wider set of environmental impacts allowed us to understand trade-offs and co-benefits across indicators. Most of the 61 projects reduced GHG emissions relative to the baseline. However, projects did not improve environmental outcomes across all indicators. Notably, biomass CHP plants did not bring any environmental improvement, relatively to baseline for direct air emissions (particulate matter, smog), soil degradation (acidification, eutrophication), and damage to ecosystems. This pattern confirms the identification of potential trade-offs of biomass-based electricity production [53, 54], and raises the question of the green bond eligibility of biomass projects, depending on the feedstock type. The European Commission is currently considering strengthening the sustainability criteria for biomass development [55].
Though the environmental impact of a green bond is initially computed at the level of a project, we also aggregated LCA environmental impacts to the level of bonds. For bonds' climate change impact, values vary from savings of 29−359 t CO2 eq per million euro. Some bonds achieved this only at the cost of degradations across other environmental indicators—information yet unavailable at post-issuance reports, let alone ex ante documentation.
In order to limit the increase in global average temperature to 2 °C, funds directed towards sustainable projects need to increase substantially. Lack of appropriate indicators and metrics increase the risk of greenwashing and present a lost opportunity to direct funds towards the most suitable projects. We show that even among projects that justifiably qualify as 'green' or 'sustainable', the amount of GHG emission reductions achieved per euro invested varied by a factor of 12 across the bonds in our sample. This information would not be available to investors at the outset or even easily obtainable post-issuance. Only by standardizing impact reporting in terms of units and reference case selection can we compare environmental performance across projects and bonds. In its current form, the proposed EU Green Bond Standard would not require quantification of impacts or standardize which metrics or reference cases should be used. Lack of standardization makes it difficult for investors to rank green bonds across and within different issuers in terms of their effectiveness at reducing GHG emissions or improving other environmental outcomes. At best, investors can choose a green bond over a non-green bond, as there is currently no standardized reporting information that would steer investors towards one green bond over another, which means funds are allocated in an inefficient way.
Acknowledgments
We thank two anonymous reviewers for their thoughtful comments. We also thank the European Investment Bank for making the project-level data available. This work was made possible with funding from the Fonds National de la Recherche Luxembourg (project REFUND O19/13947579).
Data availability statement
The data that support the findings of this study are available upon reasonable request from the authors.