


Abstract
The summer of 2018 was characterized by high temperatures and low precipitation values in the Netherlands. The drought negatively impacted different sectors, resulting in an estimated damage of 450 to 2080 million Euros. Strong regional differences were observed in the precipitation shortfall across the country, with highest deficits in the southern and eastern regions. This raised two questions: (i) have increasing global temperatures contributed to changes in meteorological and agricultural droughts as severe or worse as in 2018? And (ii) are trends in these types of droughts different for coastal and inland regions? In this paper we show that there is no trend in summer drought (Apr-Sep) near the coast. However, a trend in agricultural drought is observed for the inland region where water supply is mainly dependent on local precipitation. This trend is driven by strong trends in temperature and global radiation rather than a trend in precipitation, resulting in an overall trend in potential evapotranspiration. Climate model analyses confirm that this trend in agricultural drought can at least in part be attributed to global climate change.
Export citation and abstract BibTeX RIS

Original content from this work may be used under the terms of the Creative Commons Attribution 4.0 license. Any further distribution of this work must maintain attribution to the author(s) and the title of the work, journal citation and DOI.
1. Introduction
The summer of 2018 in northwestern Europe was characterised by long-lasting large scale high pressure conditions, leading to dry and hot weather over large parts of the continent (WWA 2018, Kornhuber et al 2019, Vogel et al 2019). In the Netherlands each month in the period April to September was above average warm; in May, June, July, September and October it was also drier than normal (figure 1(a) and (b)) (Sluijter et al 2018). The combination of warm and dry conditions led to high values of drought indicators such as the precipitation shortfall (the cumulative potential evapotranspiration minus precipitation, set to zero if smaller than zero; in the Netherlands referred to as 'neerslagtekort' and in hydrology referred to as 'precipitation deficit'). Precipitation shortfall (neerslagtekort) is commonly used as a drought indicator in the Netherlands (figure 1(c)). The precipitation shortfall was larger in the south and east of the country than in the west because of lower precipitation values, higher temperatures and more sunshine (figure 2).
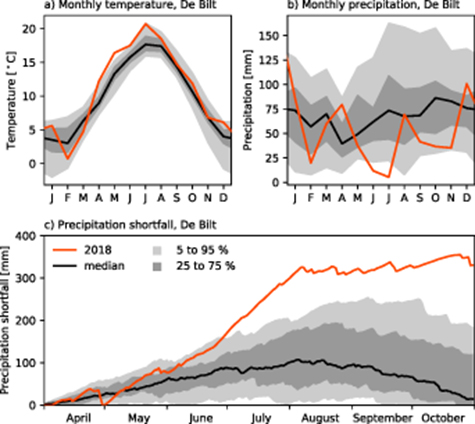
Figure 1. Time series of (a) monthly temperature [°C], (b) monthly precipitation [mm] and (c) daily precipitation shortfall (cumulative potential evapotranspiration minus precipitation, set to zero if smaller than zero) [mm] for station De Bilt. Grey shading and the black line show the climatological distribution based on years 1981–2010. Country averaged data indicates a similar drought signal (not shown).
Download figure:
Standard image High-resolution image
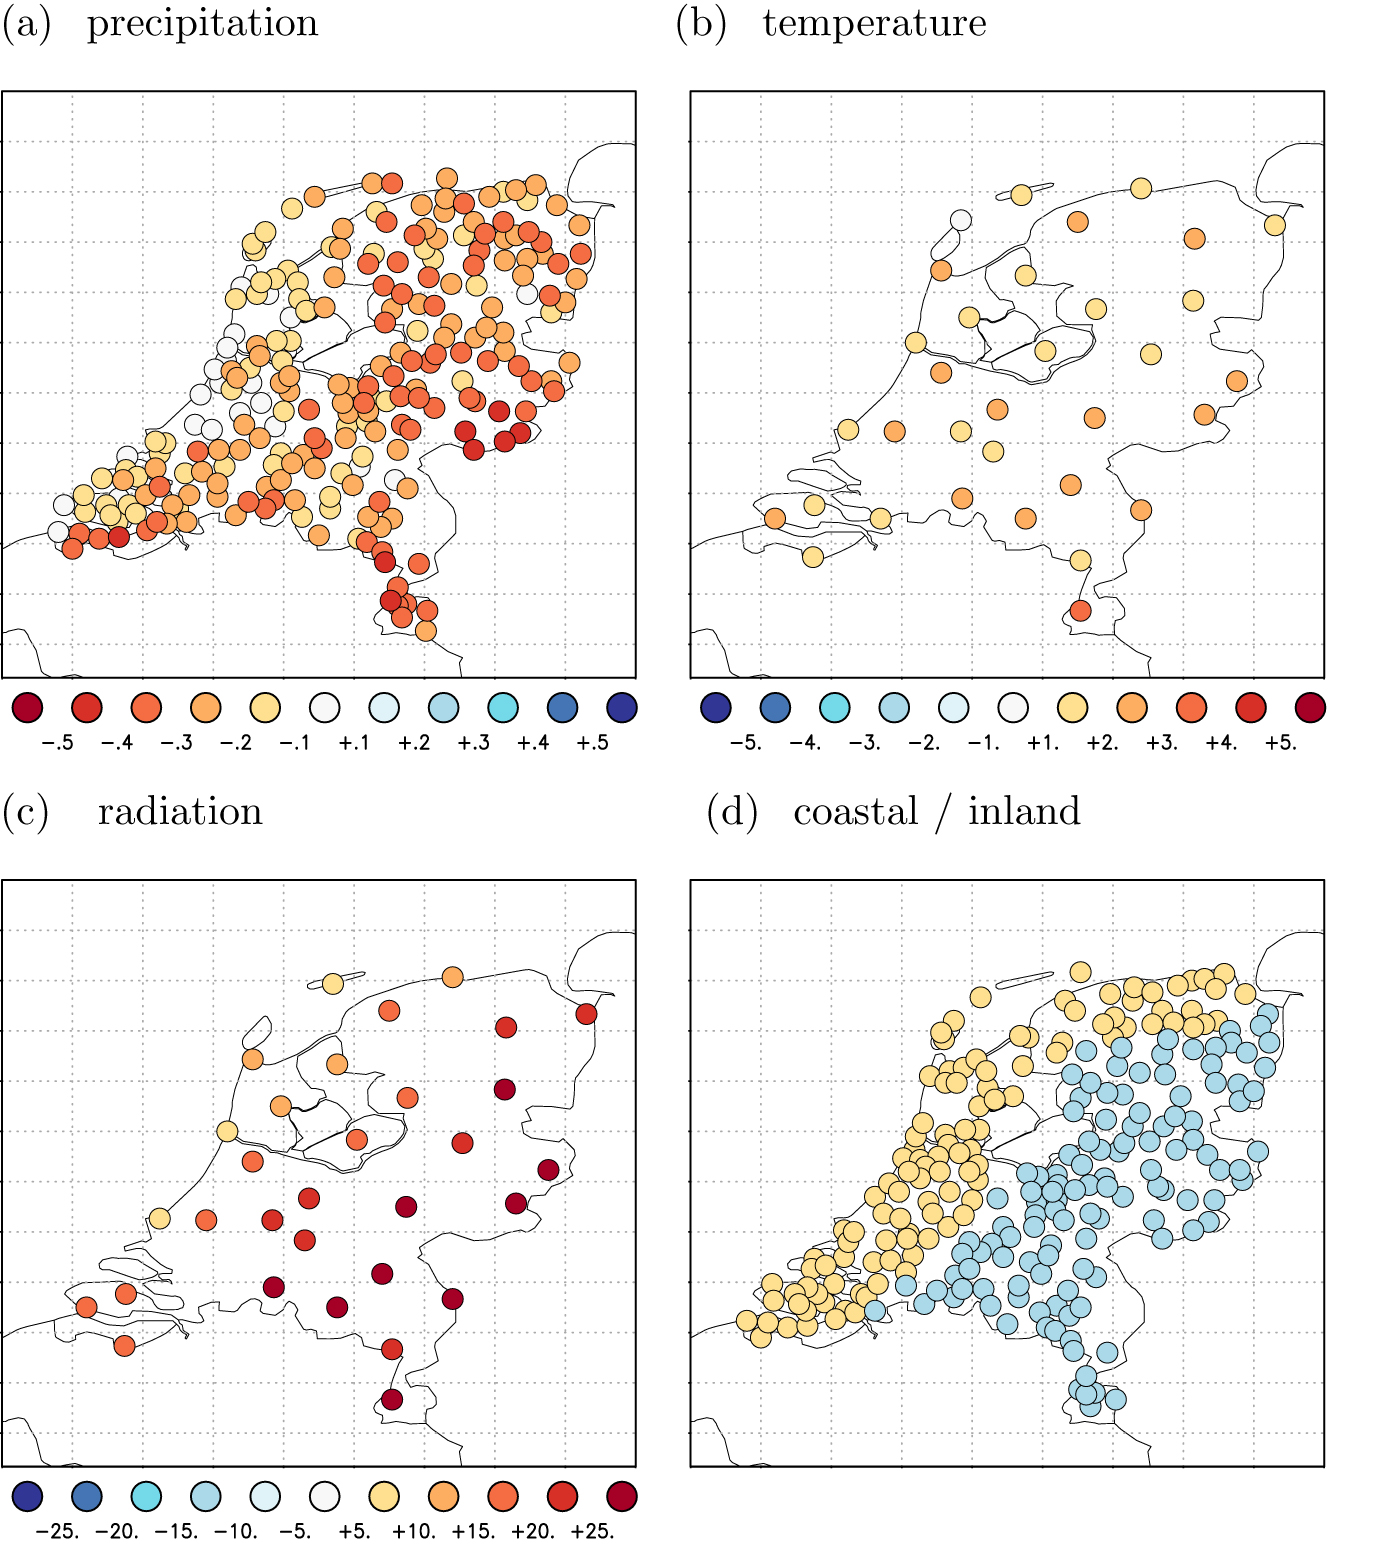
Figure 2. Summer mean (Apr-Sep) anomalies in 2018 for (a) precipitation [fraction], (b) temperature in [°C] and (c) global radiation in [W/m2] at KNMI stations and (d) map of coastal (yellow) and inland (blue) stations.
Download figure:
Standard image High-resolution imageThe 2018 drought negatively impacted different Dutch sectors. In the agricultural sector a large precipitation shortfall, decreasing water quality and availability impacted crop yields and grassland. The financial effects on farmers' income varied widely due to differences in local drought impacts, their vulnerability and potential mitigation options. Shipping was affected by low river water levels which limited the load river barges could carry, reduced capacity and higher prices resulted in increased income for the shipping sector but higher costs for customers. Reduced quality and quantity of surface waters impacted drinking water facilities, recreation and natural ecosystems. Low groundwater tables led to increased land subsidence and damaged hundreds of houses in urban areas. As a result/consequence, total economic loss was estimated to be between 450 and 2080 million Euros (Ecorys 2018).
It is obvious that extreme drought events have large consequences for the economy and affect different sectors. Therefore, a pressing societal question is whether or not events like the 2018 drought are linked to climate change and hence can be expected to occur more frequently in the future. In this paper we aim to answer the question 'have increasing global temperatures contributed to changes in meteorological and agricultural droughts as severe or worse than the 2018 drought in the coastal or the inland region of the Netherlands?'. We assess whether or not trends in four variables related to drought severity—precipitation, temperature, potential evapotranspiration (PET) and soil moisture—can be attributed to global warming. Because drought propagates through the hydrological cycle it is important to quantify the trends in all four of these components, to fully understand if drought occurrence is changing and which factors are most influential. As the impact of different drought types is strongly related to the affected sectors (Van Loon et al 2016), we aim to provide a complete overview of trends in meteorological droughts (lack of precipitation) and agricultural droughts (described in this paper by trends in soil moisture and PET).
In-depth trend attribution analyses of precipitation or other drought-related variables have so far focused on country-wide averages (Sluijter et al 2018). Over the 20th century increasing summer precipitation and increasing PET, via rising temperatures and sunnier summers, have to a large extent compensated each other, consequently there is no trend in country-wide precipitation shortfall. However, Daniels et al (2014) and Lenderink et al (2009) show that in the Netherlands, the influence of SST on precipitation trends resulted in differences in precipitation between the coastal and inland regions and this is likely related to the land-sea temperature contrast. Lenderink et al (2009) indicate that the influence of SST on precipitation trends is particularly strong in the coastal area less than 30–50 km from the coastline. This is confirmed by van Haren et al (2012) for trends in summer precipitation in western Europe. In this paper, for the first time we analyse trends in the coastal and inland regions separately, with a focus on the inland region. Attribution analyses are performed on trends in different indicators of meteorological drought and agricultural drought in the inland region.
Mitigation of potential impacts of meteorological drought is often possible in the low-lying, mainly western, parts of the Netherlands using discharge from the rivers Rhine and to a much smaller extent Meuse. Therefore we include an analysis of observed discharge at Lobith and precipitation over the Rhine catchment upstream of Lobith. The eastern parts of the Netherlands have a higher dependency on precipitation for drought mitigation as their elevation is above the river level and thus Rhine water can not reach these areas without pumping. This strongly limits the possibilities for drought mitigation and thus makes these regions more vulnerable to local meteorological drought.
2. Data and study region
We use public Dutch station data for the period 1951–2019 available from KNMI. Variables that are analyzed include homogenized precipitation and mean temperature, global radiation (total downward shortwave radiation) and Makkink PET. Makkink PET is a measure that is mainly dependent on radiation and temperature. We additionally use Rhine discharge at Lobith.
Furthermore, we analyse four different gridded variables: precipitation, temperature, PET and soil moisture. Soil moisture and PET are estimated using data-model chains, using readily available PET data, see also section 5 for a discussion of PET-schemes. For trend calculations we use monthly datasets that are readily available and sufficiently complete for a period of at least 35 years. All gridded datasets used in this study are shown in figure 3 and listed below.

Figure 3. Gridded datasets used in this paper. Left: observational and reanalysis datasets, right: climate model datasets. Listed under PET is the PET scheme (PT: Priestley-Taylor, PM: Penman-Monteith, H: Hamon, B: Bulk formula, M: Makkink), under SM is the depth in meters of the soil moisture layer used (RD: depends on rooting depth, predominantly 1 m for WaterGAP2). Shading indicates an experiment with either multiple input datasets or multiple hydrological models. The number of resulting hydrological model simulations are indicated by horizontal lines on the right side of the figure.
Download figure:
Standard image High-resolution imageFor observations and reanalyses we use (see table 1 and Supplementary Information (SI) (stacks.iop.org/ERL/15/094081/mmedia) for more detailed explanations):
- For precipitation: KNMI rain gauges and E-OBS (1950-2018),
- For near-surface temperature: KNMI station data and E-OBS,
- For PET: CLM-ERA-I (1979-2016), CLM-WFDEI (1979-2013), MERRA-2 RefET (1980-2018) and ERA-I (1979-2018),
- For soil moisture: CLM-ERA-I, CLM-WFDEI, FLDAS and two ISIMIP runs with WFDEI reanalysis input (1971-2010) (PCRGLOB-WFDEI and LPJmL-WFDEI).
Table 1. Data used in this study.
| Dataset | Full name | Time period monthly data | Spatial resolution (° lat x ° lon) | Reference |
|---|---|---|---|---|
| Observational/reanalysis data | ||||
| E-OBS | E-OBS European gridded dataset for temperature, precipitation and sea-level pressure | 1950-2018 | 0.25x0.25 | (Cornes et al 2018) |
| WFDEI | WATCH-Forcing-Data-ERA-Interim | 1979-2013 | 0.5x0.5 | (Weedon et al 2011, Weedon et al 2014) |
| ERA-I | ERA-Interim | 1979-2018 | 0.5x0.5 | (Dee et al 2011) |
| MERRA-2 | Modern-Era Retrospective analysis for Research and Applications, Version 2 | 1980-2018 | 0.5x0.625 | (Hobbins et al 2018) |
| GCMs/RCMs | ||||
| GFDL | GFDL-ESM2M | 1860-2100 | 2.02x2.5 | (Dunne et al 2012, Dunne et al 2013) |
| HadGEM | HadGEM2-ES | 1860-2100 | 1.25x1.88 | (Jones et al 2011) |
| IPSL | IPSL-CM5A-LR | 1850-2100 | 1.89x3.75 | (Dufresne et al 2013) |
| MIROC | MIROC5 | 1850-2100 | 1.4x1.4 | (Watanabe et al 2010) |
| EC-Earth | EC-Earth 2.3 | 1860-2100 | 1.12x1.125 | (Hazeleger et al 2012) |
| RACMO | KNMI-RACMO2 | 1950-2100 | 0.11x0.11 | (Lenderink et al 2014) |
| Hydro/impact models | ||||
| CLM | Community Land Model version 4 | 1979-2013 (WFDEI)/ 2016 (ERA-I) | 0.5x0.5 | (Lawrence et al 2011, Oleson et al 2010) |
| FLDAS | Famine Early Warning Systems Network (FEWS NET) Land Data Assimilation System | 1981-2018 | 0.1x0.1 | (McNally et al 2017) |
| Ref-ET | Reference Evapotranspiration | 1980-2018 | 0.125x0.125 | (Hobbins et al 2018) |
| H08 | H08 | 1861-2018 | 0.5x0.5 | (Hanasaki et al 2008a, Hanasaki et al 2008b) |
| LPJmL | Lund-Potsdam-Jena managed Land | 1861-2018 | 0.5x0.5 | (Bondeau et al 2007, Rost et al 2008, Schaphoff et al 2013) |
| PCRGLOB | PCRGLOB-WB; PCRaster GLOBal Water Balance model | 1861-2018 | 0.5x0.5 | (Sutanudjaja et al 2018) |
| WaterGAP2 | Water Global Analysis and Progress Model version 2 | 1861-2018 | 0.5x0.5 | (Müller Schmied et al 2016) |
For climate model data the following simulations are used:
- 16 (4 GCMs × 4 hydrological models) transient runs from the ISIMIP ensemble that have data available for both soil moisture and PET, we also use daily mean near-surface temperature and precipitation series for these ISIMIP runs,
- The combination EC-Earth / PCR-GLOBWB (van der Wiel et al 2019) for all four variables,
- The 16-member RACMO ensemble (Lenderink et al 2014) for PET and soil moisture.
Based on Lenderink et al (2009), the Dutch coastal region is defined by the area up to 50 km from the North Sea, or, to make sure this is well into the mainland for land bordering the Wadden Sea, at least 30 km from the Wadden Sea and covers about 45% of the country. The inland region is defined to be the remainder of the country. Variables are averaged over either the Dutch coastal or the Dutch inland region, to see if trends in drought variables vary as a result of the coastal influence.
3. Methods
Except for some details, the methods used in this article are described in detail in Kew et al (2019a), where they were used in a similar way as in the current paper, including the use of mostly the same datasets. The method is also extensively explained in van Oldenborgh et al (2018) and van der Wiel et al (2017), two method overview papers are in preparation (van Oldenborgh et al 2019, Philip et al 2019). For completeness we give a short summary below. A list of assumptions is given in the SI.
To attribute the 2018 drought to climate change we use a multi-method, multi-model approach. We calculate trends with respect to Global Mean Surface Temperature (GMST) for all variables and all datasets and synthesize results into one overarching attribution statement. The analysis steps include: (i) trend calculation from observations; (ii) model validation; (iii) multi-method multi-model attribution and (iv) synthesis of the attribution statement.
In this study, we statistically model (i.e. fit) the dependency of Apr-Sep means of the four drought related variables on smoothed GMST, (the model GMST for model data and GISTEMP surface temperature GMST (Hansen et al 2010) for observational and reanalyses data) as follows (see also van Oldenborgh et al 2019, Philip et al 2019):
We fit the following probability distributions:
- for precipitation: a Gaussian distribution that scales with GMST, focussing on low values,
- for temperature: a Gaussian distribution that shifts with GMST, focussing on high values,
- for PET: a Gaussian distribution that scales with GMST, focussing on high values and
- for soil moisture: a Gaussian distribution that scales with GMST, focussing on low values.
When the distribution is shifted (for temperature), a linear trend is fitted by making the location parameter µ dependent on GMST as

with α in [units of the study variable]/K. When the distribution is scaled (for precipitation, PET, soil moisture, discharge),


which keeps the ratio of the location and scale parameter σ/µ invariant. In each case, the distribution fitted to all data is evaluated twice: once for the year 1950 and once for the year 2018. This period captures most of the anthropogenic heating as a result of anthropogenic greenhouse gas emissions (1.05 K between 1950 and 2018). Trends are given as absolute differences for temperature and as relative percentage changes for precipitation, PET and soil moisture, between the years 2018 and 1950. Note that for some positive-definite variables—e.g. precipitation and variables that depend strongly on precipitation such as soil moisture and PET—it is more appropriate to scale rather than shift the distribution with GMST (see van Oldenborgh et al 2019, Philip et al 2019, for an explanation). The scaling method is also applied to the discharge dataset.
As an example, figure 4 shows the fits for the E-OBS inland precipitation series. The magnitude of the 2018 event was 1.46 mm/day or 267 mm/6 months, which is shown as a magenta square in (a) or horizontal line in (b). Using the full data series, scaled up to the climate of 2018 and down to the climate of 1950, we compute the return periods. This gives a return period of 20 years in the present climate (95% confidence interval, CI, of 9 to 80 years). Note that this is the frequency of events at least as dry as what was experienced in 2018. With a change since 1950 of −1 % (95% CI −13 % to +14 %) the observational data show no significant trend in inland precipitation.
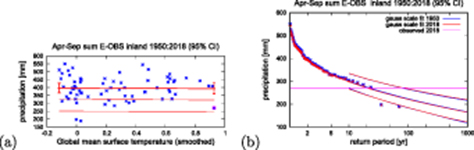
Figure 4. Illustrative example of the fitting method for E-OBS sum of Apr-Sep precipitation in [mm/6 months] averaged over the inland region, using a Gauss fit and looking at the low tail. (a) Apr-Sep averaged data (stars) against GMST and fit lines - the location parameter µ (thick) and the 6 and 40 yr return values (thin lines). Vertical bars indicate the 95% confidence interval on the location parameter µ at the two reference years 2018 and 1950. The magenta square illustrates the magnitude of the 2018 precipitation event. (b) Return period diagram for the fitted distribution and 95% confidence intervals, for reference years 2018 (red lines) and 1950 (blue lines). The data is plotted twice, scaled with smoothed global mean temperature up to 2018 (red crosses) and down to 1950 (blue crosses). The horizontal magenta line illustrates the magnitude of the 2018 precipitation event.
Download figure:
Standard image High-resolution imageAll model data were subjected to two validation tests—a qualitative test on the seasonal cycle and a stronger test on variability, see SI for details—models that did not pass the tests were disregarded. Trends from the time series that passed the validation tests are shown in section 4.
We synthesize the trends of all data using the same method as in Kew et al (2019a). Observed trends and modeled trends are synthesised separately into one consolidated value for the observations (including reanalyses) and a value for the modeled trends. These two results are then combined into a single result, see also the SI.
4. Results
4.1. Spatial trend analysis of station data
In this section we discuss a spatial analysis of four sets of Dutch station data: precipitation, temperature, global radiation and Makkink PET. Furthermore we analyse discharge at Lobith and precipitation over the Rhine basin.
Mapping relative regressions (regression/mean) of precipitation with respect to GMST from individual stations in the Netherlands (figure 5(a)) shows that there are differences between coastal and inland regions in trends in summer-half year (Apr-Sep) precipitation. The coastal stations show a positive trend of up to 25% per degree GMST rise towards a wetter summer climate, whereas the inland stations show negligible or even significant negative trends (p 0.1).
0.1).
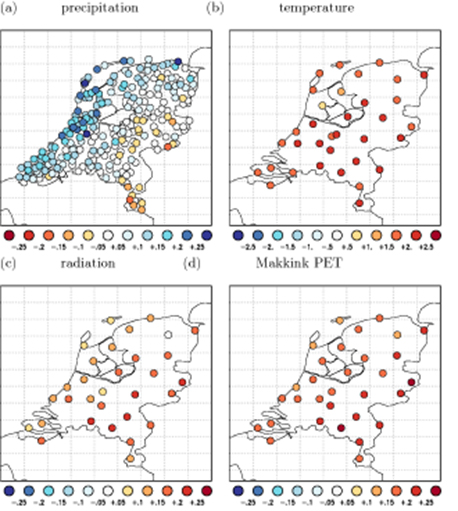
Figure 5. Relative regressions against GMST for Dutch station data averaged for Apr-Sep (a) precipitation, (b) mean temperature (absolute regression), (c) global radiation and (d) Makkink PET. Note that all values, including non-significant values are shown. Only stations with at least 20 years of data are included, for precipitation this is mostly from 1951, for radiation it is often available from around 1970 or 1990.
Download figure:
Standard image High-resolution imageBoth the coastal and the inland regions show a positive trend in summer temperature up to 2.5 K/K (figure 5b) and positive trends in Makkink PET and incoming radiation up to around 25 %/K (figure 5c,d). Note that a positive trend in sunshine duration or incoming radiation enhances local temperatures and Makkink PET both directly and indirectly through the higher temperatures (e.g. van Oldenborgh et al 2009, van den Besselaar et al 2015).
Averaging the precipitation stations over the inland and coastal areas gives summer trends of 1 ± 15 %/K (in agreement with the E-OBS trend discussed in section 3) and 12 ± 16 %/K respectively. The latter is only significantly different from zero at p < 0.1, but the trend in the difference between these two series is significant at p < 0.01 at −0.22 ± 0.14 mm/day. This implies that the difference in precipitation between coast and inland is very unlikely caused by natural variability.
The difference in temperature trends between coast and inland is small and dataset-dependent. The trends in global radiation at inland stations is larger than at the coast. After 1985 this is mainly due to the clearer skies since aerosol pollution peaked around that time in the Netherlands. However, there is enough data before 1985 to show that the underlying positive trend (van Oldenborgh et al 2009) is also stronger inland. Overall the trend averaged over the inland stations is 7 ± 4 W/m2/K higher than over the coastal ones over 1965–2019, where it should be noticed that the number of stations in the early part is low. This difference in trends is qualitatively confirmed by the ERA5 and 20CRv3 reanalysis (Slivinski et al 2019). We expect both the lower precipitation trends and higher global radiation trends in the inland region to contribute to more risk of high precipitation shortfall, this is quantified in section 4.3.
Although the focus of this analysis is on meteorological and agricultural drought in the Netherlands, low river discharge affects water availability in the low-lying parts of the Netherlands and also had other socio-economic impacts during the drought of 2018. We therefore include a trend analysis of the Rhine river discharge at Lobith and of the precipitation over the Rhine catchment averaged over the summer season. It is beyond the scope of this article do a full attribution study of these two variables.
Based on data from 1901 to 2019, there is a negative trend in Apr-Sep averaged discharge at Lobith of −9 % (95% CI −18 to 2 %) over the period between 1950–2018. However, it is only significant at p < 0.1. E-OBS precipitation (Apr-Sep average) over the Rhine catchment has a significant negative trend of −14 % (−23 % to −3 %) between 1950 and 2018. Although there is a trend towards less precipitation over the Rhine catchment, the variability in discharge at Lobith is large and possibly other factors compensate this trend, so that we only find a non-significant trend towards lower Apr-Sep discharge averages at Lobith.
4.2. Detection of trends in the coastal region
For the coastal region the return period of the 2018 drought in E-OBS precipitation was only 10 years (95% CI 5 to 30 years), which is less extreme than the inland precipitation event analysed in section 3. The trend in summer precipitation for the coastal region calculated from E-OBS only is 8 % (95% CI −6% to 26 %). Although this trend is stronger than the inland region, towards a wetter coastal climate, it is not significant. For verification purposes, we repeated this analysis using Dutch precipitation stations selecting and aggregating over the stations in the coastal region (note that E-OBS leaves out many coastal stations as they fall in sea grid boxes). The trend is slightly larger (9 % (95% CI −5 to 27% )), only significant at p < 0.1.
The climate models and especially the relatively coarse global models that are used to drive the ISIMIP models, do not describe the coastal effects in precipitation well enough to trust the results for this region (e.g. Lenderink et al 2009, van Haren et al 2012). Therefore we do not analyse precipitation and the other variables further in models. Unfortunately, this means we cannot make an attribution statement on meteorological drought in the coastal region. However, as large bodies of surface water and upstream water via the river Rhine are available in this region, the impact of a meteorological drought is relatively small as precipitation only accounts for a small fraction of the available water for irrigation in this region.
4.3. Detection and attribution of trends in the inland region
In this section we first briefly describe the most important results of the observational trend analysis and we mention the decisions we made related to that. Next, we present the attribution synthesis figure for the inland region. We do this for each of the four variables—precipitation, temperature, PET and soil moisture.
As shown in section 3 the return period of the 2018 inland precipitation event was 20 years (figure 4). (Figure 6a) shows trends (percentage change) in precipitation for observations and models that passed the validation tests. As for the coastal precipitation data, using inland stations instead of E-OBS does not lead to a different conclusion on the observed trend. The confidence interval in the trend calculated from observations is so large that it encompasses all model-trends. As the climate models are consistent with the observation within the uncertainties due to natural variability, we use the weighted average of observations and models. For precipitation we conclude from the synthesis of observation and model results that there is a small positive but non-significant trend towards a wetter inland climate of 1.6 % (95% CI −1.2 % to 4.4 %). Looking forward, the climate models do not agree on the sign of a trend in low precipitation values in the future.
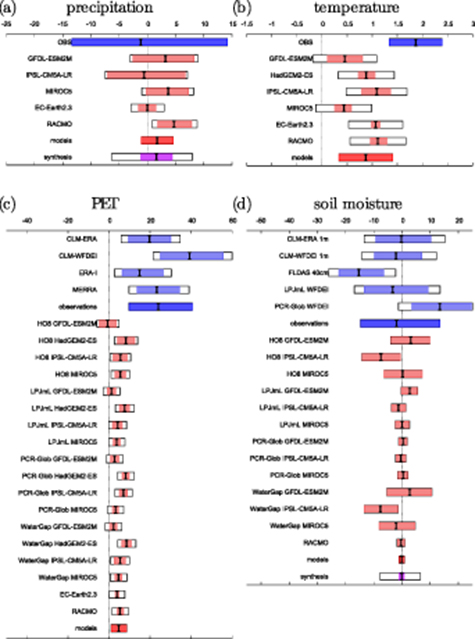
Figure 6. Synthesized values of trends per degree GMST rise for (a) precipitation [percentage change], (b) temperature [absolute change in K], (c) PET [percentage change] and (d) soil moisture [percentage change]. Black bars are the average trends, colored boxes denote the 95% CI. Blue represents observations and reanalyses, red represents models. Coloured bars denote natural variability, white boxes also take representativity or model errors into account (only if applicable). In the synthesis, the magenta bar denotes the weighted average (weighted with the inverse total variances) of observations and models and the white box denotes the unweighted average. Soil moisture trends are based on standardized data, the other trends on absolute values.
Download figure:
Standard image High-resolution image
The summer half year of 2018 was warm in the inland region; the return period of the 2018 event was 75 years (95% CI 15 to 1100 years). Figure (6b) shows the trends (absolute change) in mean temperature for observations and models. We note that the calculated trend is systematically lower in climate models than in observations. The trend calculated from E-OBS is 1.9 K (95% CI 1.3 K to 2.4 K). The average trend in climate models is 0.9 K (95% CI 0.3 K to 1.4 K), which is about 50 % less than the observed trend. We thus conclude that there is a trend towards higher summer mean temperatures. At least half of this can be attributed to human induced climate change.
As a consequence of using different PET-schemes the value for PET and the corresponding return period for 2018 is less well defined. Most trends shown in figure (6c) are clearly positive, as expected from the positive trend in temperature. As for temperature, the trends in the climate models are lower than the trends in observation-based PET.
For soil moisture, the uncertainty in the trends calculated with observed input is very large and clearly around zero ((figure 6d)). The averaged trend calculated with input from the models also encompasses zero. We thus conclude there is no significant trend in soil moisture over the inland region, but uncertainties are high.
5. Discussion
No trend can be found in observed inland summer precipitation. This is in agreement with climate model results. For the future, some of these climate models show a large decrease in precipitation due to a shift towards more easterly circulation types (Haarsma et al 2009). The KNMI’14 climate scenarios for the Netherlands, based on the CMIP5 models, therefore span the range from a small increase to a large decrease in summer precipitation.
Using Mar-Sep instead of Apr-Sep does not change the spatial pattern of precipitation trends (not shown). For farmers, a change in precipitation in March could make a big difference on the amount of available soil moisture in the rootzone at the start of the growing season and for that reason a more in depth analysis on this month would be of value. However, as in the Netherlands shortage is traditionally measured from Apr-Sep, we have chosen to focus on Apr-Sep here.
The observed and modeled synthesized values for the trend in temperature differ by a factor of two and can therefore not be combined. This is a well known problem in climate models for this region, (e.g. van Oldenborgh et al 2009, Bhend and Whetton 2013, van Oldenborgh et al 2013, Kew et al Kew, et al., 2019b). Our conclusion that half of the observed trend can be attributed to human induced climate change, points to the fact that models do not show the same trend as observed. This could be due to errors in model structure or parameterization causing systematic biases or due to factors other than human induced climate change that cause an additional trend in the observations. Therefore, based on the current model runs, we can not decide what is the origin of half of the trend seen in observations.
In our analysis we use different PET schemes, as each hydrological modeling group that contributed to the ISIMIP data store provided PET data using its own prescribed PET-scheme. As a consequence, we compare different measures. We can therefore not compare absolute values in PET. However, the differences in trends in these different datasets are smaller when using the same driving GCM with different hydrological models (with different PET-scheme) than when using one hydrological model (and one PET-scheme) with different driving GCMs. For instance, the difference between HO8-GFDL-ESM2M and HO8-HadGEM2-ES is larger than the difference between HO8-GFDL-ESM2M and LPJmL-GFDL-ESM2M, see figure 6(c). This was also found in an earlier study (Kew et al 2019a). We therefore conclude that the driving factor for the differences between modelled PET trends stems mainly from the GCM realizations, rather than from the PET schematization.
As a result of the discrepancy between modeled and observed trends in temperature it is very likely that there will also be a discrepancy in trends in PET and soil moisture between climate models and observations. Indeed, trends in PET are lower in models than in observations. Nevertheless, the sign of the trend is clear. It is however not easy to quantify the influence of this trend on agriculture, nature etc In soil moisture the influence of the lower temperature trends in models is less clear.
Soil moisture is important for crop health. If sufficient water is available from open water or groundwater, (agricultural) areas can be irrigated. In that case soil moisture is no longer directly dependent on precipitation, but also depends on irrigation amounts. In that sense PET (or the precipitation shortfall P- PET) is more directly related to the drought under irrigation, than soil moisture values. To avoid adding up uncertainties, we have only shown trends in precipitation and PET separately rather than trends in P- PET.
For soil moisture either very local measurements or satellite measurements that only measure the top few centimeters are available. Furthermore, most observed soil moisture time series are too short to use for reliable trend analyses. Therefore we used reanalysis data instead of observations, consequently model validation was not possible. Another limitation in using soil moisture for a trend analysis is that if temperature rises and soil moisture is already low, soil moisture values cannot become much lower, since the vegetation can no longer extract water from the unsaturated zone. Based on these limitations and the fact that irrigation is common in the Netherlands, the precipitation shortfall P- PET is likely to be more useful as a drought measure than soil moisture.
6. Conclusions
While most studies of drought in the Netherlands use the whole country to study trends in precipitation, we have shown that there is a significant difference in trends in Apr-Sep precipitation between the coastal region and inland region. This distinction is also visible but not statistically significant in trends in Makkink PET, which combines trends in temperature and radiation. We have therefore analysed the coastal and inland regions separately, for four different drought related variables.
The coastal region is marked by a trend towards higher Apr-Sep precipitation values. A formal attribution study was not possible for this region, because most of the climate models used in this study—which are also used as drivers for the hydrological models—do not capture this coastal effect. This coastal region can often use water from the Rhine river for irrigation to mitigate drought effects and are therefore less sensitive to reduced precipitation. We find a non-significant negative trend in Apr-Sep Rhine discharge at the Dutch-German border.
For the inland region, no significant trends in precipitation or soil moisture were found. The synthesized (non-significant) trend towards more precipitation is 1.6 % (95% CI −1.2 % to 4.4 %). In soil moisture we find no trend, but the uncertainties are large. For temperature, there is a clear trend, although climate models do not capture the size of the observed trend; the trend calculated from E-OBS observations is 1.9 K (95% CI 1.3 K to 2.4 K), whereas the trend averaged over models is only 0.9 K (95% CI 0.3 K to 1.4 K). We therefore conclude that at least half of the trend towards higher Apr-Sep temperatures can be attributed to human induced climate change. Although there are other factors than temperature influencing PET, we expected a positive trend in PET given the trend in temperature. This is indeed what is found for the synthesized PET trends.
We thus conclude that although the trend in inland Apr-Sep precipitation is non-significant, agriculture droughts occur more frequently in 2018 than in 1950, which is due to trends towards higher temperatures and PET. For the future, we can expect either a continuation of the past trends in drought variables or even stronger drying trends due to changes in atmospheric circulation. This will have implications for the sectors that are affected by agricultural droughts, as they will have to deal with this increase in summer agricultural droughts in the Netherlands.
Acknowledgments
We acknowledge Emma Aalbers for making available the RACMO ensemble model data. For their roles in producing, coordinating and making available the ISI-MIP model output, we acknowledge the modelling groups and the ISI-MIP coordination team. MERRA-2 data were developed by the Global Modeling and Assimilation Office (GMAO) at NASA Goddard Space Flight Center under funding from the NASA Modeling, Analysis and Prediction (MAP) program; the data are disseminated through the Goddard Earth Science Data and Information Services Center (GES DISC), preliminary data have been made available thanks to GMAO. We acknowledge the E-OBS dataset from the EU-FP6 project UERRA (http://www.uerra.eu) and the data providers in the ECA&D project (https://www.ecad.eu).
Data availability
The data that support the findings of this study are openly available at https://climexp.knmi.nl/droughtNL_timeseries.cgi.