

Abstract
Vegetation is responding to climate change, which is especially prominent in the Arctic. Vegetation change is manifest in different ways and varies regionally, depending on the characteristics of the investigated area. Although vegetation in some Arctic areas has been thoroughly investigated, central Chukotka (NE Siberia) with its highly diverse vegetation, mountainous landscape and deciduous needle-leaf treeline remains poorly explored, despite showing strong greening in remote-sensing products. Here we quantify recent vegetation compositional changes in central Chukotka over 15 years between 2000/2001/2002 and 2016/2017. We numerically related field-derived information on foliage projective cover (percentage cover) of different plant taxa from 52 vegetation plots to remote-sensing derived (Landsat) spectral indices (Normalised Difference Vegetation Index (NDVI), Normalised Difference Water Index (NDWI) and Normalised Difference Snow Index (NDSI)) using constrained ordination. Clustering of ordination scores resulted in four land-cover classes: (1) larch closed-canopy forest, (2) forest tundra and shrub tundra, (3) graminoid tundra and (4) prostrate herb tundra and barren areas. We produced land-cover maps for early (2000, 2001 or 2002) and recent (2016 or 2017) time-slices for four focus regions along the tundra-taiga vegetation gradient. Transition from graminoid tundra to forest tundra and shrub tundra is interpreted as shrubification and amounts to 20% area increase in the tundra-taiga zone and 40% area increase in the northern taiga. Major contributors of shrubification are alder, dwarf birch and some species of the heather family. Land-cover change from the forest tundra and shrub tundra class to the larch closed-canopy forest class is interpreted as tree infilling and is notable in the northern taiga. We find almost no land-cover changes in the present treeless tundra.
Export citation and abstract BibTeX RIS

Original content from this work may be used under the terms of the Creative Commons Attribution 4.0 license. Any further distribution of this work must maintain attribution to the author(s) and the title of the work, journal citation and DOI.
1. Introduction
The Arctic is undergoing strong climate change, which is especially prominent in high latitudes (IPCC 2018 and Overland et al 2014). Climate change is assumed to be the main driver of vegetation change in arctic and subarctic regions (Walker et al 2006). Accordingly, drastic changes have been predicted with simulations, including an increase of graminoid, shrub and tree abundance and northward movement of vegetation transition ecotones (van der Zhang et al 2013, Kolk et al 2016). Indeed, remote-sensing data shows vegetation greening (e.g. Jia et al 2003, 2009, Bunn and Goetz 2006, Zeng et al 2011). However, greening trends derived from spectral satellite data are complex (Myers-Smith et al 2020) and only with the help of field-based approaches can aspects of vegetation change such as composition, structure and biomass be investigated as, for example, in many arctic vegetation studies (Forbes et al 2010, Beck et al 2011, Myers-Smith et al 2011, Elmersdorf et al, 2012, Frost et al 2013, Moffat et al 2016). Regional-scale compositional vegetation-change analysis, thus, requires a direct combination of field-based measurements and remote-sensing data.
Studies from vast unexplored areas in eastern Eurasia are required as vegetation change varies regionally (Walker et al 2017). Most of the published field data on the vegetation of arctic and subarctic regions are restricted to northern North America. Some land-cover investigation studies are available for north-western Siberia, southern and north-western Chukotka (Frost and Epstein 2013), as well as eastern coastal Chukotka (Lin et al 2012), whereas central Chukotka remains largely unexplored. Unlike the North American boreal treeline represented by evergreen conifers, the Siberian treeline is formed by larch—a deciduous conifer which characterises the seasonal forest's carbon cycling and better tolerates ice blasting, fire, and excessive heat or cold conditions (Givnish 2002). Furthermore, larch forests typically have a low canopy cover, where understorey vegetation plays a greater role in the system's physical and biological properties (e.g. latent heat flux; Xue et al 2011). In contrast to most tundra-taiga areas investigated in eastern Siberia, central Chukotka has mountainous terrain. The treeline here is restricted by a combination of elevational and latitudinal limits. Within only 140 km, treeless tundra turns via forest tundra into taiga, covering a large gradient of vegetation communities, which have a patchy pattern. Therefore, this unique vegetation of central Chukotka should be investigated at a regional scale, not as separate communities.
Commonly, broad-scale arctic vegetation changes are extracted from optical satellite missions' data. Analyses of Advanced Very-High-Resolution Radiometer (AVHRR) data (Guay, 2014) show that greening in central Chukotka from 1982 to 2012 is particularly strong. Therefore, further research into vegetation change in this region is needed. Increase in Normalised Difference Vegetation Index (NDVI) is commonly interpreted as an increase in plant biomass, cover and abundance (Myers-Smith et al 2020). However, we aim to describe not only total cover change, but which taxa play major roles in it. Normalised Difference Water Index (NDWI) and Normalised Difference Snow Index (NDSI) of winter/spring scenes may derive more composition-specific differences than NDVI alone, considering vegetation moisture content and differentiating dense from open forests, respectively. It is an advantage if the classification scheme of vegetation types is not solely based on remote-sensing derived indices, but directly involves field data to ensure association of land-cover change with vegetation composition. Such an approach, in contrast to others, allows the inference of vegetation compositional changes independent from expert knowledge of vegetation types in the classifying area. Furthermore, it connects, statistically, satellite spectral information of different vegetation types and field-based taxonomical composition of these types. A model built this way is suitable to apply to areas with a similar vegetation composition.
We aim to provide quantitative information on landscape-scale compositional vegetation changes in central Chukotka over 15 years starting in 2000. We built an ordination model coupling field-based foliage projective cover data with Landsat spectral indices and used the model scores to generate a land-cover classification. This allowed us to map vegetation types across four focus areas for two time slices and derive land-cover change from the difference maps. The results were used to answer i) what kind of changes in vegetation composition have happen within the investigated 15 years in central Chukotka and ii) what is the magnitude of these changes?
2. Materials and methods
In this study we used two sources of data: field foliage projective cover of selected taxa and Landsat satellite data. The foliage projective cover data were used to build a statistical model, which formed the basis of vegetation classes using Landsat Indices as an input. The general scheme of data processing is presented in figure 1.

Figure 1. Scheme of the data and methods used in the study. Transformed and topographically corrected Landsat data and field data on projective cover were used in the ordination (redundancy analysis, RDA) model. The scores of the RDA model were used in the k-means and fuzzy c-means classification. Derived hard clusters were applied to Landsat images from 2000/2001/2002 and 2016/2017 to predict land-cover classes from remote-sensing data. From these land-cover maps we derived change maps.
Download figure:
Standard image High-resolution image2.1. Field data collection and processing
The study area is in central Chukotka, NE Siberia, Russia (figure 1). Large parts of the region are characterised by mountain complexes. Central Chukotka has a continental type of climate: cold winters with average January temperatures of −30 °C, summers with average July temperature of +13 °C, short growing seasons (100 d yr–1) and low precipitation (200 mm yr–1; Menne et al 2012a, Menne et al 2012b).
Vegetation data were collected during the Russian-German expedition in summer 2016 (Kruse and Stoof-Leichsenring 2016). Vegetation properties were investigated in four areas along a gradient (figure 2) from treeless mountainous tundra (16-KP-04, Lake Rauchuagytgyn area), via the tundra–taiga transition (16-KP-01, Lake Ilirney area; 16-KP-03, Nutenvut lakes area) to the northern taiga (16-KP-02, Bolshoy Anyuy river area). In total, 57 sites were investigated (Shevtsova et al 2019). The sites cover a large Landsat NDVI gradient (0.3–0.8) and differ in elevation (100–900 m a.s.l.), slope angle (0–54°) and aspect.

Figure 2. Chukotka district (Russia) and the sampling sites in the four focus areas: a) overview, b) 16-KP-04 (tundra, sites V40-58, total: 15 sites), c) 16-KP-01 (northern border of tundra–taiga transition, sites V1-V12, total: 12 sites), d) 16-KP-03 (southern border of tundra–taiga transition, sites V20-V39, total: 19 sites) and e) 16-KP-02 (northern taiga, sites V13-V19, total: 6 sites). Background (b–e): Landsat-8 quasi true Red Green Blue composites.
Download figure:
Standard image High-resolution imageThe 16-KP-04 focus area is in the Anadyr Mountains. It represents mostly mountainous terrain with elevation up to 1500 m a.s.l. and open tundra. The area around 16-KP-01 at Ilirney Lake, represents the tundra–taiga ecotone, which is characterised by diverse vegetation: open tundra, shrublands and forest tundra. The highest elevation is 1000 m a.s.l. 16-KP-03 is characterised mostly by open and forest tundra and mountainous areas (700–1000 m a.s.l) like 16-KP-01. 16-KP-02 belongs to the northern taiga biome with low mountains reaching an elevation of 300–500 m a.s.l. in the east. The river lowlands are covered by wetlands and uplands of forests and open land with visible fire scars.
For every field site, a detailed description of the vegetation was made (Shevtsova et al 2019). We used 52 sites (V01–V16, V18–V24, V26–V51, V54, V57–V58) from 57 investigated field-sites. Some sites were excluded due to their location in mountainous terrain being affected by shadows in the satellite images. During fieldwork we investigated vegetation in circular plots of 30 m in diameter. Within each plot, we sampled five 2 × 2 m subplots, with one subplot placed at the centre of the circle and the other four placed 7.5 m away in each of the cardinal directions. Foliage projective cover of tall (>100 cm) shrubs and trees was estimated for the entire plot, whereas foliage projective cover for all major taxa of the ground layer was estimated in each of the five 2 × 2 m subplots and averaged for each plot. To accommodate the absence of the same species at compared sites and to standardise data, we applied the Hellinger transformation (Legendre and Legendre 2012) to the foliage projective cover data.
2.2. Landsat data, pre-processing and spectral indices processing
Landsat collection 1 Level 2 imagery, processed by the United States Geological Survey (USGS) to surface reflectance with a 30-m spatial pixel ground resolution, provides the best available remote-sensing product covering long-time series at a landscape-scale spatial resolution. From the Landsat archive we extracted cloud-free acquisitions for the four focus areas from an early (years 2000/2001/2002) and late time-slice 2016/2017 (appendix A, table A1). We used only peak-summer acquisitions collected from mid-July to mid-August. We found only one cloudless or partly cloudless peak-summer acquisition from 2002 and one from 2017 for the 16-KP-04 area, one each from 2001 and 2016 for 16-KP-01 and 16-KP-03 and one from 2000 and 2016 for 16-KP-02. Apart from summer acquisitions, we selected cloudless snow-covered springtime acquisitions for the corresponding year and covering the same area as the peak-summer acquisitions.
Due to sensor problems on Landsat-7 since 2003 and the fact that Landsat-8 was launched in 2013 we needed to use both Landsat-7 and Landsat-8 data. To provide high consistency between the spectral bands of different Landsat missions, we applied the standard Landsat-7 to Landsat-8 transformation from Roy et al (2016), but we still observed a sensor-related bias. Therefore, we empirically derived new transformation coefficients. We used concurrent Landsat-7 (12.08.2013 and 14.08.2013) to Landsat-8 (13.08.2013 and 15.08.2013) acquisitions and conducted random sampling of 500 000 points (only land, avoiding noisy shadowed areas) to build linear regression models for each spectral band we used in the processing:
Where  is the transformed Landsat-8 OLI to Landsat-7 ETM +,
  is the original Landsat-8 OLI,
  is the green,
  the red,
  the near-infrared and
  the first short-wave infrared Landsat surface reflectance [0–1].
To the Landsat-7 and transformed Landsat-8 data we applied the topographical c-correction (Riano et al 2003) to compensate for differences in solar illumination due to topography. We derived solar-geometry related parameters (solar zenith angle and solar azimuth angle) from the Landsat metadata. The slope and aspect angles of slopes were calculated from the ASTER Global Digital Elevation (GDEM, Tachikawa et al 2011) with the same spatial 30 × 30 m pixel ground resolution as Landsat. Additionally, we masked clouds and water bodies in the Landsat spectral-band set using an optimised threshold in the NIR band.
These pre-processed Landsat spectral bands were used to calculate Landsat spectral indices (appendix C, table C1) from summer acquisitions.
2.3. Redundancy analysis (RDA) and classification approaches
The length of the first detrended correspondence analysis axis is equal to 2.55 standard deviation units meaning the field data in our case is distributed on a short linear gradient rather than a unimodal distribution (Borcard et al 2011). A suitable constrained ordination method for short gradients assuming linear species responses along the environmental gradients is redundancy analysis (RDA, Legendre and Legendre 2012). Using RDA, we related foliage projective cover data to the Landsat spectral indices by extraction of pixel values using the field sites' coordinates. The best parameters for the RDA model were chosen according to stepwise selection and analysis of variance.
We built up the classification based on RDA scores using two clustering approaches: k-means (hard classification, appendix D) and fuzzy c-means (soft classification; FCM; Bezdek 1981; appendix D). In both cases of clustering, compositionally similar data were arranged into groups according to similar behaviours of the explanatory Landsat data. In FCM classification we set a threshold of 0.6 and values exceeding this remained unclassified and were marked as uncertain (discussed in appendix D). The optimal number of statistically significant clusters for k-means classification was chosen according to the gap statistics method (Tibshirani et al 2001).
Based on hard classification we predicted cluster numbers for Landsat data from four focus areas for both early and late time slices. We obtained difference maps for each area reflecting changes in vegetation composition over the 15-year period. We interpreted the uncertainties that could appear in the land-cover classification in the study region using FCM results from 2016/2017. We validated the accuracy of the derived land-cover maps of 2016/2017 using field data from 2018 (appendix E).
3. Results
3.1. General characteristics of the vegetation field data
We observed dense forests, formed by larch (Larix cajanderi Mayr) often with characteristic fire scars in the 16-KP-02 area (Shevtsova et al 2019). Sparse forest tundra stands are common for the 16-KP-01 and 16-KP-03 areas. The sparse larch stands are commonly accompanied by low and dwarf shrubs: Salix spp., Betula nana L., Ledum palustre L., Vaccinium spp., Empetrum nigrum L. Elevational transitions between forest tundra and open tundra are often covered by patches of dwarf pine (Pinus pumila (Pall.) Regel). Open tundra on gentle slopes at lower elevations (540–700 m a.s.l) is graminoid rich and accompanied by dwarf Salix and Vaccinium. Intermediate elevations in mountain areas of 16-KP-01 (700–900 m a.s.l.) and 16-KP-03 (700–800 m a.s.l.) as well as lower elevations in 16-KP-04 (500–600 m a.s.l.) are dominated by Dryas octopetala L. accompanied by a selection of herbs (Poaceae, Fabacea, Astraceae etc) and become barren at higher elevations. Mosses are common everywhere, having highest relative abundance in open tundra.
3.2. Relating field data to Landsat spectral indices in the RDA model
Landsat spectral indices NDVI, NDWI and NDSI together explained 33% of the variance in the field vegetation data. All three of them explain a significant unique portion of the variance (table 1, figure 3). Adding further indices as explanatory variables to the RDA model did not improve the explained variance. Most of the variance (21%) of the field compositional data is explained by NDVI; NDWI and NDSI, explain around 7% and 5%, respectively. The Landsat spectral indices are distributed in the two RDA-axes space, where NDVI is negatively associated with the 1st RDA axis, NDWI positively with the 1st RDA axis and NDSI positively with the 2nd RDA axis. As axes 1 and 2 carry most information (29%) only these two RDA axes were retained for further analysis.
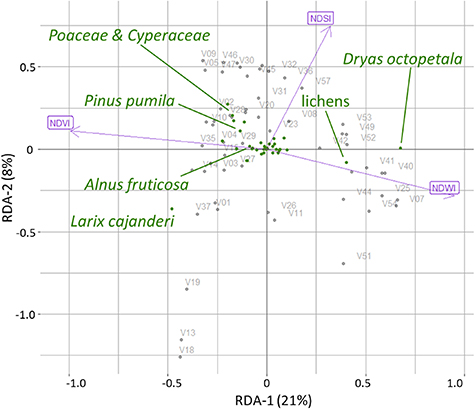
Figure 3. Redundancy analysis (RDA) model based on foliage projective cover data of the plot taxa and Landsat spectral indices (Normalised Difference Vegetation Index (NDVI), Normalised Difference Water Index (NDWI) and Normalised Difference Snow Index (NDSI)), where V01-V58 are the 52 vegetation field sites. The positions of the major taxa are shown.
Download figure:
Standard image High-resolution imageTable 1. Permutation test for the redundancy analysis (RDA) model with three indices as predictors: Normalised Difference Vegetation Index (NDVI), Normalised Difference Water Index (NDWI) and Normalised Difference Snow Index (NDSI) and their significance levels.
| Index | Variance | F | p-value |
|---|---|---|---|
| NDVI | 0.91 | 15.17 | 0.001 |
| NDWI | 0.03 | 5.13 | 0.001 |
| NDSI | 0.02 | 3.29 | 0.005 |
| Residual | 0.29 |
3.3. Land-cover classification
The k-means classification (figure 4) yielded four reasonable land-cover classes named 1) larch closed-canopy forest, 2) forest tundra and shrub tundra, 3) graminoid tundra, 4) prostrate herb tundra and barren areas.

Figure 4. K-means classes based on two redundancy analysis (RDA) axes using Normalised Difference Vegetation Index (NDVI), Normalised Difference Water Index (NDWI) and Normalised Difference Snow Index (NDSI) as predictors. Images: extracts from 360 × 180 degree panoramic images, Stefan Kruse.
Download figure:
Standard image High-resolution imageThe larch closed-canopy forest is characterised by the highest NDVI values ( ) and low NDSI (<0.6, figure 5). Despite the high biomass content, larch closed-canopy forests have generally poor biodiversity. The vegetation composition consists mostly of abundant L. cajanderi (20–70%) with moss or grass undergrowth (figure 6).
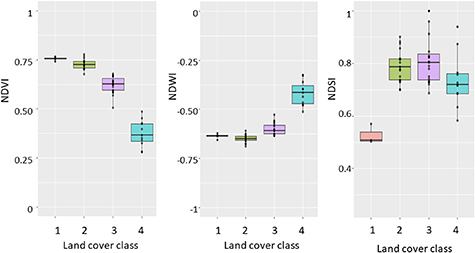
Figure 5. Value distribution of spectral Landsat indices (Normalised Difference Vegetation Index (NDVI), Normalised Difference Water Index (NDWI) and Normalised Difference Snow Index (NDSI)) by the four land cover classes: (1) larch closed-canopy forest, (2) forest tundra and shrub tundra, (3) graminoid tundra and (4) prostrate herb tundra and barren areas.
Download figure:
Standard image High-resolution image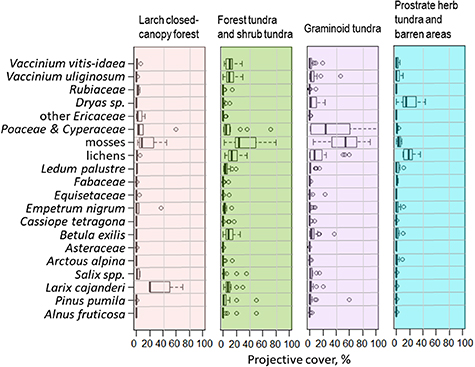
Figure 6. Foliage projective cover of the major taxa in four land-cover classes: larch closed-canopy forest, forest tundra and shrub tundra, graminoid tundra and prostrate herb tundra and barren areas.
Download figure:
Standard image High-resolution imageThe forest tundra and shrub tundra class is characterised by higher NDVI values (0.68–0.78), but in contrast to larch closed-canopy forest has a higher NDSI (>0.6). In the landscape it represents dense Alnus viridis ssp. fruticosa (Rupr.) Nyman or Pinus pumila shrub communities and open Larix cajanderi forest (<20% cover) with relatively high dwarf birch (Betula nana) abundance (5–25%), with heathers (Ledum palustre L., Vaccinium vitis-idaea L., V. uliginosum L.) and a lichen–moss ground layer.
The graminoid tundra is characterised by moderate to higher NDVI (0.5–0.68), higher NDWI than the first two classes and a higher NDSI (>0.6). This class represents hummock (Eriophorum vaginatum L.) and non-hummock (Carex spp.) graminoid tundra with moss prevailing in the ground layer.
The prostrate herb tundra and barren areas class is characterised by low NDVI (<0.5), very high NDWI (>0.5) and higher NDSI (>0.6). Prostrate herb tundra is dominated by Dryas octopetala and lichens accompanied by some herbs (Fabaceae, Orobanchaceae, Poaceae, Rosaceae, Saxifragaceae etc) and prostrate Salix spp. shrubs.
In the RDA model, larch closed-canopy forest is characterised by a combination of low axis-1 and axis-2 scores indicating high NDVI and low NDSI. NDSI increases along axis 2, indicating highly reflective surfaces covered by snow. High axis-2 scores in combination with low or moderate axis-1 scores indicate moderate to high NDVI, reflecting graminoid tundra or forest tundra and shrub tundra, respectively. The prostrate herb tundra and barren areas class is characterised by very high axis-1 scores originating from high NDWI and low NDVI caused by low biomass and dry barren land surface.
The validation of land-cover maps showed 66% agreement between class numbers predicted for validation sites in tundra and tundra-taiga from projective cover and from Landsat Indices (appendix E). The highest disagreement (19%) was obtained for prostrate herb tundra and barren areas that were misclassified as graminoid tundra when predicted from Landsat data.
3.4. Land-cover change between 2000 and 2017
Overall, the land cover in the treeless tundra (16-KP-04) has not significantly changed (<5%) from 2000 to 2017. In contrast, the forest tundra and shrub tundra class shows a major increase in area of up to 20%–25% in the tundra–taiga (16-KP-01, 16-KP-03). Larch closed-canopy forest expanded significantly in the northern taiga (16-KP-02) accompanied by an increase of forest and shrub tundra at higher elevations.
The northernmost area (16-KP-04) is today dominated by prostrate herb tundra and barren areas (59% in 2017) and graminoid tundra (36% in 2017, appendix F, figure F1). The change map (figure 7(a) between 2002 and 2017 indicates only a slight transition of graminoid tundra to forest and shrub tundra (4%).

Figure 7. Colour-coded land-cover classes and colour-coded land-cover change: a) 16-KP-04 (treeless tundra), b) 16-KP-01 (tundra–taiga transition), c) 16-KP-03 (tundra–taiga transition) and d) 16-KP-02 (northern taiga).
Download figure:
Standard image High-resolution imageIn the typical tundra–taiga transition (16-KP-01), a large part of the area is represented by open and forest tundra: graminoid tundra occupies 92% of the area in 2001 and 68% of the area in 2016; forest tundra and shrub tundra occupies only 3% of the area in 2001, whereas by 2016 it covered 27% (appendix F, figure F2). The change map of this area (figure 7(b)) indicates the expansion of forest and shrub tundra by 21% replacing the graminoid tundra from 2001 to 2016. It occurs mostly in the drain valleys and gentle slopes around Lake Ilirney and smaller lakes. South of Lake Ilirney we observe a change from graminoid tundra to prostrate herb tundra and barren areas due to road construction.
The southernmost location (16-KP-03) represents the tundra–taiga transition as well. In contrast to 16-KP-01, it has more prostrate herb tundra and barren areas (34% in 2001 and 29% in 2016, appendix F, figure F3). The change map (figure 7(c)) shows a transition from graminoid tundra to forest tundra and shrub tundra of 19% between 2001 and 2016. Almost no change in the prostrate herb tundra and barren areas is detected. The larch closed-canopy forest slightly expanded by 4% from 2001 to 2016.
The northern taiga 16-KP-02 area is covered by forest tundra and shrub tundra (39% in 2000 and 69% in 2016, appendix F, figure F4) and larch closed-canopy forest (5% in 2000 and 13% in 2016). The change map (figure 7(d)) from 2000 to 2016 indicates a 9% transition from forest tundra and shrub tundra to larch closed-canopy forest, as well as a 40% transition from graminoid tundra to forest tundra and shrub tundra.
4. Discussion
4.1. Dataset limitations and optimisation
Our approach yielded useful information on land-cover change despite facing several methodological challenges. We focussed on changes of major zonal vegetation types. Accordingly, azonal vegetation types were not investigated during fieldwork including polygonal tundra in lake depressions and floodplain vegetation, which are classified as graminoid tundra or forest and shrub tundra.
The vegetation survey plots were placed within an as homogenous as possible environment to represent broad land-cover classes and allow upscaling. However, heterogeneity in tundra and tundra–taiga landscapes is often higher than the spatial resolution of most of the remote-sensing products (Myers-Smith et al 2011, Frost et al 2014). Consequently, the spectral signal of a Landsat pixel with a spatial resolution of 30 × 30 m is mixed if different vegetation types are present within the pixel. For instance, the spectral signal of a green forest canopy with low red reflectance due to photosynthetic pigment absorption and high multiple NIR scattering and thus high NDVI values can be mixed with the high red and low NIR reflectance of a lichen understorey reducing NDVI for the plot (appendix G, figure G1). Also, Pinus pumila shrubland, a characteristic vegetation type in the investigated region, could hardly be distinguished by Landsat because it is usually found alongside sparse vegetation or bare ground and covers small patches of 25–800 m2. For example, dense healthy green P. pumila patches occur in V23 (16-KP-03), but a large percentage of the cover in the site is of white-coloured lichen. This causes a significant decrease in NIR and an increase in red reflectance, which results in lower NDVI values for the 30 × 30 m pixel (appendix G, figure G2).
Landsat-derived NDVI and NDWI selected for building the RDA model are known for their potential to reflect vegetation-related properties. The combination of red and NIR spectral bands used for the NDVI calculation highlights plant biomass and its chlorophyll content (Tucker 1979, Boelman, 2003). NDWI utilises green and NIR reflectance and reflects the water content (Lara, 2018). NDSI has been developed to indicate snow cover (Volovcin, 1976), although it has also been used for identifying dense forests without leaves, for example, in central Alaska (Hall et al 1998). In our data, spring-NDSI values of snow-covered landscapes helped to separate closed-canopy forests that are not covered by snow due to high standing wood from other vegetation types.
Our transformation coefficients allowed a high consistency between Landsat-7 and Landsat-8 spectral bands. A comparison of Landsat-7 data with Landsat-8 data without our transformation or with application of the standard transformation (Roy et al 2016) resulted in inaccuracy due to sensor differences of the same strength as vegetation changes. We observe less variability in the spectral bands of Landsat-7 data than Landsat-8 data due to the much lower radiometric sensitivity of the Landsat-7 sensor (USGS, 2019a, 2019b).
We significantly corrected Landsat data for shadowed areas in our classification by combining two approaches. First, we used the standard way of avoiding topographic effects and variations in the sun illumination angle by employing normalised difference spectral indices instead of single spectral band values or single band ratios (Mróz and Sobieraj 2004). Second, we applied topographical corrections (Riano et al 2003), because in the mountainous parts of Chukotka, the quality of the spectral indices was still affected by steep slopes and very strong shadows, especially for the snow-covered acquisitions.
We validated the derived land-cover maps with new field data from the expedition in 2018 (appendix E). 66% of validation sites were correctly assigned to one of the four land-cover classes. The highest misclassification, namely systematic overestimation, we found for prostrate herb tundra and barren areas over graminoid tundra. However, the derivation of relative changes compensates for the misclassification error.
4.2. Vegetation changes from 2000/2001/2002 to 2016/2017
4.2.1. Tree infilling with no evidence of substantial treeline advance
The expansion of the sole tree species Larix cajanderi is attributed to a change from forest tundra and shrub tundra to larch closed-canopy forest. The most prominent results are obtained for the northern taiga area (16-KP-02). The larch closed-canopy forest increase resulted in an absolute L. cajanderi cover increase from 2000 to 2016 of about 5% (or an area of 15.8 km2) with respect to its abundance in each of the accounted land-cover classes (appendix H, tables H1, H2). The spatial pattern of larch expansion derived from the land-cover classes' differences suggests tree infilling behaviour rather than treeline advance since the larch closed-canopy forest only significantly increased in the northern taiga where it was previously present at the landscape scale. Contrarily, we found no evidence of significant larch forest advance in the tundra–taiga ecotone.
We compared the increase of larch tree cover in our study region to other Siberian subarctic regions where the treeline is formed by Larix spp. (figure 8). Both areas of the tundra–taiga ecotone (16-KP-01 and 16-KP-03) have similar increases to north-western Siberia as explored by Frost and Epstein (2013). Increase of larch cover in northern taiga (16-KP-02) is twice as high as in the tundra–taiga ecotone. Despite these similarities, one needs to be careful in such comparisons since tree cover is increasing nonlinearly and one needs to consider the period of investigation (Frost & Epstein: 1965–2009; this study: 2000–2017) and the different spatial resolutions of the studies.

Figure 8. Larch tree cover increase, recalculated as average per year: for our study areas (16-KP-01 (northern treeline border), 16-KP-02 (northern taiga), 16-KP-03 (southern treeline border)) and the study areas of Frost & Epstein (2014; Uyandi, Hatanga, Lukunsky, Dudinka). Background map Esri, USGS | Esri, HERE, Garmin, FAO, NOAA, USGS | Earthstar Geographics.
Download figure:
Standard image High-resolution imageIt is likely the ecological niche of L. cajanderi will shift further north with recent warming. However, larch migration to the north might be limited by seed dispersal and reproduction rates (Wieczorek et al 2017a). Our inferences of strong infilling in southern areas and a simultaneously slow treeline advance in northern areas is in accordance with simulation results of an individual-based larch model (Kruse et al 2019a). Climate-driven infilling might be overestimated in areas recently heavily impacted by fires. However, we selected a region in the northern taiga area with no fire dynamics within the investigated period.
4.2.2. Shrub expansion and graminoid decline
Throughout the explored region forest tundra and shrub tundra increased in area from 13% in the early time-slice to 32% in the late time-slice (appendix H, table H1). This increase in vegetation biomass is also captured by the significant greening trend between 2002 and 2008 observed in our study area, interpreted as an increase in growing season NDVI (MODIS and AVHRR, in Guay et al 2014) and increase in peak-summer MODIS NDVI from 2000 to 2018 (appendix B).
We interpret the areal increase as expansion of the forest tundra and shrub tundra into areas formerly covered by graminoid tundra. The forest and shrub tundra class has an average shrub cover of 60%, which is much higher than the shrub cover in all other vegetation classes (figure 9). The main taxa contributing to shrubification are deciduous dwarf shrubs Vaccinium vitis-idaea, Betula nana (strong contribution only in tundra–taiga), Ledum palustre and V. uliginosum (tundra–taiga, northern taiga), Empetrum nigrum (stronger contribution in northern taiga, less strong in tundra–taiga), Cassiope tetragona and Salix spp. (minor contribution in both tundra–taiga and northern taiga) and Alnus viridis ssp. fruticosa (strong contribution only in tundra–taiga, figure 10).
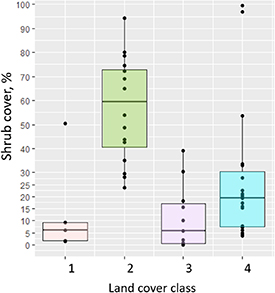
Figure 9. Foliage projective cover of the shrub portion in each of the four land-cover classes: (1) larch closed-canopy forest, (2) forest tundra and shrub tundra, (3) graminoid tundra and (4) prostrate herb tundra and barren areas. Shrubs (high, low and dwarf) include: A. viridis ssp. fruticosa, P. pumila, B. nana, Salix spp., V. vitis-idaea, V. uliginosum, L. palustre, Rosa sp. and Rhododendron adamsii.
Download figure:
Standard image High-resolution image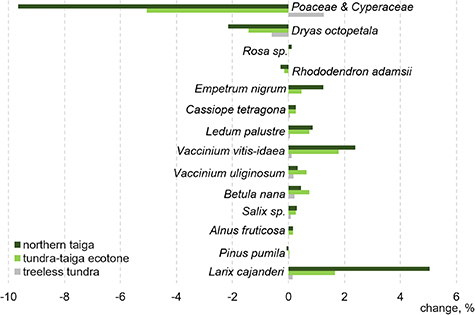
Figure 10. Average absolute foliage projective cover change (for the study period) in the northern taiga, tundra–taiga ecotone and treeless tundra areas for selected taxa based on their foliage projective cover contributions in each land-cover class.
Download figure:
Standard image High-resolution imageThe shrubification goes along with a significant decrease in the graminoid tundra class from an average of 60% in 2001%–41% in 2016 throughout the explored region (appendix H, table H1). Dominant taxa of the graminoid tundra are Poaceae and Cyperaceae, which form 37% of the cover of this class, much higher than for other classes.
Myers-Smith et al (2011) describe how shrub expansion in the tundra–taiga ecotone in recent years can be related to various environmental drivers including climate (earlier snowmelt alongside higher temperatures), natural disturbances (permafrost degradation, fire) and anthropogenic impact. Many studies report tall (mostly Alnus, rarely Pinus pumila), low and dwarf (Salix, Betula) shrub expansion all over the arctic region (Sturm et al 2001, Tape et al 2006, Myers-Smith et al 2011, Frost and Epstein 2013, Frost et al 2014). Most of these studies investigate different and/or longer time periods or focus on local-scale changes (floodplains, river slopes etc). The rates of shrubification in the central Chukotka mountainous area appear to be much lower than in the other studied circum-Arctic regions that represent lowland landscapes. We suspect that most of the shrubification in the tundra–taiga transition area in Chukotka could be related to climate changes, because anthropogenic impact is low except in the 16-KP-01 region, where road construction along Lake Ilirney is indicated as a decrease in vegetation cover (figure 7).
Trends in the annual mean air temperature suggests an increase of 0.25 °C–1°C per decade (1979–2009 years trend) in our study area, as well as a decrease in snow cover duration (1–2 d per decade, 1979–2009 years trend; Liston and Hiemstra 2011). The increase in air temperature has caused warming of permafrost in recent years (Biskaborn et al 2019), which may also support a deepening of the active layer and thus can benefit plants with long root systems. According to Fyodorov-Davydov (2008), active-layer thickness significantly increased in eastern Siberia (Northern Yakutia)) from 1999 to 2006 by about 35–70 cm in typical tundra, 7 cm in the tundra–taiga ecotone and 13 cm in the northern taiga.
Despite modern climate conditions in the tundra–taiga ecotone being favourable for both shrub and forest expansion, at first, fast reproduction rates allow low and dwarf shrubs to rapidly colonise the area. These areas will be subsequently replaced by generally slower expanding forests (cf Kharuk et al; 2006, Montesano et al; 2016, Wieczorek et al 2017b, Kruse et al 2019a).
Overall, our findings of shrub expansion and decline of graminoid cover agree with modelling results. For example, a simulation experiment by Carlson et al (2018) for the subarctic claims an increase in the abundance of deciduous shrubby Salix and a decline of the graminoid Carex under a warming treatment.
4.2.3. Stable treeless tundra
In contrast to the fast-changing northern taiga and tundra–taiga ecotone we observed a much slower change in the tundra. Even though there is only 40 km between 16-KP-01 (tundra–taiga) and 16-KP-04 (tundra), the tundra area stayed stable during the explored 15 years. However, we could detect shrub cover increase in river valleys that suggests favourable environmental conditions for shrub growth (nutrient availability, moisture, soil development, active layer depth, shelter against harsh wind). Valley shrubification is common for many arctic regions (e.g. Frost and Epstein 2013, Naito and Cairns 2014), but the rates of changes are much lower in Chukotkian tundra (16-KP-04).
Similarly, stable tundra, where shrub cover is represented by Salix glauca, Betula nana and Vaccinium uliginosum, has been reported for Disko Island in west Greenland (Callaghan et al 2011). There have been few studies of Siberian tundra and many of these focus on areas of expected strong shrubification and treeline advance. Vegetation turnover might still be occurring but is hidden within our broad vegetation classes.
The circum-Arctic NDVI change supports our findings of weak greening in the Northern Chukotka tundra region, which contrasts greatly to the strong tundra greening trend on the North Slope in Alaska (Epstein et al 2018).
5. Conclusions
We presented a land-cover classification and land-cover change over 15-years in the recent past from four areas of central Chukotka (eastern Siberia, Russia) ranging from northern taiga to treeless tundra. In our approach, foliage projective cover from vegetation plots is statistically related to Landsat spectral indices. The derived model was then used for classification of Landsat images which enabled us to detect 15-year changes in land-cover classes and interpret the magnitude and major taxonomical contributors of vegetation change.
Our analyses yielded that the class larch closed-canopy forest significantly increased only in the northern taiga where it was previously present at the landscape scale. Contrarily, we found no evidence of significant larch forest advance in the tundra–taiga ecotone. This led us to the conclusion that tree infilling behaviour rather than treeline advance characterises the study area.
We observed a strong increase of the forest tundra and shrub tundra class in northern taiga and tundra-taiga. Major contributors of shrubification are alder, dwarf birch and some species of the heather family. It is concomitant with a decrease in graminoid tundra which is consistent with a previous warming treatment experiment (Carlson et al 2018).
We found that treeless tundra stayed rather stable within the investigated period, which contrasts with the strong tundra greening on the North Slope in Alaska (Epstein et al 2018), but is similar to Disko Island in west Greenland (Callaghan et al 2011).
Absolute rates of vegetation change across circum-Arctic studies are only partly comparable because of differences in methodological approaches and analysed time spans, and would require a harmonised circum-Arctic approach in the future that numerically links field and remote-sensing data.
Acknowledgments
This study has been supported by the German Federal Ministry of Education and Research (BMBF), which enabled the Russian-German research programme 'Kohlenstoff im Permafrost KoPf' (Grant No. 03F0764A), by the Initiative and Networking Fund of the Helmholtz Association and by the ERC consolidator grant Glacial Legacy of Ulrike Herzschuh (Grant No. 772852). Birgit Heim acknowledges funding by the Helmholtz Association Climate Initiative REKLIM. We thank our Russian and German colleagues from the joint German-Russian expedition 'Keperveem 2016' for support in the field. Special thanks to Lena Popova for providing technical support with Landsat data preparation.
Data availability statement
The data that support the findings of this study are openly available via the following link https://doi.pangaea.de/10.1594/PANGAEA.908570 and cited in the references as Shevtsova et al (2019).
Appendix A.: Detailed description of Landsat acquisitions
Here we describe in detail the Landsat data used for retrieving the Normalised Difference Vegetation Index (NDVI), Normalised Difference Water Index (NDWI) and Normalised Difference Snow Index (NDSI). NDVI and NDWI were retrieved from peak-summer acquisitions and NDSI from snow-covered acquisitions (table A1). The pixel size of each Landsat image is 30 × 30 m. Before indices calculation the Landsat data was topographically corrected. The subsets that we used for land-cover classification were cloud free and cloud-shadow free. Additionally, we masked all water bodies. Latdsat-8 data were transformed to Landsat-7-like (see section 1.2 Landsat data, pre-processing and spectral indices processing).
Table A1. Dates and short description of Landsat data used for retrieving spectral indices and further land-cover classification.
| Landsat acquisition | ||||
|---|---|---|---|---|
| Focus area | year | month | day | Short description (season/Landsat mission/spatial resolution) |
| 16-KP-01 | 2001 | 7 | 30 | peak-summer, Landsat-7, 30 m |
| 2001 | 3 | 24 | snow-covered, Landsat-7, 30 m | |
| 2016 | 7 | 31 | peak-summer, Landsat-8, 30 m | |
| 2016 | 3 | 16 | snow-covered, Landsat-8, 30 m | |
| 16-KP-02 | 2000 | 8 | 8 | peak-summer, Landsat-7, 30 m |
| 2001 | 3 | 22 | snow-covered, Landsat-7, 30 m | |
| 2016 | 8 | 12 | peak-summer, Landsat-8, 30 m | |
| 2016 | 3 | 5 | snow-covered, Landsat-8, 30 m | |
| 16-KP-03 | 2001 | 7 | 30 | peak-summer, Landsat-7, 30 m |
| 2001 | 3 | 24 | snow-covered, Landsat-7, 30 m | |
| 2016 | 7 | 31 | peak-summer, Landsat-8, 30 m | |
| 2016 | 3 | 16 | snow-covered, Landsat-8, 30 m | |
| 16-KP-04 | 2002 | 8 | 9 | peak-summer, Landsat-7, 30 m |
| 2001 | 3 | 24 | snow-covered, Landsat-7, 30 m | |
| 2017 | 8 | 10 | peak-summer, Landsat-8, 30 m | |
| 2016 | 3 | 16 | snow-covered, Landsat-8, 30 m | |
Appendix B.: MODIS NDVI time series from 2000 to 2018
The Landsat archive had very few cloud-free peak-summer acquisitions for our study area between 2000 and 2018, so we could not calculate a consistent trend over the full period. Therefore, we selected the two most distant time steps with available data. We analysed continuous land-cover change using MODIS NDVI data. We used 16-day MODIS MOD13Q1 NDVI time-series data averaged for the period from July 12th to August 11th, with a spatial resolution of 250 m, calculated as mean NDVI value from the areal extent of each of the four Landsat subsets of the focus areas for every year from 2000 to 2018. As we see in the figure B1 the MODIS peak-summer NDVI time series do show an overall increase from 2000 to 2018. In general, regardless of extreme years such as low NDVI in 2013, the selected years of 2000, 2001, 2002, as well as 2016 and 2017 are representative years for vegetation change.
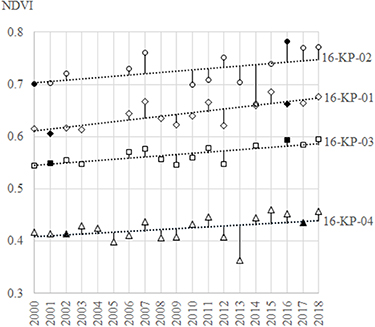
Figure B1. The selected years (black-filled symbols) used in vegetation change analysis are representative for the general vegetation trend indicated by peak-summer 16-days MODIS MOD13Q1 NDVI time-series.
Download figure:
Standard image High-resolution imageAppendix C.: Landsat Indices values for each analysed vegetation site
The Landsat spectral Indices which were calculated from acquisitions in summer:
Normalised Difference Vegetation Index, ,
,
Normalised Difference Water Index, , and from acquisitions in March:
Normalised Difference Snow Index,  The Lan-dsat spectral Indices values are presented in table C1.
Table C1. Indices used in the model-building at each site. (NDVI: Normalised Difference Vegetation Index, NDWI: Normalised Difference Water Index, NDSI: Normalised Difference Snow Index).
| Index Site | NDVI | NDWI | NDSI | Index Site | NDVI | NDWI | NDSI |
|---|---|---|---|---|---|---|---|
| V01 | 0.72 | −0.64 | 0.88 | V42 | 0.43 | −0.48 | 0.69 |
| V02 | 0.64 | −0.60 | 0.91 | V43 | 0.37 | −0.41 | 0.73 |
| V03 | 0.70 | −0.63 | 0.90 | V44 | 0.34 | −0.40 | 0.58 |
| V04 | 0.77 | −0.67 | 0.81 | V45 | 0.59 | −0.56 | 0.74 |
| V05 | 0.74 | −0.66 | 0.88 | V46 | 0.63 | −0.61 | 0.73 |
| V06 | 0.67 | −0.61 | 1.00 | V47 | 0.65 | −0.63 | 0.69 |
| V07 | 0.33 | −0.36 | 0.87 | V48 | 0.63 | −0.63 | 0.74 |
| V08 | 0.45 | −0.48 | 0.94 | V49 | 0.61 | −0.61 | 0.73 |
| V09 | 0.68 | −0.63 | 0.82 | V50 | 0.49 | −0.51 | 0.63 |
| V10 | 0.74 | −0.66 | 0.70 | V51 | 0.35 | −0.40 | 0.69 |
| V11 | 0.57 | −0.56 | 1.00 | V54 | 0.28 | −0.33 | 0.76 |
| V12 | 0.68 | −0.63 | 0.73 | V57 | 0.51 | −0.53 | 0.96 |
| V13 | 0.75 | −0.63 | −0.06 | V58 | 0.59 | −0.60 | 0.80 |
| V14 | 0.75 | −0.64 | 0.86 | V29 | 0.62 | −0.59 | 0.79 |
| V15 | 0.70 | −0.61 | 0.80 | V30 | 0.64 | −0.61 | 0.85 |
| V16 | 0.73 | −0.64 | 0.70 | V31 | 0.67 | −0.62 | 0.83 |
| V18 | 0.74 | −0.62 | 0.14 | V32 | 0.60 | −0.58 | 0.81 |
| V19 | 0.76 | −0.65 | 0.51 | V33 | 0.67 | −0.63 | 0.75 |
| V20 | 0.72 | −0.65 | 0.77 | V34 | 0.78 | −0.69 | 0.78 |
| V21 | 0.72 | −0.66 | 0.73 | V35 | 0.74 | −0.65 | 0.82 |
| V22 | 0.70 | −0.65 | 0.75 | V36 | 0.58 | −0.57 | 0.78 |
| V23 | 0.66 | −0.63 | 0.72 | V37 | 0.76 | −0.64 | 0.57 |
| V25 | 0.28 | −0.33 | 0.72 | V38 | 0.77 | −0.64 | 0.50 |
| V26 | 0.62 | −0.61 | 0.83 | V39 | 0.76 | −0.68 | 0.79 |
| V27 | 0.74 | −0.63 | 0.82 | V40 | 0.40 | −0.43 | 0.77 |
| V28 | 0.71 | −0.64 | 0.74 | V41 | 0.42 | −0.46 | 0.72 |
Appendix D.: Fuzzy c-means classification for interpretation of uncertainties for land-cover mapping
Fuzzy c-means (FCM) classification results with a threshold set to 0.6 (figure D1) gave six sites (10%) out of the 52 field sites that remained unclassified and fell into the uncertainty class. These are the sites with the most mixed vegetation. The majority of the field data (90%) is strongly associated with one of the four land-cover classes. The classes are similar to k-means results (appendix F) but given as probabilities.

Figure D1. Results of FCM classification on 2 RDA-axes using NDVI, NDWI and NDSI as predictors. Cluster description (represented by different colours): (1) larch closed-canopy forest, (2) forest tundra and shrub tundra, (3) graminoid tundra and (4) prostrate herb tundra and barren areas. Membership is presented as the proportion of a site that belongs to a certain class.
Download figure:
Standard image High-resolution imageThe mapped FCM classification is useful to understand which portion of the land surface does not belong to one of the four classes defined by hard k-means classification but instead stays unclassified. About 30% of the land surface in the study area remains unclassified by FCM: these are (1) types not represented by field data (high mountains, wetlands) and (2) transitional open-forest tundra zones.
In the mountainous parts, uncertainties mostly occur in high-elevation areas with extreme values of spectral reflectance (16-KP-04, 16-KP-03, figure D2). These land surfaces fall outside the established classes because no field data were sampled there. In the k-means classification (appendix F) these areas are included in the prostrate herb tundra and barren areas class.

Figure D2. Colour-coded land-cover classes from c-means classification with a threshold of 0.6 and uncertainty for which membership for each class was lower than 0.6: a) 16-KP-04, 2017, uncertain is 44%; b) 16-KP-01, 2016, uncertain is 20%; c) 16-KP-03, 2016, uncertain is 24%; d) 16-KP-02, 2016, uncertain is 42%.
Download figure:
Standard image High-resolution imageTransition areas between grass-dominant and shrub-dominant vegetation types as well as between open and forest tundra are responsible for much of the uncertainty (16-KP-01, 16-KP-03, figure D2). In the k-means results these areas are represented by both graminoid tundra and forest and shrub tundra.
In the northern taiga (16-KP-02, figure D2) more area was classified as uncertain: mostly formerly burnt areas and wetlands. Pioneer vegetation that occupied the burned areas in the first decades comprises highly abandant foliar Alnus viridis shrubs (Lantz, 2010) and dense green understorey which are difficult to separate from other vegetation groups using remote-sensing information as it just captures high-biomass green vegetation. These areas belong to larch closed-canopy forest or forest tundra and shrub tundra in the k-means classification.
Wetlands are characteristic of river floodplains and were not surveyed in the field and therefore fall mostly under uncertain. They are mostly represented as forest tundra and shrub tundra with some patches of larch closed-canopy forest in the k-means classification.
Appendix E.: Validation of land-cover maps
We validated the derived land-cover maps with new field data from the expedition 'Chukotka 2018' (Kruse et al 2019b), that revisited the regions 16-KP-01 (tundra-taiga transition, 27 sites) and 16-KP-04 (tundra, 5 sites). In 2018, we did not collect field data from northern taiga, so it was not possible to validate closed-canopy forest class with this approach. We used almost the same sampling scheme during both expeditions in 2016 and 2018. Tree and tall-shrub (>100 cm) cover was estimated the same way. The difference was only in the placement of the 2 × 2 m subplots for low-shrub and ground vegetation estimation. We used a 15 m-radius at each plot but in 2018, rather than systematic placement of the subplots in the cardinal directions and the centre, we placed three subplots into each of the differentiated three major vegetation classes (e.g. lichen-dominant communities, low-shrub tundra communities with Vaccinium spp. dominance etc). We estimated foliage projective cover for the ground layer taxa and averaged, first, across vegetation pattern and, second, across the whole 15-m radius circular plot using the estimated proportions of vegetation classes within it. With this, we can ensure the direct comparison between the foliage projective cover data from both expeditions.
To validate the land-cover maps, we projected the new field data from 2018, as well as corresponding Landsat spectral indices data, into the ordination space we previously created. Predicted classes were similar for the majority of 21 plots (66%, table E1). Two sites were misclassified as larch closed-canopy forest in the foliage projective cover data due to high larch cover (up to 20%), whereas they were correctly classified into the class forest tundra and shrub tundra by Landsat spectral data. Only three plots were differently classified as graminoid tundra or forest tundra and shrub tundra and vice versa. These are characterised by mixed typical vegetation, which can hardly be distinguished by the applied classifiers. While the predicted vegetation class based on the foliage projective cover data was correctly assigned to prostate and herb tundra: the Landsat spectral indices misclassified the majority (6 of 7) of open tundra communities dominated by Dryas octopetala and Cassiope tertragona into graminoid tundra. Therefore, one needs to interpret changes between these two classes with caution. However, we did not find big changes between graminoid tundra and prostrate herb tundra in tundra-taiga or tundra zones. In addition, considering systematic overestimation of graminoid tundra in both compared years compensates for the errors of misclassification.
Table E1. Number of sites predicted into four land-cover classes using two different origins of RDA-scores: foliage projective cover (columns) and Landsat spectral Indices (rows).
| Class predicted from foliage projective cover data | |||||
|---|---|---|---|---|---|
| Larch closed-canopy forest | Forest tundra and shrub tundra | Graminoid tundra | Prostrate herb tundra and barren areas | ||
| Class predicted from Landsat spectral Indices | Larch closed-canopy forest | 0 | 0 | 0 | 0 |
| Forest tundra and shrub tundra | 2 | 7 | 1 | 0 | |
| Graminoid tundra | 0 | 2 | 13 | 6 | |
| Prostrate herb tundra and barren areas | 0 | 0 | 0 | 1 | |
Appendix F.: K-means classification results
The results of k-means classification for our four focus areas giving for four dominant land-cover classes at two time slices (ordered from treeless tundra via tundra–taiga transition to northern taiga zone: figures F1, F2, F3, F4).

Figure F1. Colour-coded land-cover classes of 16-KP-04 (treeless tundra): a) for 2002, where dominant classes are prostrate herb tundra and barren areas (63%) and graminoid tundra (36%); b) for 2017, where dominant classes are also prostrate herb tundra and barren areas (59%) and graminoid tundra (39%). The forest tundra and shrub tundra class appears here at a very low proportion (1%).
Download figure:
Standard image High-resolution image
Figure F2. Colour-coded land-cover classes of 16-KP-01 (northern border of tundra–taiga ecotone): a) for 2001, where the dominant class is graminoid tundra (92%), while prostrate herb tundra and barren areas occurred in the hilly areas (5%) and forest tundra and shrub tundra is sparsely distributed in the valleys and gentle slopes (3%); b) for 2016, where the dominant classes are graminoid tundra (69%) and forest tundra and shrub tundra (27%) distributed in the valleys and gentle slopes. The prostrate herb tundra and barren areas class (3%) is still found in the hilly areas but now also includes road construction.
Download figure:
Standard image High-resolution image
Figure F3. Colour-coded land-cover classes of 16-KP-03 (southern border of tundra–taiga ecotone): a) for 2001, where dominant classes are graminoid tundra (57%) and prostrate herb tundra and barren areas (34%). Forest tundra and shrub tundra occurs along the waterways and on the gentle slopes of the lakes (8%); b) for 2016, where the dominant classes are graminoid tundra (42%), forest tundra and shrub tundra (28%) and prostrate herb tundra and barren areas (29%). Larch closed-canopy forest (<1%) can barely be seen as patches along the river.
Download figure:
Standard image High-resolution image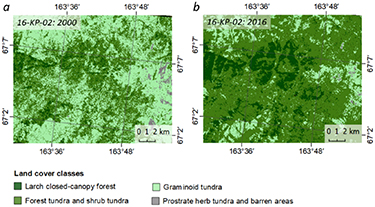
Figure F4. Colour-coded land-cover classes of 16-KP-02 (northern taiga): a) for 2000, where the dominant classes are graminoid tundra (55%) and forest tundra and shrub tundra (39%). To the east one can see a mountain complex where graminoid tundra turns into prostrate herb tundra and barren areas (1%). Larch closed-canopy forest (5%) is better represented in this area than in the other explored areas; b) for 2016, where the dominant classes are forest tundra and shrub tundra (69%), graminoid tundra (17%) and larch closed-canopy forest (13%). The prostrate herb tundra and barren areas class is poorly represented (<1%).
Download figure:
Standard image High-resolution imageAppendix G.: Heterogeneity of natural landscapes and mixed-pixels of satellite data
Here we show a heterogeneity of the common natural landscapes whithin our study area (figures G1 and G2).

Figure G1. At site V26 (16-KP-03) the lichen understorey significantly lowers the most important vegetation index (NDVI) compared with other tree-covered areas with grass or shrub understorey. While having high percentages of green healthy tree cover, the understorey is mostly covered with highly red-reflecting lichens (and green-reflecting Larix cajanderi needles) (360x180 degree panoramic image, Stefan Kruse).
Download figure:
Standard image High-resolution image
Figure G2. Despite the dense healthy-green Pinus pumila patches at site V23 (16-KP-03), a great proportion of the area around is covered by far less green lichen communities. These cause a significant increase in red reflectance which results in lower NDVI values for the 30 × 30 m pixel size. (360x180 degree panoramic image, Stefan Kruse).
Download figure:
Standard image High-resolution image
Appendix H.: Distribution of land-cover classes and their changes by study area
Distribution of land-cover clases and their changes is presented in % (table H1) and km2 (table H2).
Table H1. Distribution of land-cover classes and their changes by study area given in %.
| Proportion of land-cover class [%] | |||||
|---|---|---|---|---|---|
| Area | Year | Larch closed-canopy forest | Forest tundra and shrub tundra | Graminoid tundra | Prostrate herb tundra and barren areas |
| 16-KP-04 | 2002 | 0.10 | 0.24 | 32.49 | 67.17 |
| 2017 | 0.08 | 1.12 | 35.70 | 63.10 | |
| change 2017–2002 | −0.02 | 0.88 | 3.21 | −4.07 | |
| 16-KP-01 | 2001 | 0.04 | 2.76 | 93.23 | 3.96 |
| 2016 | 0.20 | 27.49 | 69.08 | 3.23 | |
| change 2016–2001 | 0.16 | 24.72 | −24.15 | −0.74 | |
| 16-KP-03 | 2001 | 0.63 | 7.87 | 58.70 | 32.80 |
| 2016 | 0.39 | 28.73 | 42.31 | 28.57 | |
| change 2016–2001 | −0.23 | 20.86 | −16.39 | −4.24 | |
| 16-KP-02 | 2000 | 4.02 | 39.63 | 54.74 | 1.60 |
| 2016 | 12.35 | 70.99 | 16.15 | 0.51 | |
| change 2016–2000 | 8.32 | 31.36 | −38.59 | −1.09 | |
Table H2. Distribution of land-cover classes and their changes by study area given in km2.
| Portion of land-cover class [km2] | |||||
|---|---|---|---|---|---|
| Area | Year | Larch closed-canopy forest | Forest tundra and shrub tundra | Graminoid tundra | Prostrate herb tundra and barren areas |
| 16-KP-04 | 2002 | 0.17 | 12.08 | 17.33 | 407.5 |
| 2017 | 0.89 | 120.14 | 14.1 | 301.94 | |
| change 2017–2002 | 0.72 | 108.05 | −3.22 | −105.55 | |
| 16-KP-01 | 2001 | 4.51 | 56.71 | 236.43 | 423.06 |
| 2016 | 2.82 | 207.04 | 205.89 | 304.97 | |
| change 2016–2001 | −1.69 | 150.33 | −30.54 | −118.1 | |
| 16-KP-03 | 2001 | 0.12 | 0.29 | 81.13 | 39.24 |
| 2016 | 0.09 | 1.35 | 76.21 | 43.12 | |
| change 2016–2001 | −0.03 | 1.07 | −4.92 | 3.88 | |
| 16-KP-02 | 2000 | 12.63 | 124.45 | 5.03 | 171.87 |
| 2016 | 38.76 | 222.9 | 1.61 | 50.71 | |
| change 2016–2000 | 26.13 | 98.46 | −3.42 | −121.17 | |