

Abstract
Global municipal waste production causes multiple environmental impacts, including greenhouse gas emissions, ocean plastic accumulation, and nitrogen pollution. However, estimates of both past and future development of waste and pollution are scarce. We apply compositional Bayesian regression to produce the first estimates of past and future (1965–2100) waste generation disaggregated by composition and treatment, along with resultant environmental impacts, for every country. We find that total wastes grow at declining speed with economic development, and that global waste generation has increased from 635 Mt in 1965 to 1999 Mt in 2015 and reaches 3539 Mt by 2050 (median values, middle-of-the-road scenario). From 2015 to 2050, the global share of organic waste declines from 47% to 39%, while all other waste type shares increase, especially paper. The share of waste treated in dumps declines from 28% to 18%, and more sustainable recycling, composting, and energy recovery treatments increase. Despite these increases, we estimate environmental loads to continue increasing in the future, although yearly plastic waste input into the oceans has reached a peak. Waste production does not appear to follow the environmental Kuznets curve, and current projections do not meet UN SDGs for waste reduction. Our study shows that a continuation of current trends and improvements is insufficient to reduce pressures on natural systems and achieve a circular economy. Relative to 2015, the amount of recycled waste would need to increase from 363 Mt to 740 Mt by 2030 to begin reducing unsustainable waste generation, compared to 519 Mt currently projected.
Export citation and abstract BibTeX RIS

Original content from this work may be used under the terms of the Creative Commons Attribution 4.0 license. Any further distribution of this work must maintain attribution to the author(s) and the title of the work, journal citation and DOI.
1. Introduction
The production of waste, i.e. unnecessary or undesirable byproducts, is an unavoidable consequence of most processes. Globally, 7–9 billion tonnes of waste are produced yearly (Wilson and Velis 2015). Municipal Solid Waste (MSW) is a specific category of waste stemming from households, and can include commercial and industrial wastes, depending on the reporting standard (Wilson and Velis 2015). MSW accounted for 2 billion tonnes of the total waste produced in 2016. However, it deserves special attention given its environmental impacts at local, regional and global scales; its proximity to people and thus potential health impacts; and its value in possible recuperation through circular economy supply chains (Wilson and Velis 2015, EC (European Commission) 2015b, Kaza et al 2018).
Different types of MSW can have varying environmental and health impacts depending on the disposal method (Eriksson et al 2005). Plastic wastes are of increasing global concern as they persist for long periods and are ingested by organisms, causing health impacts through the food chain, potentially including humans (Thompson et al 2009, Wagner 2017). Fugitive emissions from waste treatments produced 3%–4% of global greenhouse gas (GHG) emissions in 2006 (Monni et al 2006). Nitrogen pollution from waste leachate is another significant long-term local impact, potentially causing disease and nutrient imbalances in nearby water bodies (El-Fadel et al 1997, Burton and Watson-Craik 1998, Kjeldsen et al 2002). Furthermore, open burning of wastes has been shown to emit significant amounts of hazardous air pollutants, with strong implications for human health, especially in developing countries (Wiedinmyer et al 2014).
Moving towards a circular economy, waste materials should re-enter production flows as material or embedded energy, through recycling, composting or waste-to-energy incineration (EC (European Commission) 2015a, Eriksson et al 2005). For the EU, the Circular Economy Package of the European Commission (EC) has set targets of a minimum of 65% of recycling and a maximum of 10% of landfilling of all MSW by 2030 (EC (European Commission) 2015b). The UN Sustainable Development Goals (SDGs), especially targets 12.3, 12.4, and 12.5 (UN 2015), aim for a net reduction of global waste generation by 2030, through the reduction of total generation or increasing the shares of recycling and composting.
Nevertheless, today 70% of the world's waste ends up in dumps and landfills (Kaza et al 2018), here together referred to as Solid Waste Disposal Systems (SWDS). Dumps, as the most basic SWDS, are large-scale waste storage without any technical management, which also makes them a major source of waste pollution. Landfills may include varying degrees of technical measures to reduce and recover the amount of leachate and gases produced, such as including impermeable layers and covers, respectively (Manfredi et al 2009).
There is demand for more accurate and complete global accounting of waste generation rates. Estimating waste production and treatment is important in order to quantify impacts, plan capacities and set policy targets (Wilson and Velis 2015). Currently, the most comprehensive dataset of MSW are the What a Waste reports, with an updated version published in 2018 (Kaza et al 2018), on which we base this analysis. The What a Waste reports contains a global dataset of waste generation values, and composition and treatment shares.
Other quantifications of waste undertaken use regionally aggregated input-output tables (Tisserant et al 2017) or include detailed data for only one region or aggregation level (waste treatments, but not composition, for instance) (Eurostat 2017). What a Waste estimates future global waste production, but global trends at the disaggregated level of waste types and treatments are wholly lacking.
It is difficult to quantify global estimates of pollution from waste, partly due to this lack of fine-scale data. Plastic pollutant inputs into the marine system have been recently estimated (Jambeck et al 2015, van Wijnen et al 2019) using the What a Waste report (Hoornweg et al 2013). Various studies of GHG emissions from landfills and dumps exist, but these are limited to site or country-specific assessments, and global accounting lacks per-country values, climate-specific emission factors, and change of waste composition and treatments over time (Monni et al). While many experimental and field trials measure the nitrogen content of leachates from specific landfills (see Kjeldsen et al (2002), for example), there is a lack of global accounting of the nitrogen inputs and emissions of SWDS, and N2O gas from waste is currently not measured nor included in global GHG accounting (Ishigaki et al 2016).
Given these gaps, in this paper we produce first estimates of national levels of waste production, dis-aggregated by composition and treatment, at the global scale. Estimating waste types produced and treatments applied can serve as an important tool for the discernment of future trends in waste management. We furthermore calculate several relevant environmental impacts: historic and future quantities of recyclable material stocks in SWDS, GHG emissions, plastic waste inputs into oceans, and nitrogen stocks and flows, demonstrating important applications of our extended dataset.
2. Methodology
We apply a stepwise framework to estimate waste trends and impacts: First, a matrix of waste types by treatment is produced through an optimization model (Section 2.1). Then, we regress waste totals and waste shares on GDPpc, comparing various functional forms for the former, and using the Dirichlet distribution for the latter (Section 2.2) . Finally, we use the combined projections generated by the regressions as input into models of environmentally relevant impacts (Section 2.3).
2.1. Linking composition and treatment through non-linear optimization
What a Waste (Kaza et al 2018) provides shares of composition and treatment of total MSW but does not specify which type is treated how. Table 1 shows the types and treatments of waste provided in What a Waste, to which we apply constrained non-linear optimization in order to distribute the types among possible treatments, transforming the two separate columns into the matrix shown. The model takes the product of the treatment and composition shares as initial value, however, certain treatments are physically impossible (metal and glass cannot be incinerated or composted, plastic cannot be composted, while organic waste cannot be recycled). The function redistributes these initial impossible values to other categories within the respective rows or columns, while minimizing the sum of the squared differences for each row and column sum. Redistributed values are relatively small, and we consider this optimisation approach commensurate with the relative uncertainty inherent in the data reporting.
Table 1. Waste compositions types (rows) and applicable treatments (columns) reported in What a Waste. Impossible composition-treatment combinations are marked with 'NA'. The optimization model takes the product of each row-column as initial value, sets impossible combinations to 0, and redistributes the initial impossible values while minimizing difference between original and redistributed row and column sums.
| Composition X Treatment | Recycling | Compost | Incineration | Landfill | Dumps |
|---|---|---|---|---|---|
| Organic | NA | ||||
| Paper | |||||
| Plastic | NA | ||||
| Metal | NA | NA | |||
| Glass | NA | NA | |||
| Other | NA |
The optimization was performed using an Augmented Lagrangian method (Conn et al 1991), which efficiently finds global optima given nonlinear constraints (here, the squared differences for row and column sums). This was done through the 'auglag' function provided by the R-package alabama (Varadhan 2012).
2.2. Regression analysis
Per capita waste production is known to be highly correlated with economic activity expressed in gross domestic product per capita (GDPpc) (Monni et al, Hoornweg et al 2013, Jambeck et al 2015, Wilson and Velis 2015). We thus apply regression models to capture the relationship between per capita waste production and GDPpc in a sequential manner: on total waste production, on the share of waste types within total production, and on the share of treatment options within each waste type. These sequential steps allow us to first produce a relationship between total waste generation and GDPpc, for which more observation data exists, and where observations should be more robust; the total waste production to GDPpc relationship is also well established in the literature. This total value constrains the shares of waste types and treatments as compositional data (Pawlowsky-Glahn and Buccianti 2011); modelling the shares dependent on the total also preserves information in the share data. We thus model the changing waste types and treatments independently within the changing total, all in relation to GDPpc.
The What a Waste dataset reports 215 country or region observations for waste generation, 176 for waste composition, and 172 for waste treatment with only one time-step per observation. Harmonized historical GDPpc data from 1965–2010, in Purchasing Power Parity (PPP) 2005 USD, are obtained from James et al (2012); future projections use the Shared Socio-Economic Pathways (SSP) framework for future plausible GDPpc values to 2100 (O'Neill et al 2017). Note that all reported projections in the main text use the SSP2 'middle-of-the-road' scenario; The SI includes a presentation of the SSP framework, and accompanying data for all SSPs. We use the regression results to complete and extend the What a Waste dataset based on future temporal change in GDPpc, and calibrate regression results for countries with observed values (see SI). We employ a Bayesian framework, which is more cognate with the epistemic nature of the uncertainties in the regression problem at hand, more flexible in handling complex data structures and easier to interpret in terms of probability. All regressions were undertaken through the brms package (Bürkner 2017) as an interface to the Bayesian inference engine Stan (Carpenter et al 2017).
For the total waste production-GDPpc relationship, we test multiple functional forms with model comparisons made based on the expected log pointwise predictive density (elpd) generated by refitting each model through k-fold cross-validation (Vehtari et al 2017), see SI for model descriptions and comparisons. We assume homoscedastic normal residuals and student-t priors with 3 degrees of freedom on the slope and intercept for all models. A student-t prior with 3 degrees of freedom is more widely distributed with fatter tails than the Gaussian distribution and as such generally uninformative for the inference.
The composition and treatment types of waste are shares of a whole and sum to one within total waste production. We thus face a compositional data modelling problem: given the total amount of waste produced, the increase of a unit share of one waste type implies a reduction in other shares—the values are described within a k-1 simplex, given k degrees of freedom (Pawlowsky-Glahn and Buccianti 2011). Analysis of compositional data using classical statistical tools is known to be problematic due to these constraints (Aitchison 1982). Two of the most commonly applied methods for the analysis of compositional data include the isometric log-ratio (ILR) or similar transformation (Aitchison 1982) and, more recently, Dirichlet regression (Hijazi and Jernigan 2009, Douma and Weedon 2019). The ILR converts compositional data into independent vectors, while Dirichlet regression is a multivariate generalization of beta regression working on the original scale of shares. The ILR transformation may be subject to bias in its parameters once back-transformed into real proportions (Douma and Weedon 2019), and in our case turned out numerically unstable. Hence we settled with the Dirichlet regression; working in the original data space is also preferable in principle.
The Dirichlet distribution is parametrized by modelling the k shares directly, along with a precision parameter phi. We use student-t priors with 3 degrees of freedom for all share parameters, and a gamma (shape = 0.01, scale = 0.01) prior for the precision parameter phi (Douma and Weedon 2019).
We first apply the Dirichlet regression to the composition types of waste within the total, then for each type of waste, apply another regression for each type's possible treatments. For all regressions, countries are assigned a frequency weight based on population in order to more accurately match global totals, and place lower importance on countries with very low populations. The frequency weight is computed by increasing the observation of each point by its population; this value is then scaled by the overall number of data points to maintain the same total quantity of observations.
By combining these share-based regression results with the total waste generation projections, we create an extended global dataset of waste generation, by type and treatment, for all countries, from 1965–2100.
2.3. Environmental impacts
The extended dataset is useful for estimating future trends in environmental impacts that require the types and treatments of waste, including the following (see SI for more detailed methodology):
2.3.1. Circular economy material stocks
Global and national levels of the quantity of recycling and potentially recyclable materials can be immediately accounted from our projections. Conversely, the non-recycled amount of re-usable materials may accumulate as a stock in landfills and dumps, assuming no outflow. We calculate these stocks from 1965 onwards, for an estimation of potentially re-usable material accumulated in landfills and dumps.
2.3.2. Plastic waste into oceans
We estimate plastic waste inputs into the ocean based on the amount of mismanaged plastic waste in coastal areas. Mismanaged plastic waste is defined, following Jambeck et al (2015), as the per capita sum of plastic waste treated in open dumps, plastic waste in landfills in developing countries, and littered waste (an additional 2% of total plastic waste). We multiply this value with the population within a 50 km buffer from the coastline (Gridded Population of the World v3 (CIESIN 2005, Jambeck et al 2015). Note, due to the lack of relevant information the uncertainties associated with these models and emission factors are not estimated and propagated here and hence our probabilistic results show only the uncertainty associated with our waste regression relationships. The same applies to the impact models presented next.
2.3.3. GHG emissions
Anthropogenic greenhouse gas emissions arise from several waste treatment processes. We apply the IPCC 2006 GHG accounting methodology—with updated values from the 2019 refinement—for GHG emissions attributable to waste (IPCC 2006, 2019). We differentiate non-carbon neutral GHGs: CH4 from landfills, dumps, incineration and composting processes; CO2 from incineration of non-biogenic sources (plastics); N2O from incineration and compost. N2O from dumps and landfills is currently not included in IPCC accounting; this is elaborated on in the discussion. Landfill and dump emissions are calculated through a first-order decay equation that accounts for the carbon stock stored in various waste types, along with the climatic zone; the other treatments apply emission factors (IPCC 2006).
2.3.4. Nitrogen pollution
Leachate from SWDS, produced by rainwater percolation and waste decomposition, contains concentrated amounts of reactive nitrogen (Nr) (Guo et al 2010). We assume a constant C/N ratio in MSW of 14, based on the biodegradable fraction of C (Puyuelo et al 2011), and calculate potentially mobile Nr based on this ratio respective to the carbon released from emissions calculated above. Potentially mobile Nr is thus nitrogen that is free to enter leachate—primarily as NH4 (Mor et al 2006)—or turn into gas emissions. Because leachate production is dependent on factors such as climatic conditions and water flow dynamics through landfills, actual yearly emissions of Nr remain too uncertain for our analysis. As such, we present only the potentially mobile Nr available to be released, alongside N stocks in SWDS.
3. Results
3.1. Waste projections
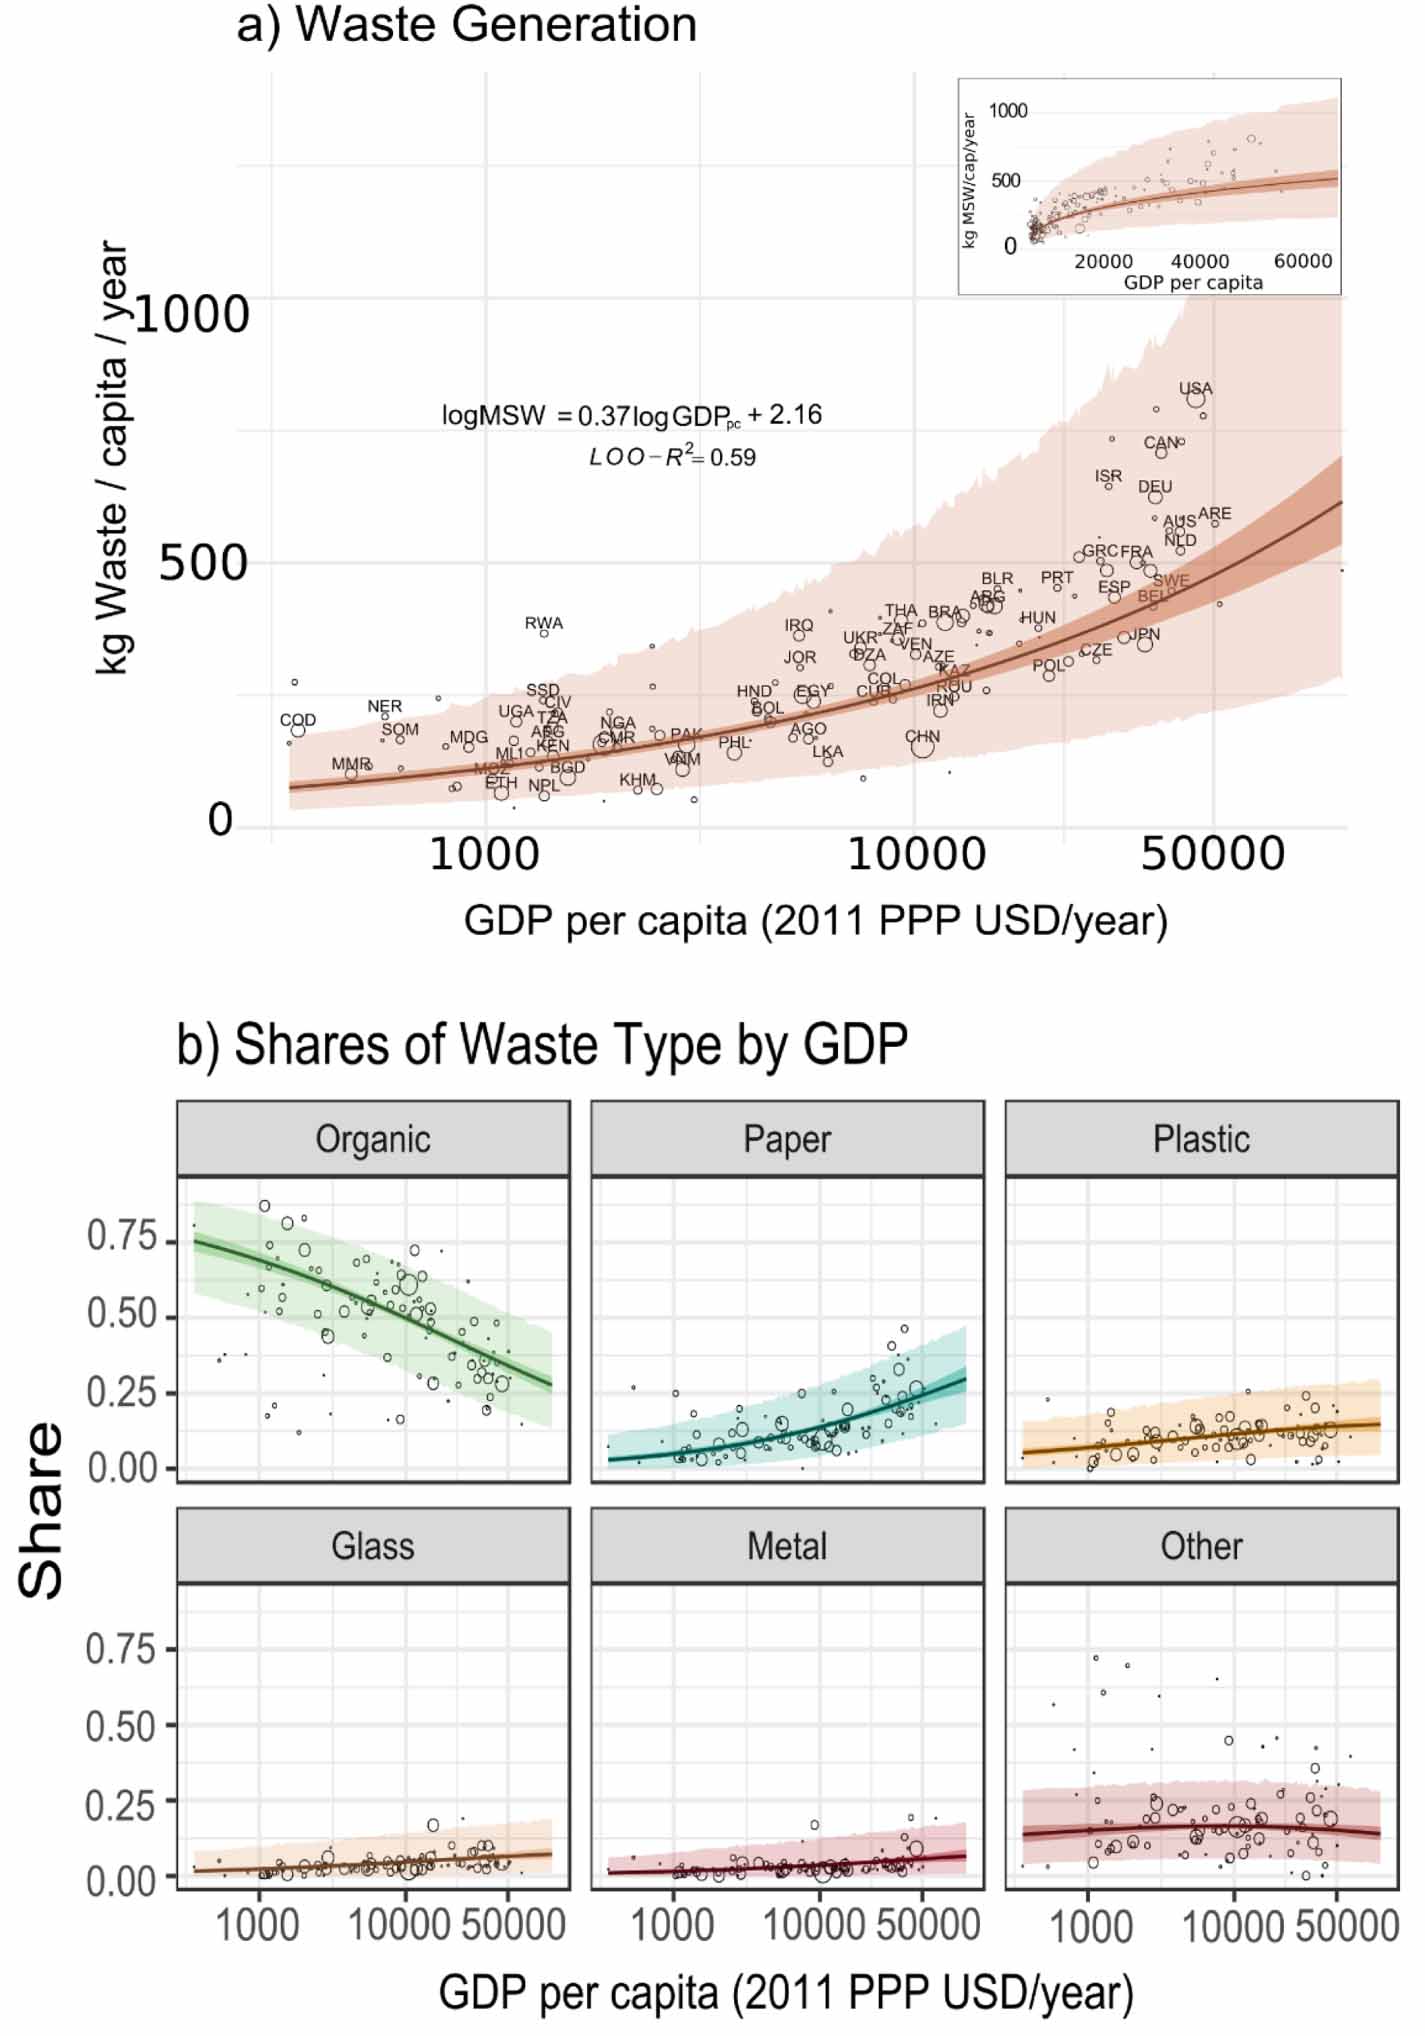
For total waste generation (figure 1(a)), the log-log linear model between per capita waste generation and GDPpc best fits total waste generation, with the lowest elpd given k-fold cross validations, using k = 10 (see SI). Leave-one-out R2 (LOO-R2)—R2 based on refitting the model with each observation left out once, see Gelman et al (2019)—is 0.58, indicating that GDPpc explains a substantial portion of the variance in waste generation.

Figure 1. (a) Total per capita waste generation by GDPpc. The large figure shows the x-axis on the log scale, for better display of low-income countries and their country names. Smaller inset shows the shape of the curve with unit scale axes; Note the declining slope as GDPpc decreases. Country names are displayed in ISO3 country codes. Log-log regression function and Leave-one-out R2 displayed on graph. (b) Dirichlet regression of shares of waste types within total amount generated. Share variables are dependent within the total; a change in one value necessitates an opposite change from at least one other value. For both figures, darker shading represents the 95% credible interval (CI) for regression uncertainty, while the lighter 95% CI shows residual uncertainty. Data point size shows population weight.
Download figure:
Standard image High-resolution imageWe find global waste production increasing into the future, but at a decreasing rate (see inset in figure 1(a)). The log-log functional form allows us to interpret the regression coefficient as the income elasticity of waste production, with a 0.37 ratio change given each percentage change in income (median figure with 95% credible interval (CI) of [0.32, 0.42]). By 2050, total global waste production will reach 3542 Mt [2983, 4197], from a 2015 value of 1999 Mt [1698, 2354].
As currently developed quality-of-fit indicators for the Dirichlet regression are highly variable (Hijazi 2006), we calculate the average root mean square error (RMSE) from ten draws from the posterior predictive distribution compared to the data; these have the advantage of being in the original unit space of the dependent variable. Average RMSE for the waste type regression (figure 1(b)) is 0.10, while higher at 0.27–0.33 for each of the treatment regressions (Regressions of waste treatments for each waste type are shown in figure S1 (stacks.iop.org/ERL/15/074021/mmedia), with accompanying RMSEs in table S2, in the SI). As such, it is important to note that there remains much uncertainty in the type-to-treatment regressions, with GDPpc failing to explain much of the variance in the data (see Discussion).
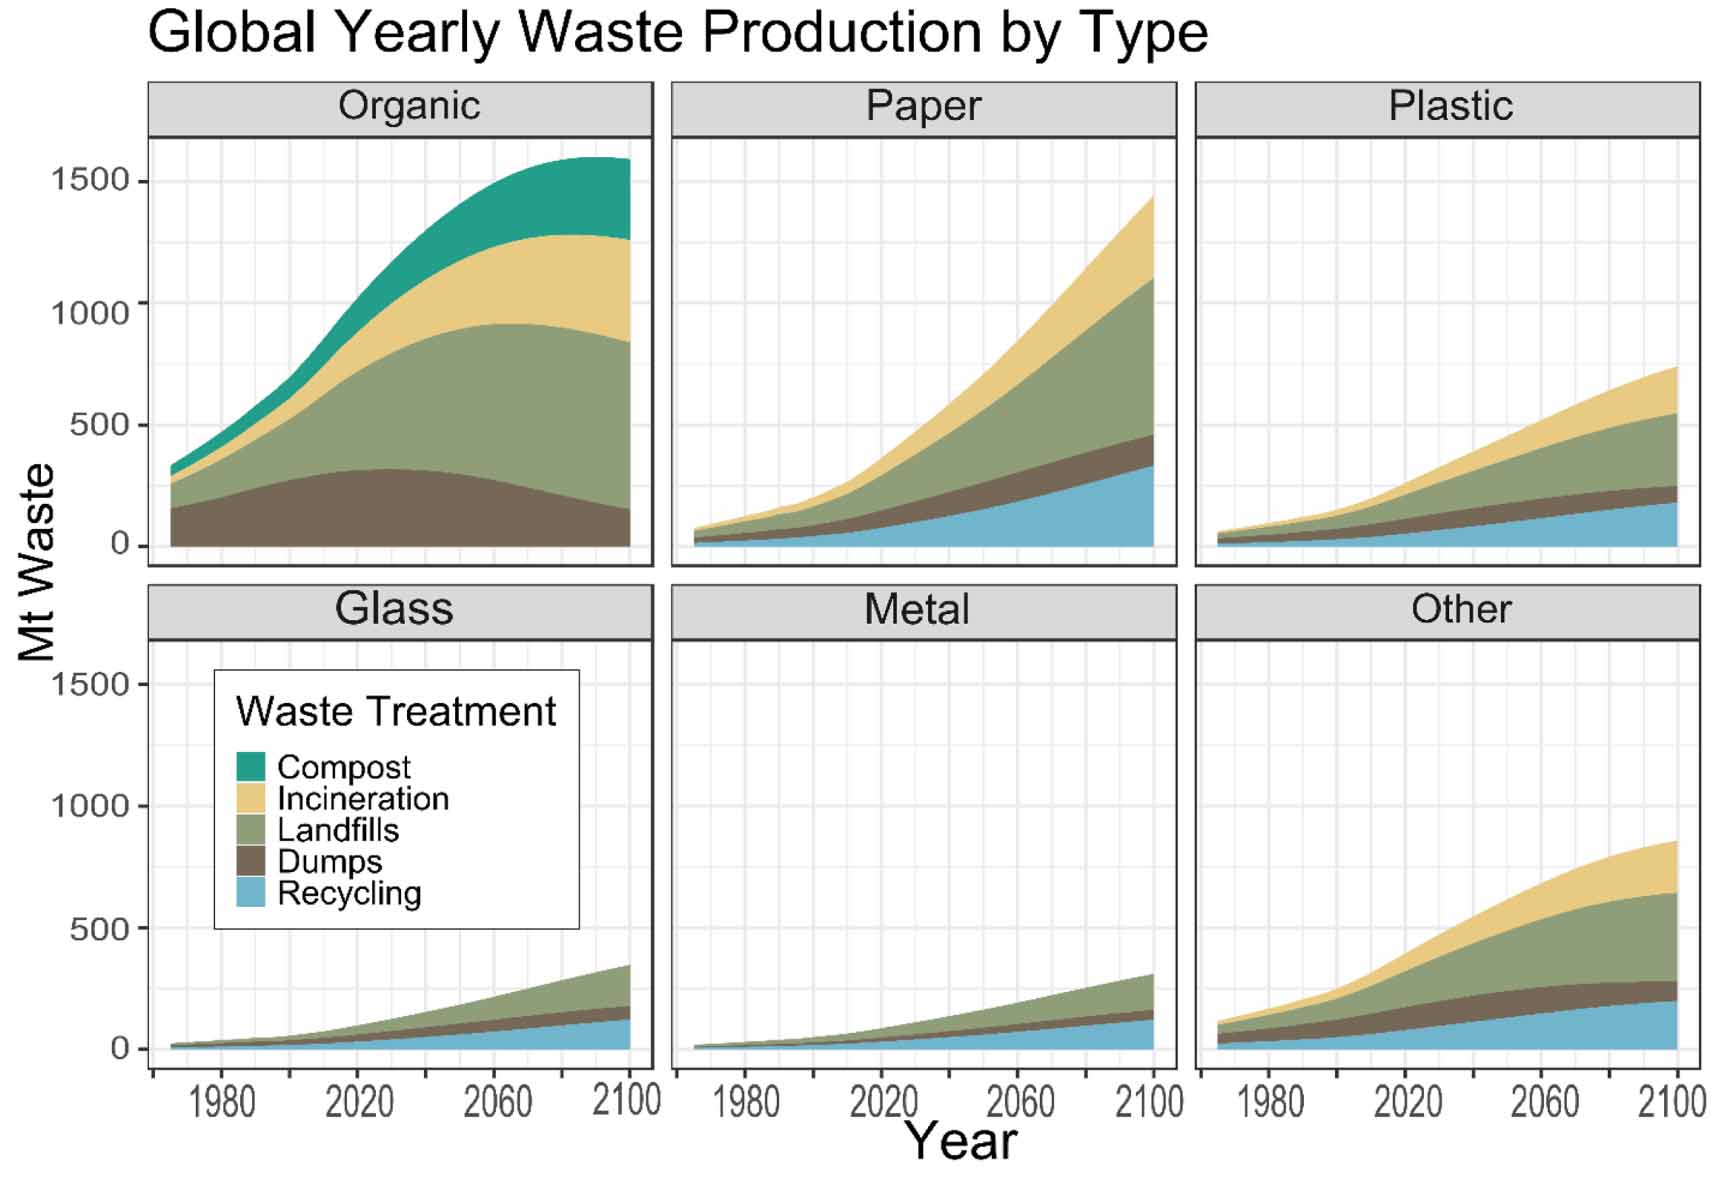
Organic waste remains a large proportion of countries' waste, even as GDPpc increases and economies grow (figure 1(b)). However, the share of organic waste declines from 47% [46.6, 47.5] in 2015 to 39.8% [39.4, 40.2] in 2050 relative to the share of all other waste types, especially paper waste, which increases from 15.6% [15.4, 15.8] to 20.1% [19.9, 20.1] in the same period. This can be explained by the saturation of organic waste through the saturation of food consumption, as shown by Engel's curve of food demand (Bodirsky et al 2015). However, by examining totals and not shares, we observe that organic waste may remain the most important waste in terms of MSW far into the future; landfills also still constitute the most important treatment, while the relative share of dumps declines (figure 2).
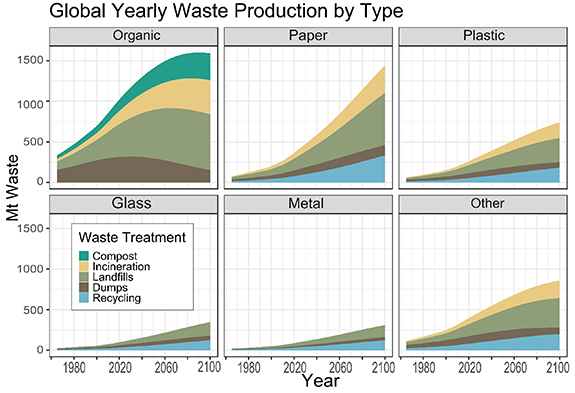
Figure 2. Global projection of future waste production by Type and Treatment, 1965-2100. Waste types (organic, 359 paper, plastic, glass, metal and other (a result of dissimilar accounting in the data)) sum up to total global waste 360 generation. CI not displayed for ease of legibility.
Download figure:
Standard image High-resolution imageFigure 3 presents a map of global waste production that allows for comparison of waste generation, composition and treatment both regionally and temporally. In terms of treatment, while the usage of dumps decreases appreciably as countries become richer, landfills remain the most important waste treatment option for most countries in the Global North (figures 2 and 3). North America and Europe continue to produce the most waste per capita, 939 kg [783,1125] and 565 kg [472, 675] by 2050, respectively.

Figure 3. World maps of waste generation, type, and treatment, 2015 and 2050. National per capita generation values (kg) in greyscale shading, whereas bar charts show total production of waste types and treatments presented for regionally representative countries and regions (in the case of the EU). Bar chart values are in terms of the total amount of waste generated (Mt) for the country/region.
Download figure:
Standard image High-resolution imageFurthermore, 47% [37, 59] and 31% [25, 38] of this waste is still treated in landfills by 2050, and while China, Sub-Saharan Africa and Latin America reduce much of their use of dumps, these are replaced with landfill usage (figure 3). The exception is Japan, where incineration use is very high in 2050 (59% [46, 75]). Indeed, only Japan exhibits declining amounts of waste generation, when subtracting recycled and composted waste. In our projection, Japan is the only country where future unsustainable waste generation decreases. However, this is also due to its observed low level of landfills and high incineration, and our calibration method that maintains this 'path dependency' (see SI).
Elsewhere, we observe some shifts towards treatments that take advantage of increased harnessing of residual energy and material: Recycling, waste incineration, and composting become a larger proportion of the treatment share as GDPpc increases, together reaching up to 39% [38, 40] of the global waste treatment share by 2050. However, the main dynamic observed is the replacement of dumps with landfills (figures 2 and 3).
3.2. Environmental impacts
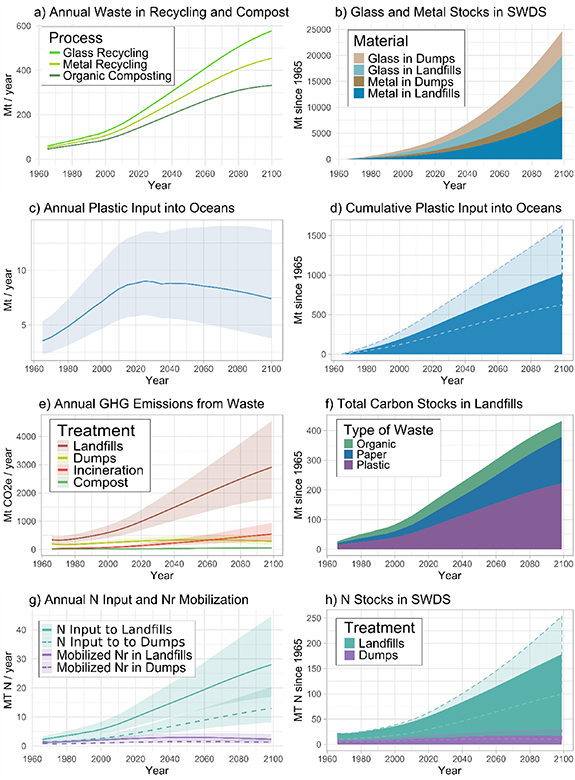
We project the yearly amount of waste treated within a 'circular' framework (recycling and composting, EC (European Commission) 2019) to double globally from 180 Mt [110 287] to 356 Mt [213, 576] by 2050. However, as percentage of total wastes generated, the share of metal and glass recycled remains constant at 34% [32,35] in 2015 compared to 2050 (35% [33,36]), while organic compost shares increase marginally, from 13% [12,14] to 17% [16,18] (figures 4(a) and (b)).
Figure 4. Annual inputs (left column) and cumulative stocks (right column) of key materials and environmental impacts, 1965–2100. Shaded area represents 95% credible interval (CI), not displayed on some for ease of legibility. (a) shows projections of business-as-usual recycling, in comparison to (b), the amount of recyclable materials accumulating in SWDS. (c) demonstrates a peak and slight decline of the yearly input of plastic into oceans; (d) cumulative ocean plastic stocks continue to grow. (e) Landfill greenhouse gas emission will remain the most important GHG emitted from various waste treatments, while (f) plastic i.e. fossil carbon along with organic and paper carbon continue to grow in landfills. (g) Mobilized Nr in landfills and dumps is a very small fraction of the overall input, meaning N tends to accumulate in SWDS (h).
Download figure:
Standard image High-resolution image
Estimates of plastic waste discharged into the marine system peak between the years 2015 and 2020, at the global scale, primarily due to the decreasing usage of dumps even while plastic waste generation only levels off (see SI). Of course, the cumulative sum of ocean plastic continuously increases, as by 2050 the total discharge rate remains at 8.76 million kg per year [7.02, 10.92] (figures 4(c) and (d)).
GHG emissions almost double from the current value of 1323 Mt CO2e [1090, 1604] in 2015 to 2383 Mt CO2e [1941, 2923] by 2050. Almost all GHG emissions arise from landfills and dumps, with compost and incineration emissions negligible (figures 4(e) and (f)). This is due to the large proportion of waste still disposed of in landfills in the future.
Nitrogen from MSW accumulates in SWDS, given our methodology. Yearly deposition of N from MSW in SWDS increases from 4.4 Mt N [3.6, 5.7] in 2015 to 5.8 Mt N [4.7, 7.1] (figures 4(g) and (h)). Of this, only about 10% is mobilized as Nr per year. As such, the overall net accumulated stock of N grows drastically. By 2050, 302 Mt N [249, 364] is accumulated in landfills and dumps globally, along with Nr potentially remaining within the SWDS as well.
4. Discussion
Our projections of total waste generation are consistent with the few other global projections of MSW production that exist. For example, What a Waste (Kaza et al 2018) estimate quantities (based on a regression for waste generation as a function of GDPpc) within our uncertainty limits (3400 Mt for What a Waste vs. 3542 Mt (median value) for ours, in 2050 globally).
Our estimates of waste production do not peak by the end of the century, corroborating Hoornweg et al (2013). The UN SDGs (UN 2016) aim for reduction of waste generation through sustainable treatment practices, however, the shares of sustainable treatments do not increase fast enough in our projections. As such, there is no absolute decoupling effect for waste observed as countries become richer (with the exception of Japan where other institutional and cultural factors may play a role) and thus little evidence for a waste-related environmental Kuznets curve (Stern 2004). This is due to both the strong continued growth of total waste generation, and the slow increase of sustainable treatment shares, in the absence of more stringent policy directives.
Our data suggests that the European Commission's goals towards a circular economy may not be met by 2030 without more directed policy. The EU is projected to recycle only 37% [35,38] of its waste, while 31% [29, 33] ends up in landfills, compared to the goals of 65% and 10% respectively. Globally, our projections also reveal the potential for increased circularity within the waste cycle in the future. Paper, glass, and metal can be easily recycled, and by 2030 we project these waste streams to comprise 26% [24, 28] of the total waste stream globally, and organic waste another 44% [41, 46]. However, the recycling share remains at 13% [11, 14] and for composting at only 6% [6, 6]. The amount of waste recycled and composted by 2030 would need to increase from 363 Mt [219, 582] in 2015 to 740 Mt [459, 1161] to begin reducing unsustainable waste treatment (via landfills and dumps), and to 1744 Mt [1143, 2610] to meet EC goals for the world. Our projections for the quantity of recycling and composting in 2030 is only 519 Mt [311 837]. Our projections for plastic waste discharged into the marine system are similar to those of Jambeck et al (2015). Our approach allows us to use both changing future plastic generation and dump treatment shares in order to explicitly model mismanaged plastic waste. Importantly, we note a peak in global plastic input into oceans, which is driven both by the levelling-off of plastic waste production per capita and especially the decrease in the usage of dumps as GDPpc increases for coastal countries.
The amount of cumulative plastic in the ocean must be interpreted with consideration of the base year. Here we use 1965 partly due to the range of our GDPpc data; this is to us a fair assumption given that widespread plastics usage only initiated in the 1950s (Geyer et al 2017). Because degradation and fragmentation rates at sea are generally still unknown, and there is evidence for mass accumulation of plastics in the open ocean (Law et al 2010, Galgani et al 2015, Jambeck et al 2015), we do not apply a degradation factor. Our total amount of plastics accumulated in the ocean from 1965 to 2025, 396 Mt [323, 484], compares reasonably with Jambeck et al (2015)'s 150 Mt, considering their use of 2010 as base year and the process uncertainties neglected in both studies. Plastic inputs from riverine watersheds will be important for future consideration, especially microplastics from poorly managed inland waste (van Calcar et al 2019, Schmidt et al 2017, van Wijnen et al 2019).
For GHG emissions, our projections are calculated at finer scale than other assessments (Monni et al, Fischedick et al 2014, Kaza et al 2018), due to differentiation by country, climate, waste type, and treatment, with dynamic future changes. Our value of 1385 Mt CO2e [957, 1971] from municipal solid waste in 2018 accounts for 3.7% [2.5, 5.3] of that year's global CO2 emissions (Friedlingstein et al 2019).
Due to temporal and process-based variability in nitrogen emissions from SWDS, we present here the first estimate showing the order-of-magnitude of the amount of nitrogen currently stored in SWDS, along with the yearly amount mobilized as Nr, as a proxy for the Nr potentially emitted in leachate. Decades-old landfills have similar levels of Nr in leachate as young ones, with full solubilization or emission of nitrogen requiring at least a century, providing evidence for high mobilized Nr stocks in landfills (Jokela and Rintala 2003, Kjeldsen et al 2002,Trabelsi et al 2000). This is especially important for Nr in un-controlled dumps, as ammonium is the main component of waste leachate, and is the most important local pollutant (Kjeldsen et al 2002). However, a more detailed leachate model is required to quantify the actual amount of various forms of nitrogen pollution stemming from waste. SWDS nitrogen stocks and flows are as yet unaccounted for in global nitrogen stock-taking (Fowler et al 2013).
Furthermore, N2O from landfills may contribute up to 20% of the global warming potential of landfill methane (Ishigaki et al 2016), though this value is not included in our assessment. As advanced denitrification technologies are increasingly implemented in landfills, these techniques may result in significant amounts of N2O release (Zhang et al 2019). N2O emissions from MSW are currently ignored in global emissions accounting methodologies (IPCC 2006, 2019), but are important given the high nitrogen stocks in landfills, which we quantify for the first time.
Our dataset only partially captures trends in waste generation that have just begun to unfold, such as increased digitalization, which may reduce paper use and the growth in projected paper waste (Latta et al 2016). The availability of GDP data from 1965 onwards allows us to backcast the waste projections; however, the accuracy of these predictions may not be congruent, given more recent technological developments, such as the use of plastics. In terms of pollution, our projection only provides a rough calculation of the order of magnitude. Our method can not yet account for the large variance in landfilling technology and future developments that can capture fugitive emissions from landfills—current average values are used. Furthermore, our assessment lacks an account of unreported (uncollected) waste, as well as global MSW trade, partly due to the lack of data (Tisserant et al 2017). MSW is managed by municipalities and cities, these have varying levels of infrastructure and management capabilities. In the Global South, waste collection systems are often informal or poorly regulated (Dias 2016). Large amounts of waste are burned openly at residences and dumpsites, producing air pollution (Wiedinmyer et al 2014). Calculating open burning of wastes was outside the scope of this study; including burning at dumpsites may increase our estimates of GHG emissions, reduce material and carbon stocks in waste, and importantly, allow for projections of human health impacts. Finally, certain dynamics such as tourism—especially in low-population island countries—are not captured, leading to potentially inflated estimates for these countries due to extra waste being produced from non-residents. Overall, MSW poses unique difficulties in accounting as well as management (Wilson and Velis 2015).
The Bayesian framework allows us to quantify uncertainty in regression parameters and residual uncertainty due to unexplained variability in the data. Both are combined in our projections (figures 1 and 4). Results reported and the accompanying dataset in the SI include 95% CI from the regressions, which are propagated through the environmental impact models. As such, our model results provide a range of likely results, which becomes more uncertain in the future given the scarcity of observations at higher GDPpc. In terms of waste types and treatments, while these projections are uncertain—in particular for waste treatment—they provide a first estimate of the future evolution of waste management at the national and global level. For these shares, the Dirichlet distribution utilizes the information contained in all waste shares, effectively drawing on data of all waste types and treatments to constrain the trajectory of each category.
Part of the residual uncertainty may be explained by inconsistencies in the World Bank data. The data is compiled and harmonized from a range of official governmental reports (i.e. OECD (Organisation for Economic Co-operation and Development) 2019), surveys of MSW treatment operators (Al-Maaded et al 2012), meta-analyses (Idrees and Mcdonnell 2016), or field measurements of MSW (Kumar et al 2009, Hakami and Seif 2015), among others. The quality of the reporting may therefore be difficult to ascertain, due to the point at which data is collected, the measurement used, and varying institutional capacities (Wilson and Velis 2015, Kaza et al 2018). Furthermore, there may be region- or country-specific fixed effects, such as established policy frameworks or cultural attitudes, which were not captured due to the lack of time-series data. However, the data in What a Waste is useful here given its degree of harmonization, as well as its breadth of coverage and disaggregation. The data has served as the basis for various waste-relevant analyses (van Wijnen et al 2019, Jambeck et al 2015, Geyer et al 2017, for example).
The other category of waste type in our data is a result of dissimilar reporting. Countries that do not follow the given categorizations in reporting MSW often aggregate other types of waste into the other category. Because we model this category, it can serve as an indicator of at least part of the data error, decreasing slightly over time. However, the amount of residual uncertainty suggests that variables other than GDP are important in controlling the variance in waste types and especially treatment shares. Candidate variables to include in future studies are the existence of specific waste policies and infrastructure, among others. We might further add estimates of data error to separate out this effect, e.g. as data weights in weighted regression similar to the population weights employed here or explicitly as a data error model integrated in the likelihood function.
5. Conclusion
Our analysis produces a global dataset of waste generation, disaggregated by type and treatment, for 217 countries and regions, from 1965–2100. As per capita waste production is linked to per capita income, richer developed countries continue to produce the most waste. Fundamentally, given current trends, we estimate that waste production will continue to rise in the future, with unsustainable treatments—especially landfilling—continuing to dominate. Many valuable and recyclable wastes would thus not be re-integrated within a circular economy; much potential remains for increased recycling and composting especially given organic wastes' declining but important share in terms of waste composition. Our projections with accompanying uncertainties provide an important tool for assessing many waste-related impacts. Given these projections, pollution from waste would further increase as well, even though our future estimates of dump treatments decrease. Furthermore, our estimates of nitrogen stocks and pollution indicate that some of the environmental threats from MSW may as of yet not be fully accounted for. As such, strongly directed policies and incentives are required to both reduce total waste generation as well as increase the share of waste treated sustainably.
Acknowledgments
We thank Perinaz Bhada-Tata, Silpa Kaza, and the entire What a Waste author team for the production and availability of their valuable dataset, as well as clarifications integral to this work. We would also like to thank Mr Shuntaro Koizumi and two anonymous reviewers for their helpful input in shaping the manuscript. The first author is supported by DAAD Study Scholarship for Graduates of All Disciplines (Personal Reference Number 57381416). This research has received funding from the SHAPE project. The project SHAPE is part of AXIS, an ERA-NET initiated by JPI Climate, and funded by FORMAS (SE), FFG/BMWFW (AT), DLR/BMBF (DE, Grant No. 01LS1907A-B-C), NWO (NL) and RCN (NO) with co-funding by the European Union (Grant No. 776608).
Data availability statement
The data that support the findings of this study are openly available at https://doi.org/10.6084/m9.figshare.12102510