


Abstract
Regions that produce a large supply of agriculture commodities can be susceptible to crop failure, thus causing concern for global food security. The contiguous United States, as one of the major agricultural producers in the world, is influenced by several large-scale climate oscillations that contribute to climate variability: Atlantic Multidecadal Oscillation (AMO), North Atlantic Oscillation (NAO), El-Niño Southern Oscillation (ENSO), Pacific Decadal Oscillation (PDO) and Pacific-North American (PNA). Since local weather conditions are associated with these climate oscillations through teleconnections, they are potentially causing changes of crop failure risks. The objective of this study is to assess climate-induced changes of annual crop failure risks for maize and winter wheat from 1960 to 2016, by analyzing the associations of large-scale climate oscillations with the frequency of crop failure in the rainfed regions of the United States using a Bayesian approach. The analysis revealed that crop failure frequencies showed contrast spatial patterns and different extent under different climate oscillation phases. Among individual oscillations, the positive PNA and negative AMO resulted in the most substantial increase in maize and winter wheat crop failures over a high percentage of climate divisions, respectively. Among oscillation combinations, the positive AMO and negative PDO and the positive AMO and positive PDO resulted in the highest percentage of climate divisions experiencing significant increase of maize and winter wheat crop failures, respectively. Random forest models with climate oscillations accurately predicted probabilities of crop failure, with the inclusion of local surface climate variables decreased or increased the predictive accuracy, depending on regions. These results revealed the plausible drivers of long-term changes of U.S. crop failure risks and underscore the importance for improving climate oscillation forecasting for early warning of food insecurity.
Export citation and abstract BibTeX RIS
1. Introduction
Agriculture systems in the modern era are becoming more interconnected, relying on high production regions deemed breadbaskets. Breadbaskets located in the mid-latitudes are more vulnerable (Teixeira et al 2013) especially as crop diversity is reduced (Lesk et al 2016). Many environmental and non-environmental factors contribute to yield decreases and crop failure such as drought, pests, political turmoil or a combination of factors (Sperling 1999, Goodwin 2001, Oerke 2006, Lesk et al 2011, Lesk et al 2016, Gaupp et al 2017). Globally, 30% of yield reductions are due to weather extremes (Gbegbelegbe et al 2014) and 39% of United States crop failure variation is attributed to the combination of temperature, precipitation, and soils (Mendelsohn 2007). The history of crop failure in the United States has experienced several events since 1980, the most recent being the droughts of 1988 and 2012, and the flooding of 1993. All three events caused multi-billion dollar losses in agriculture and property damages, resulting in crop failure ranged from around 20% to nearly 70% in regions around the Midwest (National Oceanic and Atmospheric Administration 1988, Kogan 2002, Rosenzweig et al 2002, Rippey 2015).
Globally, one-third of yield variability can be attributed to climate variability (Ray et al 2015), which impacts two-thirds of the global cropland, including breadbaskets (Heino et al 2018). Climate variability can be caused by reoccurring large-scale ocean-atmospheric circulations called climate oscillations. One oscillation, the El Niño Southern Oscillation (ENSO), has been the subject of many agricultural climate impact studies at regional or global scales (e.g. Hansen et al 1998, Martinez et al 2009, Tack and Ubilava 2013, 2015, Iizumi et al 2014, Anderson et al 2017, 2018, 2019, FAO, IFAD, UNICEF, WFP, WHO 2018, Ubilava and Abdolrahimi 2019). Besides ENSO, there are different climate oscillations in Atlantic and Pacific oceans influencing global agriculture through teleconnections. The Atlantic Multidecadal Oscillation (AMO) causes changes in precipitation promoting drought in the United States and temperature changes in Brazil and China (Enfield et al 2001, McCabe et al 2004, Knight et al 2006, Li and Bates 2007). The North Atlantic Oscillation (NAO) prominently influences the intensity of winter conditions in Asia, Europe, and the United States (Visbeck 2002, Wang and You 2004). Similar to ENSO, Pacific Decadal Oscillation (PDO) and Pacific North American (PNA) result in less precipitation in the Ohio and Tennessee River valleys and more precipitation along with the Southeast coastal states (Di Liberto 2016). Influences in agriculture production have also been linked to these climate oscillations regionally and globally (Iizumi et al 2014; Ray et al 2015, Anderson et al 2019). While European agriculture experiences decreases in wheat and varied spatial yield response from maize under negative NAO conditions, the United States shows a small increase in the average of wheat and maize yields (Kim and McCarl 2005). PDO and ENSO interactions cause yield changes in the Midwest United States (Henson et al 2017). Maize yields in the southeast United States are founded to be affected by PNA (Martinez et al 2009). While these previous studies have explored the relations between climate oscillations and crop yield variability, few studies have focused on revealing the linkage between crop failures and all the aforementioned influential climate oscillations in Atlantic and Pacific oceans.
Our recent study (Schillerberg et al 2019) has explored spatial and temporal variability of 5-year moving average yields of maize and winter wheat crops and their linkages with climate oscillations, and found AMO is a major factor associated with dominant spatial and temporal variations of maize and winter wheat yields in the rainfed regions of the United States, and the categorical forecasts of low and high yields were well predicted by climate indexes. As a step forward, this paper aims to explore the connections between annual crop failure events and monthly climate oscillations considering the uncertainties in the teleconnections of climate oscillations and maize and winter wheat crop failure risks over the rainfed regions of the contiguous United States (CONUS), a breadbasket of the world. Methodologically, regression models have been widely used for assessing climate impacts on agriculture (e.g. Tack and Ubilava 2013, 2015; Anderson et al 2017, Blanc and Schlenker 2017, Ubilava and Abdolrahimi 2019). However, the small number of samples for different phases of climate oscillations means that the robustness of the assessment for quantifying the linkages between crop yields and climate oscillations is inherently uncertain. This study uses a Bayesian approach, which frequencies of crop failures as a posterior distribution conditioned on the phases of climate oscillations, allowing us to quantify the uncertainties of the influence of climate oscillations on crop failure frequencies using the conditional posterior distribution. Following each analysis, there is a discussion of probable causes leading to crop failure, resulting from known impacts of climate oscillations. Finally, random forest models with climate oscillations as predictors and local surface climate variables as control predictors are developed and evaluated for crop failure predictions. The knowledge and information gained from this study will be useful for informing food security management, agribusiness, and climate risk management in agriculture.
2. Data and methods
2.1. Study area, yield data, climate indexes, and local surface climate variables
The study area for this research covered most of climate divisions located in the eastern regions (100°W Meridian) of the United States, where majority of the agricultural lands are rainfed. Irrigation present in portions of Nebraska, Kansas, Texas, Arkansas, and Georgia (NASS 2014a, 2014b) can counteract climate impacts, therefore playing a less important role over irrigated regions. More information about this region and climate divisions can be found in supplementary information S1.1.
Annual county-level crop yield and production data were retrieved for maize and winter wheat from 1960 to 2016 from the National Agricultural Statistic Service (NASS) of the United States Department of Agriculture (USDA) (via https://quickstats.nass.usda.gov/). These crops are considered as the most important summer and winter crops in the United States. Maize and winter wheat yields for each climate division were calculated using weighted averages of county-level yields where county-level yield productions were used as weights. Preprocessing and quality control are conducted to ensure the temporal completeness of the crop yield data for each climate division. After preprocessing, the yield data was de-trended using Ordinary Least Squares. De-trending helps to minimize the combined effects of changes in agro-management practices, technology, socio-economic factors, and climatic changes. Conducting the preprocessing procedures resulted in complete datasets of 240 climate divisions for maize from 1960 to 2016, and 222 climate divisions for winter wheat from 1967 to 2016. More information on preprocessing techniques can be found in supplementary information S1.2.
Monthly climate indexes data for quantifying climate oscillations, AMO, NAO, ENSO, PDO, and PNA, are obtained from different sources, including Earth System Research Laboratory at National Oceanic and Atmospheric Administration (NOAA), National Center for Atmospheric Research (NCAR), the Joint Institute for the Study of Atmosphere and Ocean at the University of Washington, and NOAA Climate Prediction Center. Point-Biserial Correlation (Tate 1954) was used to determine the lag correlation between monthly climate indexes and crop failure at each climate division, assuming a reference harvest month of October and July for maize and winter wheat, respectively. Significant correlations are determined by passing the indexes and crop failure time series to a Monte Carlo simulation (Livezey and Chen 1983) to account for the autocorrelation present in serial data. The Monte Carlo simulation shuffled the time series of the indexes and determined correlation with crop failure for 20 000 iterations. The lag correlation allows for measuring the delayed impact of large-scale climate circulations on the local conditions of each climate division. The follow-up Bayesian analysis is conducted for each climate division based on the phases of climate oscillation index in the month with the maximum lag correlation. The climate oscillation index is in positive phase (+) when its value is greater than 0, and is in negative phase (−) when its value is smaller than 0. Hereafter, we note positive oscillation phase as Oscillation Name+ (e.g. AMO+), and negative oscillation phase as Oscillation Name- (e.g. AMO−). For a risk assessment perspective, we also calculated the likelihood of individual and combined climate oscillation phases for each month and overall period as:  where a is the number of occurrences, and n is the number of years (Wilks 2011).
Monthly surface climate variables for each climate division, including maximum and minimum temperature (Tmax and Tmin), precipitation, and Palmer Drought Severity Index (PDSI), are obtained from the National Center for Environmental Information (NCEI). Surface climate variables are processed by taking an average over the three months prior to harvest, which are July, August, September for maize and April, May, June for winter wheat (Sacks et al 2010, Nleya 2012, Berglund et al 2013, Iizumi et al 2014). These months cover the reproductive stage, a time when crops are more sensitive to their climate environments (Mourtzinis et al 2016, Ceglar et al 2017).
2.2. Bayesian approach to assess the influence of climate oscillations on crop failures
A Bayesian approach allows for the assessment of uncertainties based on prior knowledge with a limited sample size. Previous studies have used Bayesian approaches to assess uncertainties in drought forecasting (Hobbs 1997, Raje and Mujumdar 2010, Madadgar et al 2013), hurricane intensity (Elsner and Bossak 2001), detection, analysis and attribution of climate change in agriculture (Dose and Menzel 2004, Iizumi et al 2009), and uncertainties of climate impacts concerning hydrology (Kam et al 2014, Sun et al 2015). Here, we analyze the changes of crop failure risks associated with climate oscillations using a similar Bayesian approach as in Kam et al (2014) for analyzing drought risks. For this study, crop failure is defined when the yield falls below the lower quartile of the empirical distribution of yield in a climate division. Defining crop failure as the lower quartile allows the capture of regional events that may have decreased yield production such as flooding, heatwave, or drought. However, this method may not well capture total crop loss due to smaller-scale events such as hail, or instances where producers changed intended crop use due to total loss (Nleya 2012). Each crop failure for a climate division is treated as a sample of a Bernoulli process, and each crop failure occurrence X follows a Bernoulli trial with crop failure occurrence equals 1, and non-crop failure occurrence equals 0. From 1960 to 2016, there are 14 and 13 crop failures for maize and winter wheat, respectively; this is used to calculate the expected frequency of 0.25 for both crops.
The Bayesian approach allows the use of the Bernoulli process to compute the posterior distribution of crop failure. Detailed information regarding the Bayesian approach can be found in Supplemental material S1.3. In order to examine the impact of climate oscillations on crop failure occurrence, conditional posterior distributions of crop failure are computed based on a subset of the crop yield data given the phase of a climate index: Pr(p|X, Y), where Y is the phase (positive and negative) of monthly climate index values. Conditional posterior distributions are computed for each climate division based on phases of climate index and compared with the posterior distribution derived using the de-trended crop yield data. An example of the conditional posterior distribution is displayed in figure S1 (stacks.iop.org/ERL/15/064035/mmedia). An increase in crop failure frequency occurs when the expected value of the conditional posterior distribution for crop failure is greater than that of the original posterior distribution Pr(p > 0.25|X, Y). A significant increase in crop failure frequency occurs when the expected value of the conditional posterior distribution meets or exceeds the 90th or 95th percentile of the original posterior distribution.
Climate oscillations interact with each other intensifying or weakening their impacts. Therefore, the same Bayesian approach is performed to construct conditional posterior distributions with the likelihood function dependent on combinations of climate oscillations phases and the occurrences of crop failure. We chose two phase combinations AMO-PDO and ENSO-PDO for this analysis. This is because combined ENSO, AMO, and PDO interactions had strong regional climate impacts in North America (Gershunov and Barnett 1998, Hu and Huang 2009; Hu and Feng 2012; Johnson et al 2013; Kushnir et al 2010, Mantua et al 1997; Maleski and Martinez 2018, McCabe et al 2004; Tootle et al 2005), and these climate impacts may propagate to crop growths and yields. McCabe et al (2004) found the combination of AMO and PDO explained spatial and temporal variations in drought in the United States. ENSO and PDO have similar spatial impacts under agreeing phases (Mantua et al 1997, Hu and Huang 2009). Tootle et al (2005) identified the interactions between the AMO, PDO, and ENSO on hydrologic conditions in the southeastern United States. A recent article by Maleski and Martinez (2018) identified the combined interactions of AMO, PDO, and ENSO on regional climate in the Alabama–Coosa–Tallapoosa and Apalachicola–Chattahoochee–Flint river basins. Because of these identified impacts on regional climate, it is worthwhile to investigate the combined effects of AMO, PDO, and ENSO oscillation phases on crop failures.
2.3. Random forest model to predict occurrences of crop failures
The classification based random forest model was used to predict probabilities of crop failures for each climate division. Random forest is based on ensemble machine learning algorithms that utilize a decision tree model approach. Random forest constructs multiple decision trees using bootstrapped resamples of the training data (See Breiman 2001, Liaw and Wiener 2002, for more details). Two sets of random forest models were constructed using the R randomForest package (Liaw and Wiener 2002). The first model used climate oscillation indexes to predict crop failure occurrence. The second model include both climate oscillation indexes and local surface climate variables (i.e. Tmax and Tmin, precipitation, and PDSI), as local confounding variables. The random forest models were cross-validated using leave one out cross-validation. By comparing these two sets of models, we will know if inclusion of the local climate variables would have positive or negative effects on the accuracy of crop failure predictions. A confusion matrix was constructed using the testing data to calculate accuracy for each climate division. Accuracy of crop failure predictions was calculated as follows:
Where Hits means event forecast to occur and did occur, Correct negatives means event forecast not to occur, and did not occur, an accuracy value equal 1 indicates perfect accuracy.
3. Results and discussion
3.1. Temporal patterns of crop failures, correlations with climate oscillations, and likelihood of climate oscillation phases
The percentage of climate divisions that experience annual crop failure is calculated for maize and winter wheat and shown as a time series in figure 1. Plotted in figure 1 is monthly climate indexes with a 12-month moving average for visual comparison with the percentage of climate divisions experiencing crop failures. It shows that the variations of climate oscillation indexes are generally preceding the variations of crop failures.
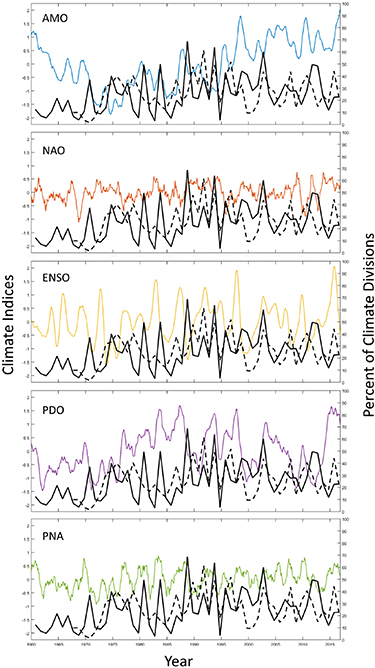
Figure 1. Time series displaying the percent of climate divisions experiencing crop failure for maize (solid) and winter wheat (dashed) in the eastern United States, plotted against a 12-month moving average of each climate index.
Download figure:
Standard image High-resolution imageOn average, 25% of maize (60) and winter wheat (56) climate divisions experienced crop failure over their respective study periods. A high percentage of maize climate divisions experience crop failure in 1988, 1983, 2002, 2011, and 2012. During the crop failure years, widespread heat, drought, and flooding occurred throughout the growing seasons (table 1). Excess moisture, winter kill, and drought are common causes of winter wheat crop failure in 1989, 1991, 1993, 1996, and 2015.
Table 1. List of major crop failure events, the percentage of climate divisions affected, and the weather event that caused the failure for maize and winter wheat.
| Year | Percentage of climate divisions | Event | Reference | |
|---|---|---|---|---|
| Maize | 1988 | 68.75 | Drought | National Oceanic and Atmospheric Administration 1988; Opie 1992; Trenberth et al 1988 |
| 1993 | 63.75 | Flooding, Drought | Lott 1993; National Oceanic and Atmospheric Administration, National Weather Service, National Agricultural Statistics Service, World Agricultural Outlook Board 2019 | |
| 2002 | 60.00 | Drought | National Drought Mitigation Center, U.S. Department of Agriculture, National Oceanic and Atmospheric Association 2019; Reyes and Elias 2019 | |
| 1983 | 50.00 | Drought | Hillgren 1984; King, S.S. 1983; National Oceanic and Atmospheric Administration, National Weather Service, National Agricultural Statistics Service, World Agricultural Outlook Board 2019 | |
| 1980 | 49.58 | Drought | Leath et al 1982; National Oceanic and Atmospheric Administration, National Weather Service, National Agricultural Statistics Service, World Agricultural Outlook Board 2019 | |
| Winter Wheat | 1991 | 61.26 | Excess Precipitation, Cold Weather | Abbott 1991; Byers 1991; Merry 1991; National Oceanic and Atmospheric Administration, National Weather Service, National Agricultural Statistics Service, World Agricultural Outlook Board 2019 |
| 1996 | 51.80 | Winterkill, Cold Weather | Bureau of Labor Statistics, U.S. Department of Labor 1998 | |
| 1993 | 49.10 | Excess Precipitation, Drought | Lott (1993) and National Oceanic and Atmospheric Administration, National Weather Service, National Agricultural Statistics Service, World Agricultural Outlook Board (2019) | |
| 1989 | 47.75 | Drought | National Oceanic and Atmospheric Administration, National Weather Service, National Agricultural Statistics Service, World Agricultural Outlook Board (2019), Reid (1989), and Robbins (1989) | |
| 2015 | 44.14 | Drought, Excess Precipitation | Durisin (2015), National Oceanic and Atmospheric Administration, National Weather Service, National Agricultural Statistics Service, World Agricultural Outlook Board (2019), and Reyes and Elias (2019) |
In the supplementary information S2.1, we provided lagged correlations between crop failures and monthly climate index at each climate division. The results suggest maize crop failures have highest correlations with most indexes during autumn months into late winter and spring months; winter wheat crop failures have the highest correlations with most of indexes during July to August and early winter, depending on regions (figures S2 and S3). Tables S1 and S2 in supplementary information S2.2 present the overall and monthly likelihood of individual and combined oscillation phases during 1960–2016. Overall, for the positive (negative) phase climate oscillation, ENSO is most (least) likely to occur, followed by NAO, PDO, PNA, and AMO. For the phase combinations, AMO−/PDO+ is most likely to occur, followed by ENSO+/PDO+, AMO−/PDO−, ENSO+/PDO−, ENSO−/PDO+, AMO+/PDO+, ENSO−/PDO−, AMO+/PDO−, respectively. Knowing this likelihood along with the information from the following Bayesian analysis, we can further examine risks of crop failure associated with climate oscillations.
3.2. The impact of individual climate oscillation on maize crop failure frequencies
The Bayesian analysis revealed that the crop failure frequencies showed contrast spatial patterns and different spatial extents under different climate oscillation phases (figure 2). In the left panel of figure 2, it shows PNA+ resulting in the largest number of climate divisions (119, in the east of the Mississippi River) experiencing a significant increase frequency of maize crop failure (table 2). The difference in the number of climate divisions experiencing significant increases in crop failure frequencies between positive and negative oscillation phases is the largest for PNA. PNA+ is associated with below average temperature across the south-central and southeastern U.S. during winter and early spring (Leathers et al 1991, Climate Prediction Center Internet Team 2012). The colder spring temperature due to PNA+ caused freezing soils, cooler soil temperature, and wet early season soil conditions, which delayed planting date. Significant maize yield reductions were found when planting was delayed in mid-South (Bruns and Abbas 2006) and southeast (Wiatrak and Wright 2004) as well as in Corn Belt states (Swanson and Wilhelm 1996) mainly due to more frequent influence and pest and diseases at late planting (Long et al 2017). PNA+ may have caused the delayed planting dates, leading to crop failure nearly 50% (115) of maize producing climate divisions in 2012.
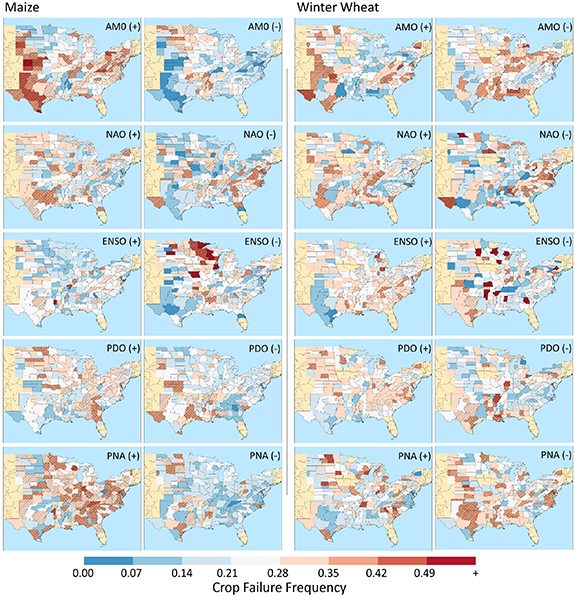
Figure 2. Annual crop failure frequency of maize (left) and winter wheat (right) during each phase of climate indexes. Climate divisions with blue coloring indicate a decrease in crop failure frequency relative to the posterior distribution, while red coloring indicate an increase in frequency. Hashed climate divisions indicate significant increase in crop failure frequency at the 90th level, while cross hatching indicates significant increase at the 95th level.
Download figure:
Standard image High-resolution imageTable 2. The number of climate divisions that experience a significant increase in maize and winter wheat crop failure at the 90th and 95th significance level under different phases of climate indexes. The climate indexes with the largest numbers of climate divisions experiencing crop failures are underlined and highlighted in bold.
| Climate Index | Number of Climate Divisions | |||
|---|---|---|---|---|
| Crop | Phase | 90th | 95th | |
| Maize | AMO | + | 97 | 53 |
| AMO | − | 24 | 9 | |
| NAO | + | 57 | 20 | |
| NAO | − | 51 | 30 | |
| ENSO | + | 19 | 8 | |
| ENSO | − | 40 | 24 | |
| PDO | + | 46 | 16 | |
| PDO | − | 37 | 15 | |
| PNA | + | 119 | 69 | |
| PNA | − | 26 | 12 | |
| Winter Wheat | AMO | + | 35 | 23 |
| AMO | − | 53 | 20 | |
| NAO | + | 33 | 15 | |
| NAO | − | 38 | 27 | |
| ENSO | + | 18 | 9 | |
| ENSO | − | 31 | 24 | |
| PDO | + | 13 | 10 | |
| PDO | − | 28 | 19 | |
| PNA | + | 45 | 23 | |
| PNA | - | 48 | 28 | |
AMO+ significantly increases the crop failure frequency in 97 climate divisions (Southern Plains and Northeast), making it the second-largest influential oscillation on maize failure frequency next to PNA (table 1, figure 2). A large extent of area under AMO+ conditions experience an increase in crop failure frequency. In contrast, under AMO- conditions, the eastern United States largely experiences a decrease in frequency with only 24 climate divisions (northern Great Plains and Arkansas) experiencing a significant increase in frequency. Drastic changes in frequency is likely a result of the association between AMO and drought in the United States, noted by Enfield et al (2001), Kam et al (2014), and McCabe et al (2004). Drought occurrences influenced by AMO are likely to extend multiple years due to AMO's long oscillation period. Long-lasting droughts deplete soil moisture reserves, affect all growth stages, and potentially reduced yield more than 60% (Çakir 2004, Song et al 2018). AMO+ events may have contributed to drought conditions and influenced failure in the 1998, 1999, 2011, and 2012 growing seasons.
NAO+ and ENSO− result in 57 and 40 climate divisions, respectively, experiencing significant increases in crop failure frequency. Under NAO+, regions experiencing an increase in failure frequency is northern Midwest and eastern Texas to western Mississippi, similar to Heino et al (2018), this area is one of the most sensitive regions to the changes of NAO phases. However, Kim and McCarl (2018) found an increase in 12 simulated crops production under NAO+. NAO− results in 51 significantly impacted climate divisions (East coast), with portions of the Midwest experiencing decreases in crop failure frequency. The lack of negative impacts on yields agrees with the slight yield increase under NAO-, as found by Kim and McCarl (2005). The results indicate that ENSO- conditions cause a significant increase in crop failure in the northern Midwest region, with 13 climate divisions significant at the 95th percentile of the posterior distribution. Spatial patterns of crop failure frequencies are consistent with yield changes due to ENSO noted by Henson et al (2017) and Iizumi et al (2014). The ENSO— is associated with more precipitation and warmer temperatures in the eastern Midwest, which may promote the growth of diseases and pests, reducing crop yields. Excess precipitation before planting can delay planting and prevent field maintenance during the vegetative period impacting yields prior to the reproductive period (Baum et al 2019). These combined factors likely contributed to crop failure in the upper Midwest in 2011.
The two phases of PDO result in a similar amount of climate divisions experiencing significant increases in crop failure frequency (table 1). Similar to previous oscillations, there is a distinct spatial pattern in crop failure frequencies under different phases. Spatial patterns of the crop failure under both PDO regimes agree with spatial distributions of drought frequency increases found by Kam et al (2014). Continuous PDO+ through 1992–1993 and NAO+ winter may have contributed to the excess moisture that caused flooding and delayed planting resulting in 64% (153) of climate divisions experiencing crop failure.
3.3. The impact of individual climate oscillation on winter wheat crop failure frequencies
Table 2 shows that, on average, unlike maize, winter wheat has a smaller portion of climate divisions experiencing a significant increase in crop failure under different climate phases, 22% versus 15%, respectively. The number of climate divisions experiencing significant crop failure varies from 53 under AMO− conditions to 13 under PDO+ conditions. The change in AMO phase result in the largest difference of climate divisions (18) experiencing significant increases in winter wheat failure frequencies. AMO− is associated with increases in precipitation, which may cause flooding in the Ohio and Mississippi River Valleys (Enfield et al 2001, Rogers and Coleman 2003). Exposed lengths of time to flooding or ponding water cause decreases in wheat yields (Olgun et al 2008). PNA± results in a similar amount of climate divisions experiencing significant increases in crop failure. The combination of AMO− and PNA+ may have influenced wet and cold conditions in southern states in 1975, preventing fieldwork and delaying growth.
Regions that experience a significant increase in crop failure varies by phases of climate indexes (figure 2, right panel). NAO+ results in two major areas of significant increase in crop failures, including the Ohio River Valley and western Texas through Nebraska. Reasons for the increase in crop failure frequency under NAO+ may be due to warmer temperatures and increased precipitation. Warmer winters may cause the winter wheat to come out of dormancy earlier, resulting in increased susceptibility to spring frost and drought, decreasing the quantity and quality of winter wheat yields (Olgun et al 2008, Nleya 2012, Trnka et al 2014). NAO+ during the winter of 1992–1993, may have contributed to overly wet conditions and increase susceptibility to cold, causing 49% (109) of climate divisions to experience crop failure. In contrast, Under NAO−, the aforementioned areas decrease in frequency with much of the study area experiencing decreases or insignificant increases in failure frequency due to the opposite conditions caused by the NAO−.
ENSO+ conditions induce significant increases in winter wheat failure in the southeast (figure 2). This increase in crop failure frequency is likely due to cooler, wet conditions that can promote frost kill and growth of fungal diseases, both of which can significantly reduce winter wheat yields (Cunfer 2000, Cook 2001). The Southeast experiences an increase in winter wheat failure during ENSO+ events, likely due to wet conditions promoting flooding and pests. The Southeast experienced crop failure in 1993 due to wet conditions and plant diseases, which may be a result of ENSO+. PDO+ causes increases in crop failure frequency in the Great Plains and Southeast. While PDO− increases crop failure in western Texas and Louisiana to Arkansas. As expected, PDO and ENSO of simultaneous phases have a similar but more aggravated impact on spatial distributions of crop failure frequencies.
3.4. The combined impacts of climate oscillations on crop failure frequencies
3.4.1. Phase combinations of AMO-PDO impact on crop failure frequencies
The number of climate divisions experiencing significant increases in crop failure frequencies varies widely among different AMO-PDO phase combinations (table 2). When AMO+ and PDO− concurred, the largest number of climate divisions experience significant increases in maize crop failure frequencies. Regions experiencing decreases in maize crop failure are the northern Great Plains and Arkansas (figure 3). Conversely, AMO−/PDO− combination have the least number of climate divisions experiencing significant increases in maize crop failure frequency. Spatial impact patterns of maize crop failure frequencies in figure 3 are consistent with the findings of drought impacts in McCabe et al (2004). AMO-PDO combination impacts are concerning because of their long oscillations, which means favorable crop failure conditions could persist for several years reducing global maize productions.
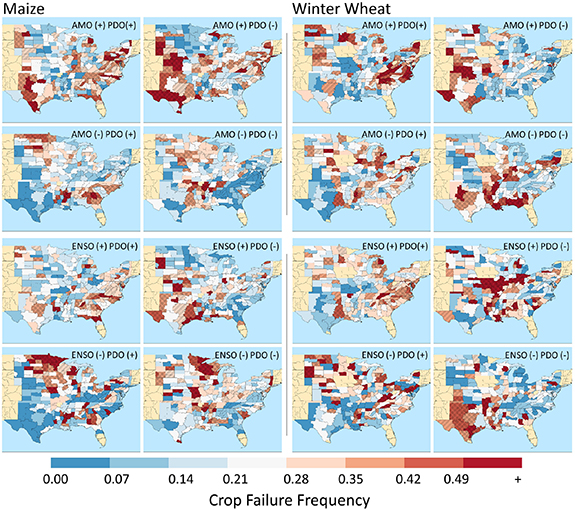
Figure 3. Annual crop failure frequency of maize during phase combinations of AMO and PDO, and ENSO and PDO for maize (left images) and winter wheat (right images). Climate divisions with blue coloring indicate a decrease in crop failure relative to the posterior distribution, while red divisions indicate an increase. Hashed climate divisions indicate significant increase in crop failure frequency at the 90th level, while cross hatching indicates significant increase at the 95th level.
Download figure:
Standard image High-resolution imageThe percentage of climate divisions experiencing significant winter wheat crop failure frequency increases vary from 18% (40) to 31% (69) (table 3). An out-of-phase AMO-PDO combination result in the largest contrast between regions of significant increases and decreases in winter wheat crop failure frequencies (figure 3). When AMO is positive, the Southeast decreases in crop failure frequency, while western Texas through Nebraska increases. The combination of AMO+/PDO+ results in the largest number of climate divisions experiencing significant increases in winter wheat crop failure frequency; this impacted region includes climate divisions in Nebraska and Georgia into the Northeast.
Table 3. The number of climate divisions that experience a significant increase in maize and winter wheat crop failure at the 90th and 95th significance level under different combinations of AMO-PDO and ENSO-PDO phases. The phase combinations with the largest numbers of climate divisions experiencing crop failures are underlined and highlighted in bold.
| Number of Climate Divisions | ||||
|---|---|---|---|---|
| Crop | Phase Combination | 90th | 95th | |
| Maize | AMO+ | PDO+ | 94 | 69 |
| AMO± | PDO− | 97 | 74 | |
| AMO− | PDO+ | 46 | 36 | |
| AMO− | PDO− | 40 | 33 | |
| ENSO+ | PDO+ | 57 | 37 | |
| ENSO+ | PDO− | 59 | 42 | |
| ENSO− | PDO+ | 69 | 42 | |
| ENSO− | PDO− | 66 | 45 | |
| Winter Wheat | AMO± | PDO± | 69 | 63 |
| AMO+ | PDO− | 40 | 36 | |
| AMO− | PDO+ | 60 | 48 | |
| AMO− | PDO− | 59 | 52 | |
| ENSO+ | PDO+ | 60 | 42 | |
| ENSO+ | PDO− | 65 | 55 | |
| ENSO− | PDO+ | 61 | 57 | |
| ENSO− | PDO− | 46 | 36 | |
3.4.2. Phase combinations of ENSO-PDO impact on crop failure frequencies
The combination of ENSO− and PDO+ results in a larger amount of climate divisions experiencing significant maize crop failure than the in-phase combinations of ENSO-PDO (table 3). When ENSO and PDO are in-phase, the southwestern Plains and the Carolinas experience a significant decrease in maize crop failure frequency (figure 3), coinciding with regions that receive less precipitation (Di Liberto 2016). When ENSO-PDO are out-of-phase, a similar but opposite pattern occurs, with expected negative impacts corresponding with increased maize crop failure frequency. When ENSO is negative and PDO is positive, the largest number of climate divisions experiencing an increase in maize crop failure frequencies are present (table 3 and figure 3).
Similar to maize, winter wheat shows the impact patterns present for the individual impact of ENSO are also present for the combined impact of ENSO-PDO (figure 3). In particular, the pattern is more dominate when ENSO is negative. Out-of-phase ENSO-PDO result in the largest number of climate divisions experiencing significant increases in winter wheat crop failure frequency at the 90th and 95th percentiles (table 3).
3.5. Accuracy of crop failure predictions
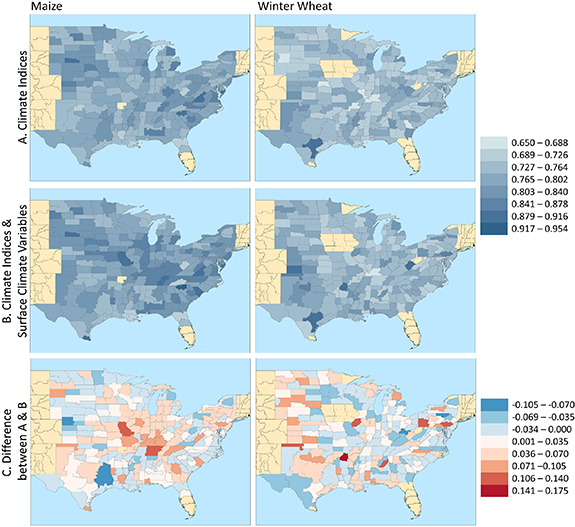
Figure 4 shows that the average accuracy of predicting maize crop failure is 0.91 and improves to 0.93 with the inclusion of surface climate variables. Overall, climate divisions have little (0.02) or no improvement with the inclusion of local surface climate variables. The largest extent of consistent improvement occurring in the Ohio Valley with the maximum improvement in accuracy of 0.11 occurs in Missouri (figure 4). A decrease in accuracy with the inclusion of surface climate variables occurs in Nebraska and Texas. The accuracy is lower for winter wheat for both random forest models. The average predictive accuracy is 0.88 using only climate indexes, and improves to 0.90 with the inclusion of surface climate variables. The average increase in accuracy is 0.01. In general, these results indicate that the ability of climate indexes to predict crop failure increased or decreased depending on regions, when local confounding variables (surface climate variables) are included in the random forest models. Regions like Pennsylvania experience both an increase and a decrease in accuracy with the inclusion of surface climate variables. Other areas of prominent decrease in accuracy include the Southeast, Texas, and the upper Midwest. An improvement occurs when inclusion of surface climate variables provided local information that is not explained by large-scale climate oscillations through teleconnection. However, predictions in climate divisions decrease in accuracy when the inclusion of surface climate variables do not provide additional information for the regions where the local climate variations are dominated by large-scale climate oscillations.
Figure 4. Accuracy of crop failure predictions using random forest model with climate indexes with (B) and without (A) surface climate variables as predictors for maize (left) and winter wheat (right). Darker values indicate higher scores. The third row shows the difference between climate indexes with and without surface climate variables. Positive (red) values indicate and improvement in accuracy with the addition of surface climate variables as predictors.
Download figure:
Standard image High-resolution image
4. Concluding remarks
In this study, we used a Bayesian approach to quantify the impact of climate oscillations on annual crop failures as a conditional posterior distribution for each climate division over the rainfed regions of the United States. The analysis revealed that crop failure frequencies showed contrast spatial patterns and different extent under different climate oscillation phases. PNA+ increased the maize crop failure frequency significantly at nearly 50% climate divisions, likely due to the delayed planting dates caused by lower temperature during early spring. AMO+ increases maize crop failure frequency significantly in 40% of the climate divisions, likely due to drought conditions present throughout the growing and reproductive period. In contrast, AMO— results in a significant increase in crop failure of maize in 10% climate divisions. Winter wheat experiences a lower percentage of climate divisions with significant increases in crop failure frequencies, likely due to higher levels of soil moisture from the winter months persisting into the spring and early summer reproductive period. In negative AMO conditions, 53 climate divisions experience significant increases in winter wheat failure frequency, the largest among individual climate oscillations phases. During positive PDO phases, few climate divisions experience significant increases in winter wheat failures.
Phase combinations of AMO-PDO and ENSO-PDO were analyzed to determine their impacts on crop failure frequency. Climate divisions experiencing significant maize crop failure frequency increased to 97 under AMO+ and PDO−. The largest decrease in crop failure frequency occurs when the in-phase negative AMO-PDO concurred. The in-phase negative AMO-PDO increase winter wheat crop failure frequency the most. The combination of ENSO-PDO showed that when the indexes are out-of-phase, the magnitudes of the winter wheat crop failure frequencies increases. ENSO+ and PDO− resulted in the highest number of climate divisions (65) experiencing a significant increase in winter wheat crop failure frequency. Random forest models with climate oscillation indexes showed high accuracy for predicting crop failures. The inclusion of local surface climate variables in random forest models led to increased or decreased prediction accuracy for maize crop failures and winter wheat crop failures, depending on regions.
Knowledge of increases or decreases in crop failure frequency due to changes of climate oscillations has the potential to improve early warning of crop failure at climate divisional level, because of the cyclic nature and predictability of climate indexes. Advances in seasonal climate forecasting would allow for a better prediction of climate oscillations, leading to an improvement in agribusinesses handling of operation and crop lost costs, seasonal climate risks, and mitigation practices to decrease vulnerability. While the impact of ENSO on agriculture has been well documented, this study demonstrates that not only ENSO but several climate oscillations individually or jointly modulate distributions of maize and winter wheat yields in the United States. From the insurance standpoint, these impacts can translate into economically meaningful effects on crop insurance premium rates, and the impact information can aid decision making in the context of crop insurance. Moreover, our study shows that the months of highest correlations between crop failures and climate oscillations varied in space and time, and the month of highest correlations are used for impact analysis of crop failures. This information may have implications for the time frame choice of the agricultural weather index insurance (WII). As suggested by Dalhaus et al (2018), it is important to consider occurrence dates and shifts of critical growth phases in space and time to improve agricultural weather index insurance. Future research on the implications of climate oscillations on crop insurance could incorporate these findings. From the prediction standpoint, future research may integrate information of climate oscillations and dynamic seasonal climate forecasts for improving crop failure predictions over different breadbasket regions of the world. Programs focused on food security (e.g. FEWS NET) would better be able to predict changes in global grain stores and price fluctuations that may result from crop failure in the United States.
Acknowledgment
This research was supported in part by the Auburn University intramural research grants, by the Alabama Agricultural Experiment Station and the Hatch program of the USDA National Institute of Food and Agriculture (NIFA) (Accession No. 1012578), by the USDA-NIFA Agriculture and Food Research Initiative Competitive Grant No. (G00012690), and by the NSF Research Traineeship Program (G00012677 & G00012678). The authors also want to thank Dr Weston Anderson at International Research Institute for Climate and Society, Columbia University for helpful discussions.
Data availability statement
The crop yield data for each climate division are available at https://doi.org/10.17605/OSF.IO/2H35Q. Monthly climate indexes data are obtained as follows: Physical Sciences Division of the Earth System Research Laboratory for AMO (https://www.esrl.noaa.gov/psd/data/timeseries/AMO/) and ENSO (https://www.esrl.noaa.gov/psd/data/correlation/nina34.data), National Center for Atmospheric Research for NAO (Hurrell 2017), the Joint Institute for the Study of Atmosphere and Ocean at the University of Washington for PDO (http://research.jisao.washington.edu/pdo/PDO.latest.txt), and NOAA Climate Prediction Center for PNA (http://ftp.cpc.ncep.noaa.gov/wd52dg/data/indexes/pna_index.tim). Monthly Tmax, Tmin, precipitation, and PDSI for each climate division are available through National Centers for Environmental Information at https://doi.org/10.7289/V5M32STR.
Highlights:
- A Bayesian approach is used to analyze the impact of climate oscillations on U.S. maize and winter wheat failures
- The analysis revealed that crop failure frequencies showed contrast spatial patterns and different extent under different climate oscillation phases
- Among individual oscillations, PNA+ and AMO— resulted in the most substantial increase in maize and winter wheat crop failures over the highest percentage of climate divisions, respectively
- Among oscillation combinations, AMO+/PDO− and AMO+/PDO+ resulted in the highest percentage of climate divisions experiencing significant increase of maize and winter wheat crop failures, respectively
- Random forest models with climate oscillation indexes showed increased or decreased predictive accuracy for crop failures when local surface climate variables are included, depending on regions.