

Abstract
Climate projections for the 21st century for CMIP6 are warmer than those for CMIP5 despite nominally identical instantaneous radiative forcing. Many climate modeling groups attribute the stronger warming in the CMIP6 projections to the higher climate sensitivity of the new generation of climate models, but here we demonstrate that also changes in the forcing datasets can play an important role, in particular the prescribed concentrations of greenhouse gases (GHG) that are used to force the models. In the EC-Earth3-Veg model the effective radiative forcing (ERF) is reduced by 1.4 W m−2 when the GHG concentrations from SSP5-8.5 (used in CMIP6) are replaced by the GHG concentrations from RCP8.5 (used in CMIP5), and similar yet smaller reductions are seen for the SSP2-4.5/RCP4.5 and SSP1-2.6/RCP2.6 scenario pairs. From the reduced ERF we can estimate the temperature at the end of the century in a full climate simulation with the CMIP6 version of the EC-Earth model but using CMIP5 GHG concentrations instead. For the new SSP5-8.5 and SSP2-4.5 scenarios we find that 50% or more of the temperature increase from CMIP5 to CMIP6 at the end of the century is due to changes in the prescribed GHG concentrations. The implication is that CMIP5 and CMIP6 projections for the 21st century are difficult to compare with each other not only as models differ but also as the forcing conditions are not equal. Therefore, the communication of CMIP6 results to the impact, mitigation and adaptation communities has to be carefully formulated, taking into account the role of the updated GHG concentrations when interpreting the warmer climate projections for the 21st century.
Export citation and abstract BibTeX RIS

Original content from this work may be used under the terms of the Creative Commons Attribution 4.0 license. Any further distribution of this work must maintain attribution to the author(s) and the title of the work, journal citation and DOI.
1. Introduction
The analysis of the new Coupled Model Intercomparison Project—Phase 6 (CMIP6, Eyring et al 2016) climate projections has started with first results being presented in the scientific literature and to a broader general public (Forster et al 2019). Many CMIP6 models show warmer temperatures at the end of the 21st century compared to simulations of the corresponding models for the previous intercomparison project CMIP5 (Carbonbrief 2019). Such a stronger warming will have severe implications and sharpen the situation related to the ongoing climate change. For instance, it implies that the remaining carbon budgets to limit global warming to 2 °C (or even 1.5 °C) above pre-industrial conditions will be revised downwards. Moreover, apart from making it more difficult to limit global warming in accordance with the Paris Agreement, it also implies that the warming for any amount of emitted greenhouse gases will be stronger and lead to more significant impacts earlier than previously considered. Consequently, already planned measures for climate change adaptation may not be sufficient and there might be a need to strengthen existing emissions reductions targets. Communication-wise, a sharpening of the message around potential future change may reduce public trust in the science if uncertainties are not framed in an adequate way (Howe et al 2019). Such a framing must rely on the understanding and communication of the reasons behind the differences between CMIP5 and CMIP6 results, thereby promoting trustworthy climate services building on actionable climate data and knowledge (Bowyer et al 2015).
Similar to other CMIP6 models the EC-Earth3-Veg model (Doescher and the EC-Earth Consortium 2020) shows a more pronounced warming during the 21st century compared to its predecessor EC-Earth v2.3 (Hazeleger et al 2013) that was used for CMIP5 (figure 1). A possible explanation for the substantially warmer temperature at the end of the 21st century is the higher equilibrium climate sensitivity (ECS) of the CMIP6 version of the EC-Earth model compared to the CMIP5 version. In CMIP6 the EC-Earth model has an ECS of 4.3 K while it was only 3.3 K in CMIP5. The increase in ECS can be predominantely tracked to an improved representation of the aerosol cloud interaction in the CMIP6 version (Wyser et al 2019).
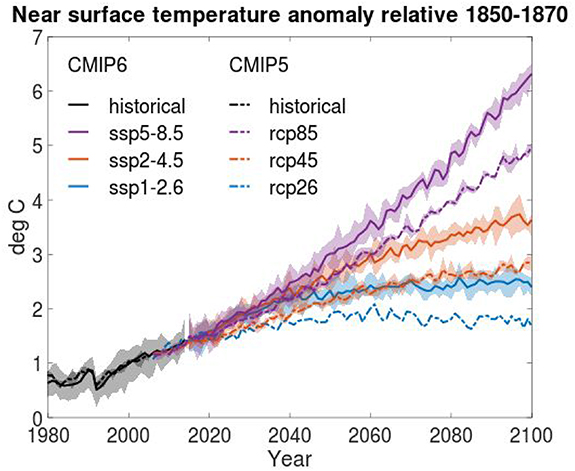
Figure 1. Temperature anomalies relative pre-industrial levels for CMIP6 with the EC-Earth3-Veg model (solid), and the previous results for CMIP5 with EC-Earth v2.3 (dashed). The CMIP6 results are considerably warmer at the end of the 21st century for scenarios with same nameplate radiative forcing. The solid or dashed lines denote the ensemble mean and the shaded area marks the full width of the ensemble. The ensemble consists of 6 members for CMIP6 and 3 members for CMIP5, except for RCP26 for which we only have 1 member.
Download figure:
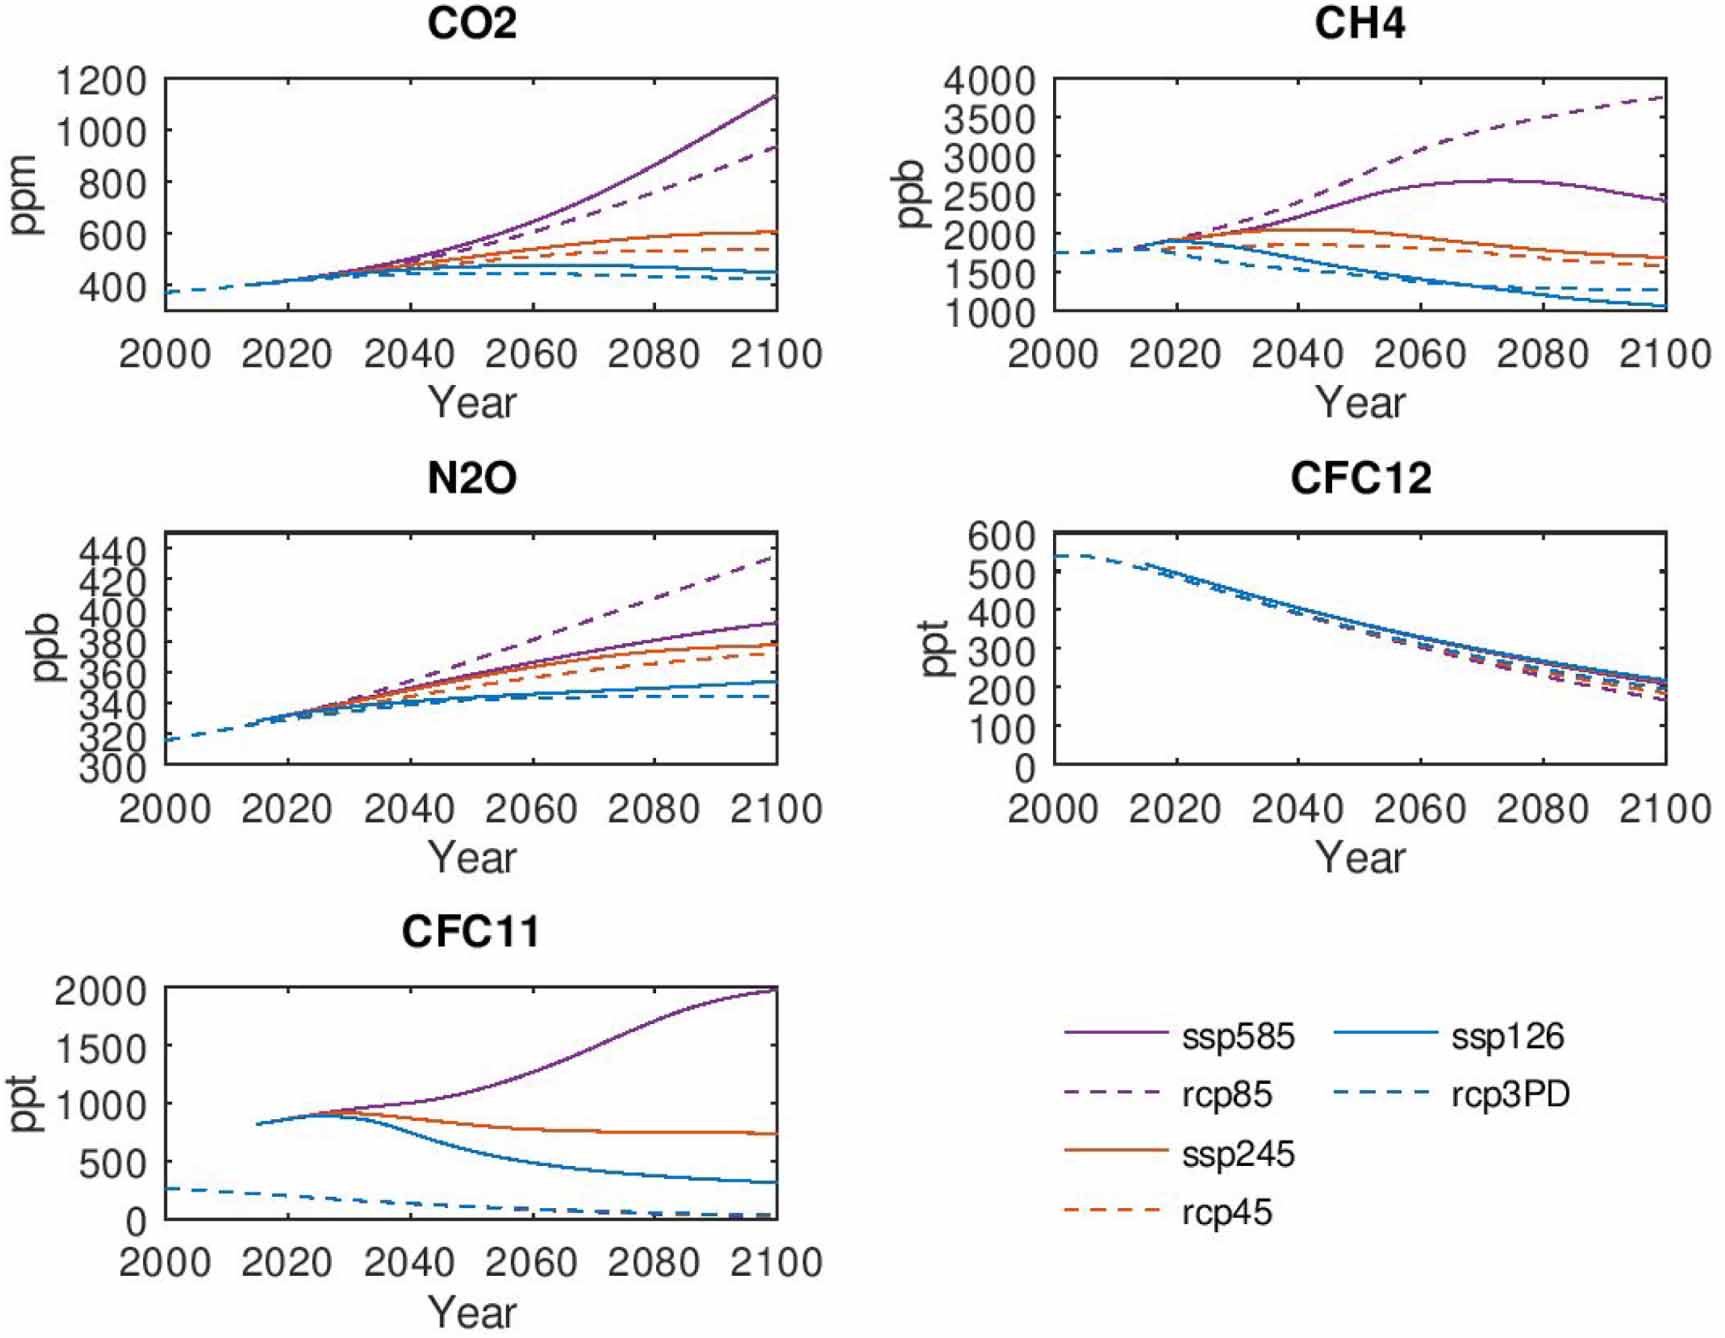
Standard image High-resolution imageHowever, the question is if the higher ECS alone can explain the full difference between CMIP6 and CMIP5 projections, or if other differences between CMIP5 and CMIP6 could also have contributed to the additional warming. One hypothesis is that the update of the forcing datasets from the representative concentration pathways (RCP) in CMIP5 (Moss et al 2010) to shared socio-economic pathways (SSP) in CMIP6 (Riahi et al 2017) might play a role. The new SSPs in CMIP6 have been created in a manner that their instantaneous radiative forcing matches that of the corresponding RCPs in CMIP5. Gidden et al (2019) find that the radiative forcings of the SSP2-4.5 and SSP5-8.5 scenarios track those from RCP4.5 and RCP8.5 pathways nearly exactly while there is a slight deviation in mid-century between SSP1-2.6 and RCP2.6. Despite the match in the instantaneous radiative forcing there are substantial changes in the emissions of individual greenhouse gases (GHG) between RCPs and SSPs (see figure 3 in Gidden et al 2019). This change in emissions translates into changes of GHG concentrations in the forcing datasets (Meinshausen et al 2019) compared to the GHG concentrations that have been used in CMIP5. Future climate projections as part of ScenarioMIP (O'Neill et al 2016) are driven by GHG concentrations, and thus changes in GHG concentration could lead to changes in the forcing for the projections. Meinshausen et al (2019) present an overview of GHG concentrations for the different SSPs and discuss changes to the RCPs used in CMIP5. In figure 2 we show the comparison for the GHG concentrations used in EC-Earth for CMIP5 and CMIP6. The CO2 concentrations are higher for all SSPs than for the corresponding RCPs while the situation is different for other GHGs. The CH4 and N2O concentrations are lower for SSP5-8.5 compared to RCP85, thus possibly compensating for the increased CO2 concentrations for CMIP6. However, for SSP2-4.5 the CH4 and N2O concentrations are higher in CMIP6 than those in CMIP5 which further amplifies the stronger forcing from increased CO2 concentrations in CMIP6. The biggest change seemingly has happened in the CFC-11 concentration with CMIP6 concentrations surpassing those from CMIP5 many times. This reflects the fact that the EC-Earth model for CMIP5 used the plain CFC-11 concentrations while for CMIP6 it uses the CFC-11eq concentration which is the radiative-efficiency weighted sum of all GHGs except CO2, CH4, N2O and CFC-12 (Meinshausen et al 2017). Thus, the EC-Earth model underestimates the radiative forcing from the less important GHG gases in CMIP5 while they are properly accounted for in CMIP6. The impact of the contribution from other trace gases to CFC-11eq is further discussed in the section 3.2.
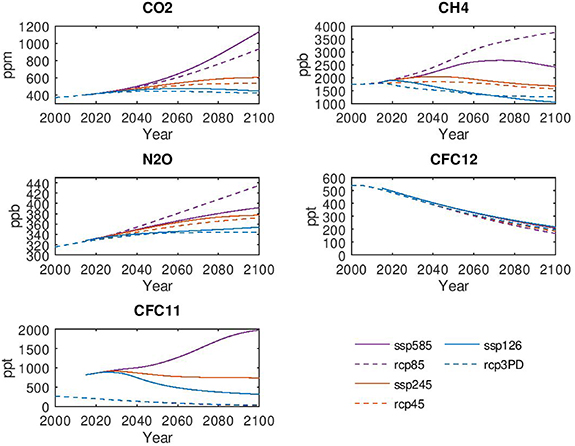
Figure 2. Annual global mean GHG concentration for CMIP5 (dashed) and CMIP6 (solid). Shown are only the GHGs that are used by EC-Earth. In the CFC-11 plot, the values shown for the RCPs are the plain CFC-11 concentrations while for the SSPs the CFC11eq concentrations are shown, see text for details.
Download figure:
Standard image High-resolution imageThe question is then what do all these changes in GHG concentrations mean for the forcing and subsequently the response of climate models in CMIP6. The instantaneous radiative forcing is not changing (Gidden et al 2019) but could there still be an impact from the changes in GHG concentrations? Meinshausen et al (2019) show that the global mean temperature in their simple carbon and climate model MAGICC7 (Model for the Assessment of Greenhouse Gas Induced Climate Change) is lower at the end of the 21st century with the new SSPs compared to RCPs. However, we find a higher temperature with the EC-Earth model for CMIP6 compared to CMIP5 and therefore wonder if and how much the changes in the GHG concentration could contribute to this warming. To test this hypothesis we compute the effective radiative forcing (ERF, see Myhre et al 2013) at the end of the century with the EC-Earth3-Veg model. The differences in the ERF when running the same model with CMIP6 and CMIP5 prescribed forcing datasets will reveal the importance of the changes in GHG concentrations and other forcings for the CMIP6 climate projections. Furthermore, by linking ERF to the change in global mean temperature we can provide an estimate for the contribution from the change in GHG concentrations to the warming signal at the end of the century.
2. Experiment design
To assess the differences between CMIP6 and CMIP5 forcings we look at the effective radiative forcing (ERF) from a series of atmosphere-only experiments with the EC-Earth3-Veg model. The ERF is the radiative forcing at the top of the atmosphere (TOA) after the rapid adjustments in the stratosphere and troposphere have taken place (see definition in Myhre et al 2013). To assess the ERF we make atmosphere-only (AMIP) experiments with prescribed climatological SST and sea ice concentrations (SIC). We follow loosely the RFMIP protocol (Pincus et al 2016) and make 20 year long simulations with monthly SST and SIC that are averages of annual cycle of the first 120 year of the pre-industrial control experiment (piControl) with EC-Earth3-Veg. The ERF is then evaluated as the time averaged TOA radiation imbalance over the entire 20 year long period.
For the atmosphere-only simulations here we use the exact same model configuration that was used for making the CMIP6 simulations shown in figure 1, but without the ocean and sea-ice components. The EC-Earth3-Veg model is described in detail in Doescher and the EC-Earth Consortium (2020). The EC-Earth3-Veg model comprises the ECMWF integrated forecast system (IFS cy36r4, documentation available on-line, e.g. www.ecmwf.int/sites/default/files/elibrary/2010/9232-part-iii-dynamics-and-numerical-procedures.pdf for the dynamics and ww.ecmwf.int/sites/default/files/elibrary/2010/9233-part-iv-physical-processes.pdf for the physical processes) as its atmosphere component, the NEMO3.6 ocean model (Madec and the NEMO Team 2016) including the LIM3 sea-ice model with 5 sea ice categories (Rousset et al 2015) and the LPJ-Guess dynamic vegetation model (Smith et al 2014). The horizontal resolution in the atmosphere is approximately 80 km and there are 91 levels in the vertical with a model top at 0.01 hPa. The 75 layer ocean model uses the tri-polar ORCA1 grid with 1 degree resolution and mesh refinement along the equator. The major differences to EC-Earth v2.3 (Hazeleger et al 2012 and references therein) that was used for CMIP5 are the higher horizontal and vertical resolution, an improved radiation scheme, an improved aerosol cloud interaction, an updated ocean model including a new sea ice model with five sea ice categories, and a dynamic vegetation model. The EC-Earth3-Veg model is forced with GHG concentrations, insolation, stratospheric ozone concentrations, optical properties of stratospheric aerosols, and landuse changes from the CMIP6 forcing datasets. The tropospheric aerosol forcing is a combination of a pre-industrial background that has been generated with the tracer transport and atmospheric chemistry model TM5 (van Noije et al 2014), and the simple plume representation of anthropogenic aerosols MACv2-SP (Stevens et al 2017). For the atmosphere-only simulations in this study we have run the EC-Earth3-Veg model with constant forcing, either with the forcing used for piControl or with perpetual forcing from year 2100 for each of the SSPs.
To test the impact of the changes in GHG concentrations in the ERF we then replace the GHG concentrations from the SSPs with those from the same nameplate RCPs. When replacing the CMIP6 forcings with their counterparts from CMIP5 the model will not be well tuned any longer and may experience a drift despite the constant forcing. Since it is not feasible to repeat the expensive model tuning with the CMIP5 GHG concentrations we make twin experiments with one experiment using the piControl forcing from CMIP5 or CMIP6, and the other the forcing at the end of the 21st century from the RCPs or SSPs, respectively. Both experiments are run for 21 years and global mean TOA fluxes are computed for each year. The average of the annual mean fluxes from the experiment with piControl forcing is subtracted from the average of the annual mean from the expriment with the forcing from 2100 to correct for a possible drift of the control climate in an untuned model setup.
3. Results
3.1. Impact from changing GHG concentrations
Table 1 summarises the ERF at the end of the 21st century from the AMIP experiments with climatological SST and SIC from piControl. It is worth noting that the ERF with CMIP6 forcings are larger than what the corresponding radiative forcing (RF) from the SSP name would suggest, for example the SSP5-8.5 scenario has a RF of 8.5 W m−2 but the ERF is found to be 9.2 W m−2. This is not a contradiction because the ERF includes adjustments in the stratosphere and troposphere, and thus accounts for some of the climate feedbacks. On the other hand, when looking at the right column in table 1 where the same experiment is repeated but with GHG concentrations taken from CMIP5 we find that the resulting ERF drops considerably below the nameplate RF value. The differences in ERF with CMIP6 GHG concentrations and with CMIP5 GHG concentrations are surprisingly large: between 1.4 W m−2 for the scenarios with a nameplate RF of 8.5 W m−2 scenario and 0.4 W m−2 for the 2.6 W m−2 scenarios.
Table 1. Effective radiative forcing (ERF) in W/m2 at the end of the 21st century. For the ERF listed in the column 'GHG conc from CMIP6' we have used all forcings from a given SSP as they have been used in CMIP6 experiments. The 'GHG conc from CMIP5' column lists ERF obtained with the same forcing except that GHG concentrations of the SSPs have been replaced by those from the RCPs with the same nameplate RF from CMIP5.
| GHG conc from CMIP6 | GHG conc from CMIP5 | |
|---|---|---|
| SSP5-8.5 | 9.2 | 7.8 |
| SSP2-4.5 | 4.9 | 4.0 |
| SSP1-2.6 | 2.8 | 2.4 |
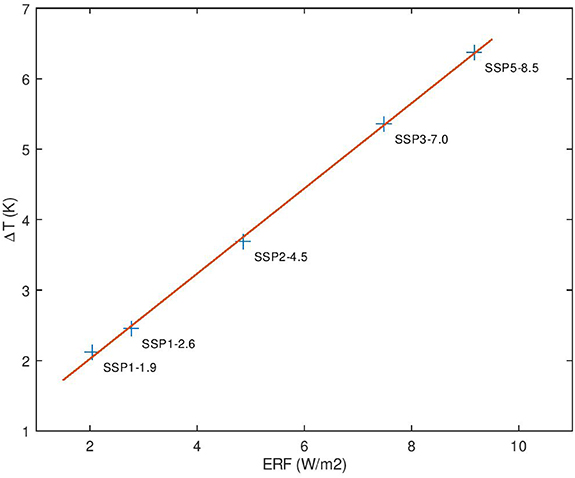
The large differences in ERF between experiments with CMIP6 and CMIP5 GHG concentrations certainly can explain part of the large differences in the warming of the CMIP6 and CMIP5 projections. To get an even better estimate of the warming if the CMIP6 experiments would have been done with CMIP5 GHG concentrations instead we look at the relationship between ERF and the warming at the end of the century in CMIP6 simulations from EC-Earth3-Veg. It turns out that the warmings for the different scenarios all lie along a line (figure 3) which allows us to fit a linear function,

Figure 3. Warming at the end of the 21st century vs ERF for the EC-Earth3-Veg model. The blue crosses are the warming of the ensemble means from the CMIP6 ScenarioMIP experiments while the ERF was obtained from the AMIP experiments with the SSP forcings for CMIP6 from the end of the century. The red line is the linear fit to the data given by (1).
Download figure:
Standard image High-resolution image
With this equation we can get an estimate for how large the warming would have been if the CMIP5 GHG concentrations had been used in the CMIP6 experiments. The results are listed in the 4th column of table 2. Also shown in the table are the warming from the CMIP6 experiments and the warming from the corresponding CMIP5 experiments with the same nameplate RF. The warming at the end of the 21st century is the average global mean temperature of the period 2080–2100 in each of the scenario experiments minus the 1850–1870 average of the historical experiment for CMIP6 and CMIP5, respectively. With the estimated warming with CMIP5 GHG concentrations given by (1) we can estimate how much of the warming increase from CMIP5 to CMIP6 is due to the change in GHG concentrations in the forcing datasets. The fraction of the warming varies between 60% for SSP5-8.5 and 28% for SSP1-2.6. These results indicate that an important part of the change in the warming from CMIP5 to CMIP6 could be explained by the changes in the GHG forcing datasets. In particular, for the higher scenarios we find that changes in the GHG concentrations possibly may have contributed with 50% or more to the extra warming in CMIP6.
Table 2. Warming (in K) at the end of the 21st century in the CMIP5 and CMIP6 experiments relative to pre-industrial conditions. The experiments for CMIP5 were done with the RCP forcings with the same nameplate RF (shown in parenthesis) as the SSP, while those for CMIP6 were done with the SSP forcings. The 4th column shows the estimated warming if the CMIP6 experiments would have been done with CMIP5 GHG concentrations instead. The 5th column lists the fraction of the change in warming from CMIP5 to CMIP6 that can be explained by the changes in GHG concentrations between RCPs and SSPs.
| SSP5-8.5 | 4.97 (RCP8.5) | 6.37 | 5.54 | 0.60 |
| SSP2-4.5 | 2.83 (RCP4.5) | 3.69 | 3.26 | 0.50 |
| SSP1-2.6 | 1.67 (RCP2.6) | 2.45 | 2.24 | 0.28 |
3.3. Sensitivity to CFC-11eq
When adapting the EC-Earth model for CMIP6 we decided to use CFC-11eq instead of CFC-11 concentrations to account for the contributions from other trace gases. The changes between CFC-11 concentrations from CMIP5 and the CFC-11eq concentrations from CMIP6 are rather large (see figure 2). The radiative efficiency of CFC-11 is about 20 000 larger than that of CO2 (Meinshausen et al 2017) yet the molecular mixing rate of CFC-11eq is about 500 000 times smaller than that of CO2 (figure 2), so the question is how large is the impact when changing from CFC-11 to CFC-11eq. We performed additional AMIP experiments with CFC-11 concentrations from CMIP6 instead of CFC-11eq and find that the ERF drops by only 0.46 W m−2 with SSP5-8.5, 0.14 W m−2 with SSP2-4.5, and 0.05 W m−2 with SSP1-2.6. Compared to the changes in ERF that result from replacing all CMIP6 GHG concentrations with those from CMIP5 (see table 1), the changes due to CFC-11eq instead of CFC-11 are considerably smaller and can therefore be ruled out as being mainly responsible for the larger warming in the CMIP6 projections.
3.4. Sensitivity to other updates in the forcing datasets
Obviously not only the GHG concentrations but also other forcing datasets have been updated from CMIP5 to CMIP6 and the question is if not some of the other updates could counteract the large impact on the ERF that come from the update of GHG concentrations in CMIP6. We have tested this hypothesis by making an AMIP experiment with the CMIP6 model version of EC-Earth3-Veg but reverting all forcings to their RCP8.5 counterpart where this is still feasible: this includes GHG concentrations, tropospheric and stratospheric aerosols, and solar forcing. Land-use and stratospheric ozone cannot be reverted to the values from CMIP5 but remain those from the SSP5-8.5 forcing for CMIP6. The resulting ERF at the end of the 21st century is 8.0 W m−2 which is slightly higher than the value 7.8 W m−2 for the case when only the GHG concentrations are taken from CMIP5 (table 2), but the difference is small compared to ERF = 9.2 W m−2 when all forcings come from CMIP6. We thus conclude that the changes in GHG concentrations dominate the impact on the ERF and therefore the change in GHG concentrations from CMIP5 to CMIP6 is largely responsible for the change in the warming in future climate projections with the EC-Earth3-Veg model.
4. Conclusions
A striking feature of the new CMIP6 projections are the differences in the warming at the end of the 21st century compared to CMIP5 despite nominally identical radiative forcing. Some of the additional warming in CMIP6 has previously been attributed to the higher climate sensitivity in many CMIP6 models. However, we demonstrate here that in the EC-Earth3-Veg model the change in the forcing datasets from CMIP5 to CMIP6 could also contribute substantially to the larger warming at the end of the century. In particular, we identify the changes in GHG concentrations from the RCPs in CMIP5 to the corresponding SSPs in CMIP6 as a major contributor to the additional warming in the climate projections with the EC-Earth3-Veg model. For the new SSP2-4.5 and SSP5-8.5 scenarios, more than 50% of the extra warming in CMIP6 can be explained by the changes in GHG concentrations. The extra warming is a consequence of the higher effective radiative forcing with SSP5-8.5 that would drop by 1.4 W m−2 if GHG concentrations from RCP8.5 would be used instead, despite the nominally equal instantaneous radiative forcing for SSP5-8.5 and RCP8.5. Similar, yet smaller, reductions of the ERF have been found for SSP2-4.5 and SSP1-2.6. We'd like to emphasize that this result is probably strongly model dependent because ERF depends on adjustments in the climate model in contrast to the instantaneous RF. Despite this caveat, we still think that changes in GHG concentrations could contribute to the warming from CMIP5 to CMIP6 even in other models, and we therefore encourage other groups to make similar RFMIP type experiments as those presented here to test the impact of the changes in GHG concentrations and possibly even other updates in the CMIP6 forcing datasets. Further studies along this line with other climate models will improve the possibility of assessing the robustness of the presented results.
We have tested if the additional forcing caused by the changes in GHG concentrations from CMIP5 to CMIP6 is possibly compensated by other changes in the SSP forcing datasets, in particular a stronger cooling from CMIP6 aerosols. There was only a minor impact on the ERF in our model and we conclude that, at least for the EC-Earth3-Veg model, changes in aerosols or other forcings in CMIP6 do not compensate for the extra warming induced by the changes in GHG concentrations.
The large changes in ERF caused by the changes in GHG concentrations makes it more complex to explain the differences when comparing CMIP5 and CMIP6 results. It becomes more difficult to formulate a simple and stringent message about future climate change towards the impact, mitigation and adaptation communities. Future climate change is an utterly important question and we should be carefully addressing the concerns of stakeholders that wonder about the significantly stronger warming and the credibility of future climate projections when comparing CMIP6 against the older CMIP5 results. Hitherto many climate modeling groups have attributed the stronger warming in CMIP6 to an increased climate sensitivity of the newer climate models, but here we present evidence that the changes in GHG concentrations from RCPs to SSPs could also make a substantial contribution to the warming. Better understanding of the differences between CMIP5 and CMIP6 forcings across more CMIP6 models is necessary so that potential future climate change, associated uncertainties and impacts can be communicated in a credible way also relating to previous assessments based on CMIP5. For future CMIPs we would recommend that climate models and their forcing datasets are not updated simultaneously but instead try to carefully separate the impact from changes in the forcing datasets from those related to model developments.
In conclusion, the new climate projections, coming from EC-Earth and other CMIP6 models, constitute a crucial new piece of information on future climate change and should be used in combination with other pieces of information, including previous modelling studies such as CMIP5 and studies looking at emergent constraints, to develop sound mitigation and adaptation strategies encompassing the full range of possible futures.
Acknowledgments
This work was supported by the European Union's Horizon 2020 research and innovation programme under Grant Agreement No 641816 (CRESCENDO) and No 821205(FORCeS). The EC-Earth simulations were performed on resources provided by the Swedish National Infrastructure for Computing (SNIC) at PDC and NSC.
Data availability
CMIP5 data from EC-Earth and CMIP6 data from EC-Earth3-Veg are available from any ESGF dataportal, e.g. https://esg-dn1.nsc.liu.se/projects/esgf-liu/. The results from the AMIP simulations for computing the ERF are available from https://doi.org/10.5281/zenodo.3600083.