

Abstract
Heat stress harms human health, agriculture, the economy, and the environment more broadly. Exposure to heat stress is increasing with rising global temperatures. While most studies assessing future heat stress have focused on surface air temperature, compound extremes of heat and humidity are key drivers of heat stress. Here, we use atmospheric reanalysis data and a large initial-condition ensemble of global climate model simulations to evaluate future changes in daily compound heat-humidity extremes as a function of increasing global-mean surface air temperature (GSAT). The changing frequency of heat-humidity extremes, measured using wet bulb globe temperature (WBGT), is strongly related to GSAT and, conditional upon GSAT, nearly independent of forcing pathway. The historical ∼1°C of GSAT increase above preindustrial levels has already increased the population annually exposed to at least one day with WBGT exceeding 33°C (the reference safety value for humans at rest per the ISO-7243 standard) from 97 million to 275 million. Maintaining the current population distribution, this exposure is projected to increase to 508 million with 1.5°C of warming, 789 million with 2.0°C of warming, and 1.22 billion with 3.0°C of warming (similar to late-century warming projected based on current mitigation policies).
Export citation and abstract BibTeX RIS

Original content from this work may be used under the terms of the Creative Commons Attribution 4.0 license. Any further distribution of this work must maintain attribution to the author(s) and the title of the work, journal citation and DOI.
1. Introduction
Dry-bulb air temperature alone is inadequate as a metric for human heat stress. Healthy, well-adapted humans are able to maintain a normal core body temperature (under 38°C) through evaporative cooling (i.e. sweating), even when the ambient air temperature exceeds their body temperatures [1]. High humidity reduces the efficiency of evaporative cooling and, when combined with elevated air temperature, can undermine this cooling mechanism and pose a serious threat to human health [2]. Although heat and humidity are just two among a large array of factors (e.g. physical activity, health condition, clothing, water, and salt intake) contributing to heat stress in humans, they are factors over which many individuals have little direct control. While air conditioning is a crucial form of adaptation to extreme heat, it is often inaccessible in lower income areas [3].
Numerous analyses have focused on air temperature as the primary metric for detecting and assessing anthropogenic contribution to historical heatwaves, including the 2003 European heatwave [4], 2010 Russian heatwave [5–7], and 2012/2013 Australian heatwave [8]. A growing number of studies have raised concerns on projected worsening heat stress over the 21st century, taking account of both temperature and humidity, due to anthropogenic global warming [9–19]. While a large array of heat indices have been developed to account for the effects of both temperature and humidity [20, 21], wet bulb globe temperature (WBGT) is one of the most widely used. As a linear combination of dry air temperature (Ta), natural wet bulb temperature (Tnw), and globe temperature (Tg) [22], WBGT takes into account not only temperature and humidity, but also other environmental factors, including solar and infrared radiation and windspeed:  . It has been adopted as the basis for a number of health guidelines related to outdoor working, military training, and outdoor sports [23]. International standard ISO 7243, used worldwide by agencies to assess heat stress on workers in hot environments, lists reference upper limits of WBGT for physical workers to keep a normal core body temperature. For healthy, acclimatized humans at rest, the reference WBGT is 33°C. This reference value decreases significantly for physical activities with higher metabolic rates and for individuals in subprime health conditions: a WBGT of 26°C is considered too hot for unacclimatized individuals undergoing activities as light as walking [1]. Heat-related mortality disproportionately occurs among outdoor workers and the elderly, for whom WBGT does not have to approach 33°C to reach a dangerous level.
While WBGT can be estimated from standard meteorological data with a good degree of accuracy [24], not all needed variables are readily available at desired temporal and spatial resolutions from climate model output, contributing to its absence from heat stress projection studies. Simplified WBGT (WBGT* hereafter), suitable for indoor conditions, substitutes globe temperature with (dry-bulb) air temperature, and natural wet bulb temperature with wet bulb temperature (Tw):  [14, 23]. As a key component of WBGT*, Tw has been calculated in multiple ways in previous studies [21], including employing an empirical relationship between temperature and relative humidity [25, 26], and calculating 'wet bulb potential temperature,' which is relevant to pseudo-adiabatic processes in the atmosphere [11, 14, 27]. The 'isobaric wet bulb temperature'—defined as the temperature an air parcel attains after it gets saturated by water evaporated into it, with the whole air-water system kept under constant pressure and insulated from the environment [28]—is more physically linked to human's cooling efficiency through perspiration; hence, it is used in our calculation of WBGT*.
Monthly means of WBGT* have been used in several existing studies on anthropogenic influence on heat stress [14, 23], but future projections of extreme heat and humidity events based on WBGT* have yet to be developed. In this study, we use daily peak WBGT* to evaluate projected changes in daily compound heat-humidity extremes as a function of global-mean surface air temperature (GSAT). To provide a robust assessment of extreme events, we employ a 40-member ensemble of simulations from the Community Earth System Model Large Ensemble (CESM-LE) project [29], which provides a large volume of samples so that the frequency of extreme events can be more reliably estimated. For some atmospheric variables, the change in GSAT relative to preindustrial levels (ΔGSAT) provides a robust index of changes in mean and extreme climatology at a local scale [30]. For these variables, hazard analysis can be largely decoupled from the time-path of forcing. Here, we show that WBGT* is among these variables, and that assessing WBGT* extremes as a function of GSAT provides a more flexible perspective than examining the changing hazard over time under a specific forcing pathway. This perspective also fits comfortably with policy deliberations focused on ΔGSAT targets, as well as with analyses of temperature change associated with current and proposed policies [31].
2. Data and methods
2.1. Dataset
We calculate WBGT* from ERA5 [32], the latest (5th generation) global atmospheric reanalysis dataset from the European Centre for Medium-Range Weather Forecasts. Three two-dimensional variables from the dataset—near-surface air temperature (t2m), near-surface dewpoint temperature (d2m) and surface pressure (sp) on a high-resolution  grid—are used to calculate WBGT* at an hourly frequency. WBGT* derived from ERA5 is then used for the bias-correction of WBGT* calculated from the output of the Community Earth System Model (CESM). The surface air temperature and humidity in the ERA5 reanalysis are reasonably close to weather-station observations (SI figure S27-31 (stacks.iop.org/ERL/15/064003/mmedia)).
The CESM-LE project provides a 40-member ensemble of simulations for the period 1920–2100, with historical radiative forcing up to 2005, and thereafter with Representative Concentration Pathway (RCP) 8.5, under which carbon dioxide concentrations exceed 900 ppm and radiative forcing reaches  by 2100. Under the same external forcings, ensemble members differ due to slightly different atmospheric initial conditions. The large ensemble greatly expands the temporal basis of the simulations and allows more robust assessment of rare extreme events. Statistics of WBGT* computed from 15-member ensemble CESM simulations following the RCP4.5 scenario (CESM-ME RCP4.5) [33] are compared with that from CESM-LE RCP8.5 and show that the frequencies of extreme WBGT* days are mostly functions of GSAT with little influence from the GSAT history (SI figures S15–17). An 1800-year control simulation forced by preindustrial radiative forcing conditions (CESM-1850) is used for calculating WBGT* extremes in a preindustrial climate.
Gridded world population data (GPWv4) [34] are provided by Socioeconomic Data and Applications Center (SEDAC), Columbia University. Estimated population for the year 2020, adjusted by the population count from United Nations World Population Prospects (UN-WPP), is used to calculate the world population exposure to extreme WBGT*. Population data, of much finer spatial resolution (1/24 by 1/24 degree), is aggregated to the nominal 1-degree latitude-longitude grid of CESM prior to the calculation. To evaluate the effect of future changes in world population distribution on the impacts of extreme WBGT*, we also include results obtained using 2010-2100 population projections based on different Shared Socioeconomic Pathways (SSPs) provided by SEDAC [35].
2.2. Wet bulb globe temperature
Wet bulb globe temperature (WBGT) can be measured by a WBGT device using separate sensors for three variables: one sensor enclosed in a metal globe painted in black for globe temperature (Tg), one embedded in a wetted wick for natural wet bulb temperature (Tnw), and another in a solar shade for dry-bulb air temperature (Ta). The resulting WBGT is a linear combination of these three quantities. As an instrument-measured quantity, raw measurements of WBGT have to be calibrated, as they can depend on the physical shapes and radiative characteristics of the black metal globe and the wet wick, holding all other factors constant. WBGT is not a standard metrological variable and is not available in atmospheric reanalysis datasets or climate models. Methods for estimating WBGT using meteorological observations are available and have been demonstrated to have satisfactory accuracy [22], but standard output from climate models often omits the required variables at daily or sub-daily frequencies. Simplifications are therefore necessary for utilizing WBGT as a viable index for heat stress in climate models.
Simplified WBGT approximates the natural wet bulb temperature Tnw by the isobaric wet bulb temperature [28], and substitutes the global temperature with atmospheric temperature Ta:  . Technical details of the calculations and associated errors of the approximations in this approach are discussed in SI. We denote this simplified form as WBGT*, to distinguish it from the instrumental WBGT, though previous studies have nonetheless used 'WBGT' for simplified forms and received criticism for causing confusion in the literature [36]. Indeed, the globe temperature, measured by sensors enclosed in a black metal sphere, is usually significantly higher than the ambient air temperature. However, as the weight of globe temperature in WBGT is small (0.2), approximating the globe temperature by air temperature often lowers the peak WBGT by only a few degrees (SI figure S2). The infeasibility of estimating instrumental WBGT in current generation climate models makes the above simplification a reasonable compromise when asessing heat stress in the context of climate change. In addition, while instrumental WBGT was designed as a metric for outdoor heat stress, not all heat-related illnesses and deaths occur in outdoor, unshaded conditions. The WBGT* serves as a satisfactory index for assessing heat stress for indoor or shaded outdoor conditions, and might be even more relevant for conditions in which people tend not to brave the Sun but to seek shelter and shade when in excess heat stress.
2.3. Bias-correcting WBGT* of CESM
As always, the level of confidence in future projections based on a climate model depends in part on the skill of the model in reproducing the current observed climate. Here, we use a simple 'Δ-method' to reduce the bias of CESM-derived daily maximum WBGT* (WBGT* hereafter) relative to ERA5 reanalysis data. To estimate the bias, the seasonal cycle (one value on each grid point for each day of the year) of WBGT*
 obtained from 40-year ERA5 dataset (1979-2018) is subtracted from the seasonal cycle calculated with CESM-LE 40-member combined historical (1979-2005) and RCP8.5 (2006–2018) simulations. The resulting bias in the seasonal cycle is then removed from WBGT*
 calculated from the output of CESM simulations. Although only the seasonal cycle of WGBT*
 is bias-corrected, WBGT*
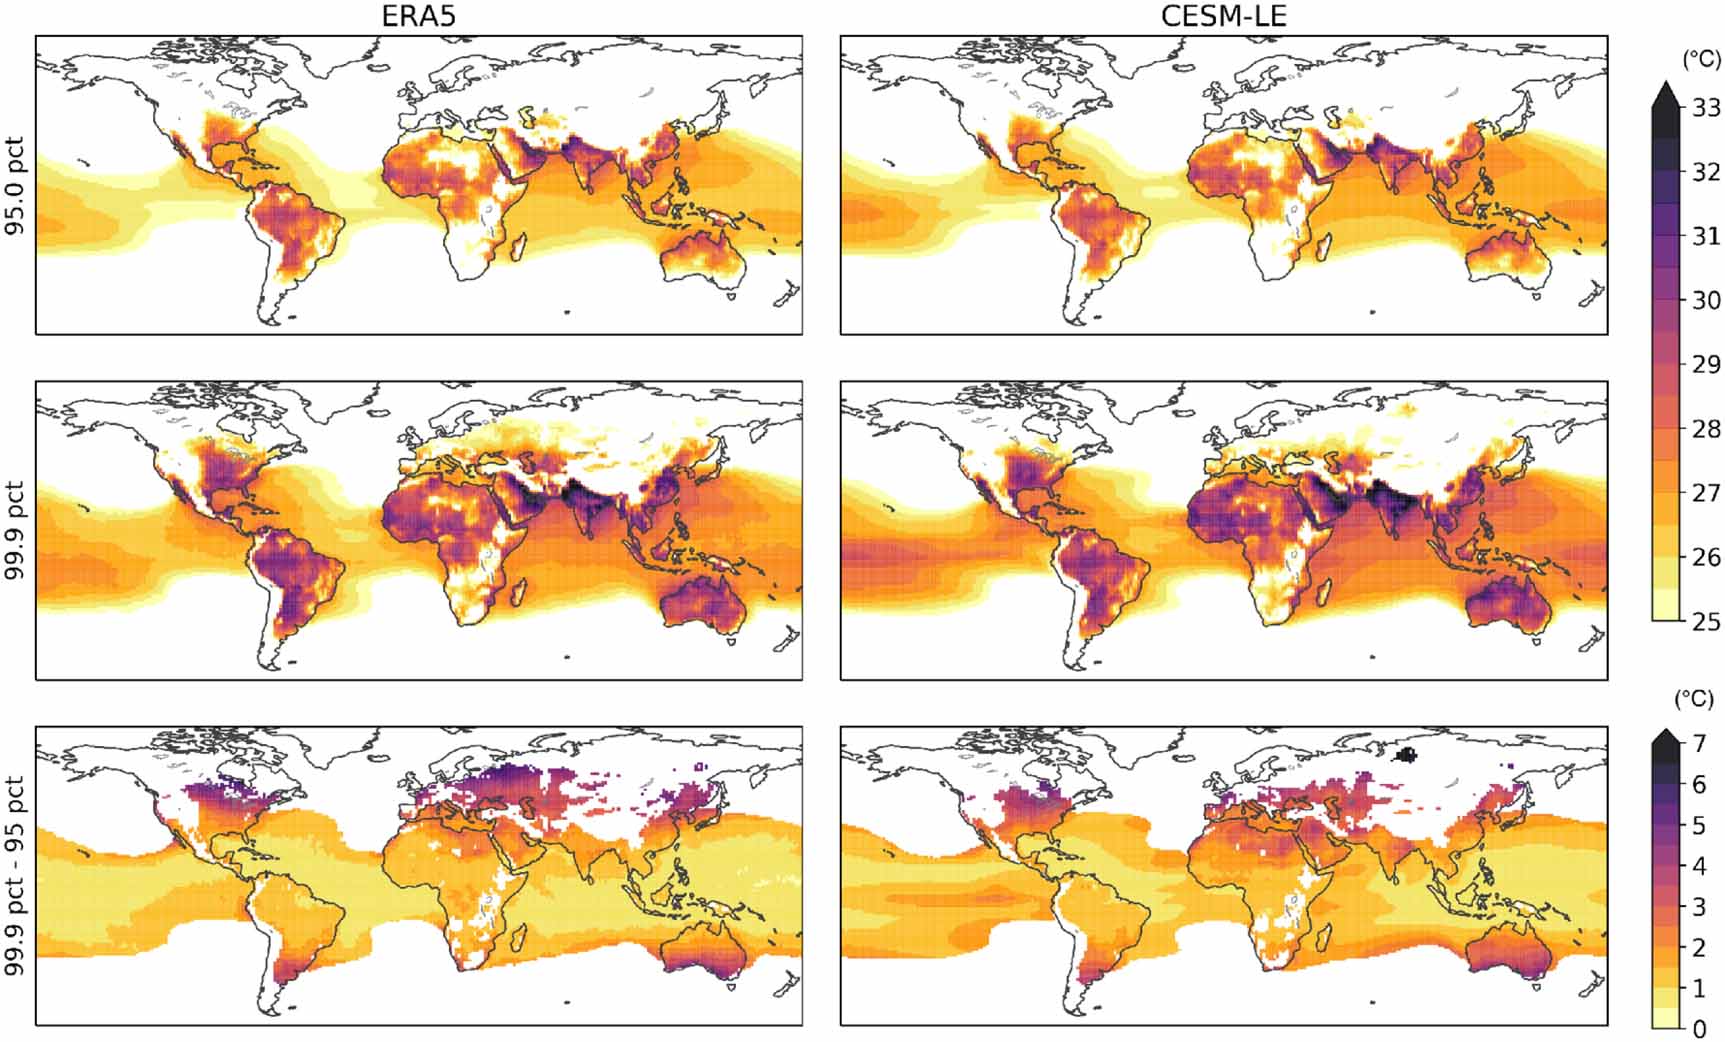
 percentiles from bias-corrected CESM simulations show an overall close resemblance with those from ERA5 (figure 2). The 95th percentile WBGT*
 maps show a high degree of agreement between ERA5 and CESM. The differences between 99.9th percentile maps are more perceptible over northern Eurasia: WBGT*
 in CESM is slightly higher than ERA5 over northern Siberia but lower over western Russian Federation, a region struck by the deadly heatwave of 2010. Bias-corrected WBGT*
 in CESM may still display a frequency distribution different from that in ERA5 due to the model's imperfect representation of natural variability. However, the differences are subtle and should not compromise confidence in the overall skill of bias-corrected WBGT*
 . On the other hand, the 99.9th percentile, corresponding to the 15th hottest day over four decades, may be poorly constrained by ERA5. For the same period (1979–2018), CESM-LE has a sample volume 40 times greater than that of ERA5, so may more robustly reveal the tails of the WBGT*
 frequency distribution.
2.4. Indexing WBGT* by ΔGSAT
To study the changes in the frequency of WBGT* extremes with elevated global mean surface temperature, we index the years in each CESM-LE RCP8.5 simulation by ΔGSAT, and fit them into eight ΔGSAT brackets centered at 1°C , 1.5°C , 2°C, ..., 4.5°C with a width of 0.5°C. Then frequencies of WBGT* extremes in a climate with a specific ΔGSAT are calculated based on years falling into the corresponding bracket. The rate of increase in ΔGSAT in CESM RCP8.5 over the 21st century is approximately 0.05°C/year (SI figure S13), so each ΔGSAT bracket contains roughly 400 model years from the 40 ensemble members of CESM-LE RCP8.5.
In response to anthropogenic global warming, the climate system displays fast and slow components of distinct characteristics [37]. The fast component, on time scales of 3–5 years [38], reflects the quick responses in temperatures of the atmosphere, land, and the upper ocean mixed layer to radiative forcing. The responses due to warming of the deep ocean only emerge to the surface on much longer time scales, usually a few centuries. The underlying justification for indexing WBGT* based on ΔGSAT is that, as long as the concerned timescale is short compared to that of the slow component, the statistics of WBGT* should mainly depend on the instantaneous annual-mean GSAT rather than the pace of warming. Comparison of the results based on the CESM-ME RCP4.5 and CESM-LE RCP8.5 illustrates that the differences are sufficiently small, lending support to our proposition that frequencies of WBGT* extremes over the 21st century can be effectively represented as functions of ΔGSAT independent of forcing pathway.
3. Results and discussions
3.1. Historical heatwaves
Although prolonged exposure to hot environments with WBGT* greater than 33°C can be dangerous for healthy humans, historically, heat-related deaths have occurred when daily peak WBGT* was well below this threshold. This is clearly shown in the inter-comparison of daily peak WBGT* snapshots in the midst of several well-known historical heatwaves that resulted in excess mortality (figure 1), including the Chicago heatwave of July 1995 (> 700 deaths) [39, 40], the European heatwave of 2003 (∼45 000 deaths) [41], the Russian heatwave of July-August 2010 (∼54 000 deaths) [42], the May-June 2015 heatwave over South Asia (> 2 500 deaths) [43], the July 2017 heatwave over eastern China, and the July 2018 heatwave over northeast Asia. Each of these heatwaves affected large areas with WBGT* over 25°C, while only those of South Asia and China had WBGT* approaching or exceeding 33°C. Some urban hotspots are visible on the maps with elevated WBGT* above surrounding areas; nonetheless they may be biased low, as the land surface model used to produce the ERA5 reanalysis has no representation of an urban or city surface. The existence of urban hotspots in ERA5 is a result of nudging temperatures toward observed values during the assimilation process, not due to the characteristics of urban land surface that give rise to the heat island effect.
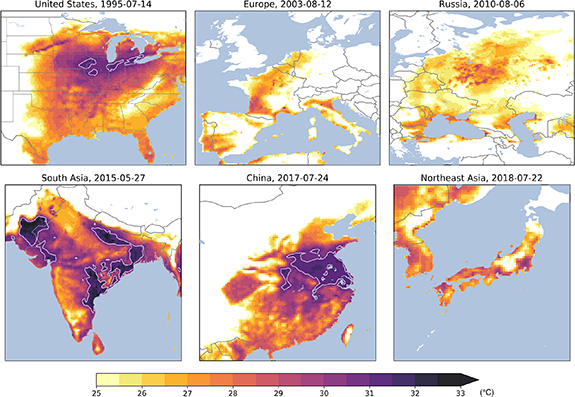
Figure 1. Snapshots of daily maximum WBGT* (WBGT* ) for listed historical heatwaves based on ERA5 dataset. WBGT*
 has been capped at 33°C in the color scale, although it exceeds this value in some areas of South Asia. Areas with WBGT*
 greater than 31°C are enclosed in white contours.
Download figure:
Standard image High-resolution imageHeat-related mortality should be expected to occur for WBGT well below the reference value specified by ISO 7243, considering demographic variations and local unpreparedness. It is also noteworthy that the simplified formula of WBGT* used in our analysis, which approximates globe temperature with air temperature, ignores the effect of solar radiation. WBGT for outdoor conditions with exposure to direct sunlight would be a few degrees higher than indicated by WBGT* (SI figure S2). Heat stress quantified by this simplified WBGT* therefore should be regarded as a conservative estimate, and one should not expect a clear-cut WBGT threshold for heat-related illness or mortality. The two events characterized by relatively lower WBGT*, in western Europe and Russian Federation, nonetheless caused the most deaths, likely because they occurred in regions where summers are usually cool and residents have taken few measures to adapt to extreme heat [3]. In the case of South Asia, where WBGT* routinely exceeds 30°C, local adaptation and awareness may have played a role in relatively fewer heat-related deaths during the more severe heatwave, in terms of WBGT*, than the two European ones. Whereas a global threshold of temperature and relative humidity has been proposed for heat-related mortality [2], lack of local adaptation can be a crucial factor. In addition, the 2003 European and 2010 Russian heatwaves are among the world's strongest since the 1980 s in terms of 'Heat Wave Magnitude Index', a metric accounting for both the relative intensity (compared to the 90th percentile of daily maximum temperature) and the duration of heatwaves [44]. The combination of high relative magnitudes and long durations during these heatwaves would be expected to produce high death tolls to the poorly prepared local population.
3.2. Global WBGT* statistics
Based on ERA5 reanalysis data for 1979–2018, figure 2 displays global maps of WBGT* at the 95th percentile and 99.9th percentile, which approximately corresponds to an expected occurrence frequency of 18 days per year and one day per three years, respectively. Most of the land area in the tropics, except for a few regions of high elevation, experiences at least two weeks of WBGT*
 > 25°C, a level of heat stress already considered unsafe for heavy outdoor work per the ISO 7243 standard. The highest WBGT* values are found over South Asia and around the Persian Gulf. In the extratropical northern hemisphere, the central-eastern United States (US) and eastern China face more frequent WBGT* extremes than other regions around the same latitude. In western Europe and Russian Federation, days with WBGT*
 exceeding 25°C are indeed rare and not typical of usual summers. Mid-to-high latitude land regions display a larger variability in temperature than the tropics, and this is also the case for WBGT*. The length of WBGT* tail, here represented by the difference between its 95th percentile and 99.9th percentile, is evidently longer in higher latitudes, especially over land. A longer WBGT* tail means that, when a heatwave comes, it is usually associated with a WBGT* much higher than that of typical summer days. This may have contributed to the lack of local adaptation and consequent losses in human life during the 1995 Chicago, 2003 European, and 2010 Russian heatwaves.

Figure 2. Global maps of daily maximum WBGT* (WBGT* ) at the 95th (top row) and 99.9th percentile (middle row), and the length of WBGT*
 tail represented by their difference (bottom row). The left column shows statistics calculated from ERA5 hourly data from 1979-01-01 to 2018-12-31. The right column shows the same statistics calculated from the daily output of 40-member CESM-LE simulations of the same period (historical scenario up to 2005-12-31 and RCP8.5 afterwards), bias-corrected against that calculated from ERA5. Areas with the 99.9th percentile of WBGT*
 lower than 25°C are masked white in the bottom panels to emphasize regions with significant heat stress.
Download figure:
Standard image High-resolution image3.3. Change in extreme WBGT* frequency with warming
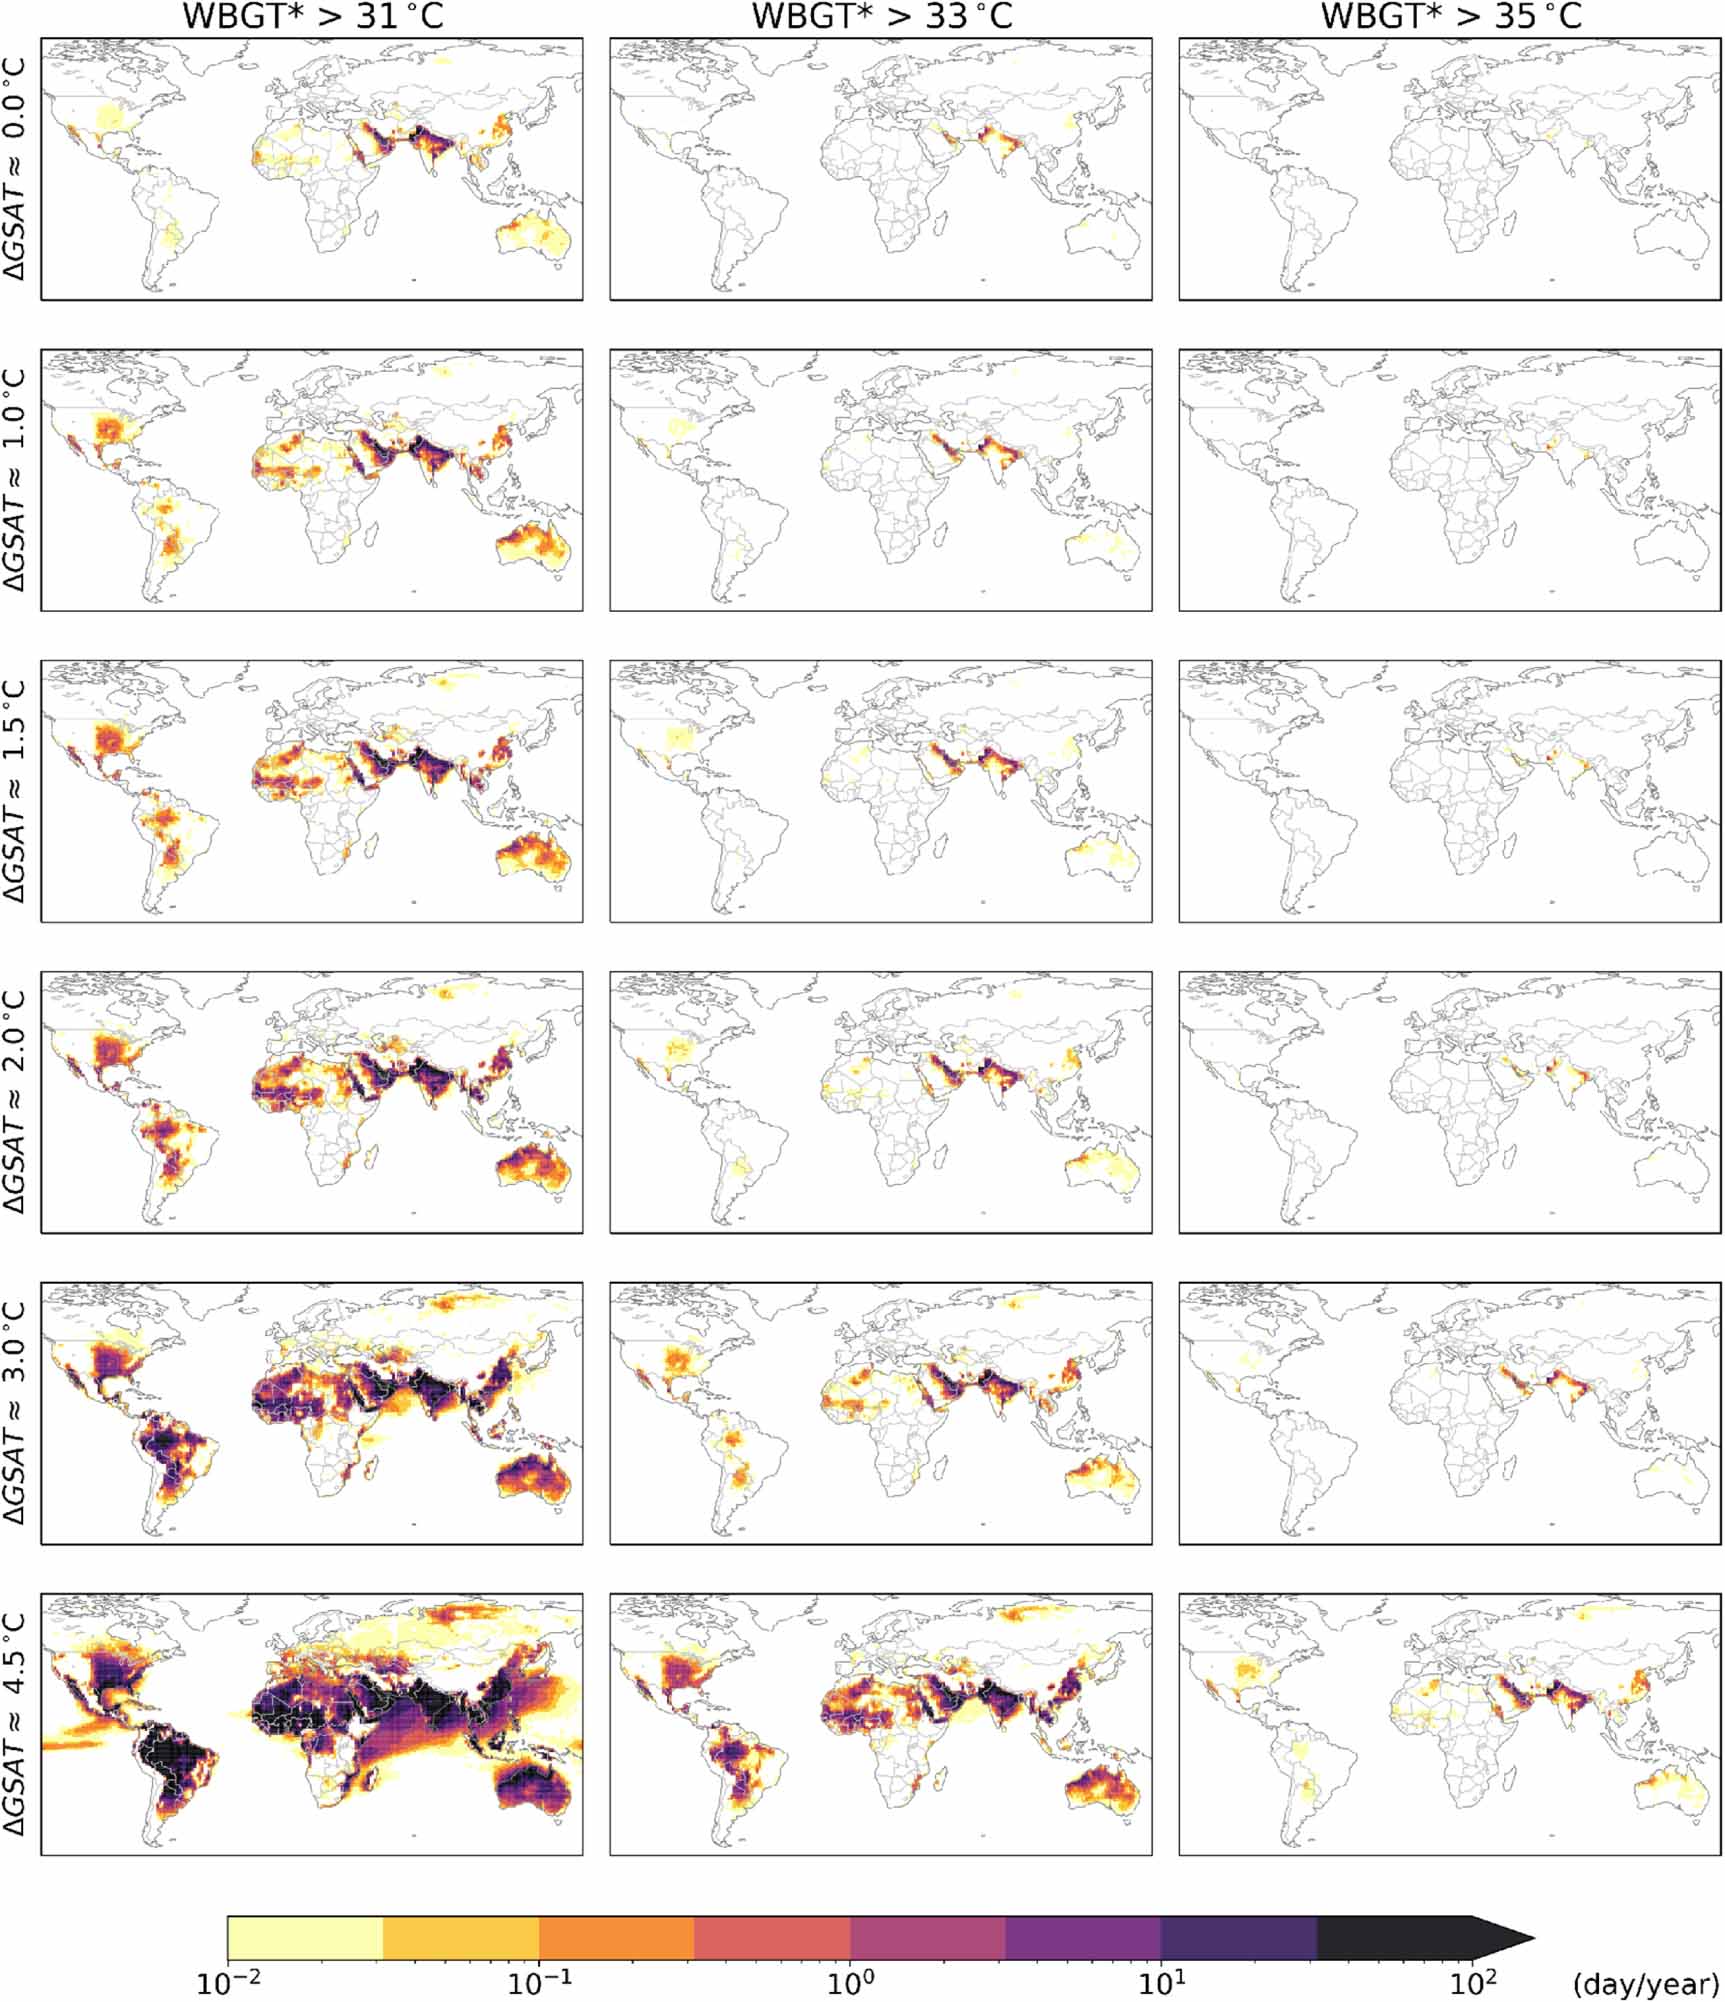
We assess the changes in frequencies of WBGT* exceeding three thresholds, 31°C, 33°C, and 35°C, as a function of ΔGSAT (figure 3). 31°C was approximately the peak WBGT* during the July 1995 Chicago heatwave (Chicago95 hereafter); 33°C is the reference WBGT for humans to maintain a normal core body temperature at resting; 35°C approaches the highest WBGT* calculated from ERA5 data. As WBGT* is typically a few degrees lower than WBGT under direct sunlight, heat stress for outdoor activities could be even more severe than indicated by WBGT*. As a companion to figure 3, figure 4 shows the changing frequencies of exceedance for a number of WBGT*
 thresholds with ΔGSAT for 15 sites, all among the world's most populous metropolitan areas, selected to represent a variety of geographical and climatological conditions (see the location of sites in SI figure S14). For each site, frequencies of exceedance with respect to WBGT*
 thresholds increase with ΔGSAT, forming a group of curves with a comet-shaped envelope. Some tropical sites, e.g. Lagos, characterized by short tails, see frequent moderate heat stress but few days of extremely high WBGT*
 . Midlatitude, continental sites like Chicago have longer tails, meaning they are subject to fewer days with moderate heat stress but may be visited more frequently by extremely severe ones. Consistent with WBGT*
 statistics based on observational data from ERA5 (figure 2), Persian Gulf and South Asian sites, including Dubai, Delhi, and Karachi, are most exposed to extreme levels of WBGT*.

Figure 3. Global maps of frequencies of exceedance indexed by ΔGSAT for bias-corrected WBGT* at 31°C (left column), 33°C (middle), and 35°C (right). Top row is based on an 1800-year CESM simulation under the preindustrial scenario, while the rest are based on the 40-member CESM-LE RCP8.5 simulations. Indexing by ΔGSAT is done by picking years from each simulation with ΔGSAT falling into the ±0.25°C bracket centering at the specific ΔGSAT. The maps are limited to 60°S-80°N, 130°W-160°E since frequencies are all below one day per century over major land areas outside this region.
Download figure:
Standard image High-resolution image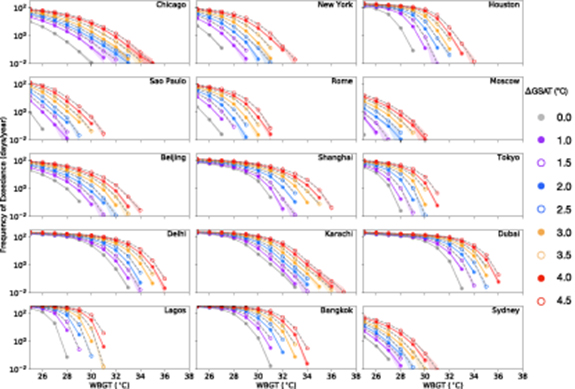
Figure 4. Frequencies of exceedance for WBGT* at thresholds ranging from 25°C to 38°C for 15 selected metropolitan areas. WBGT*
 is calculated and bias-corrected from the output of 40-member CESM-LE RCP8.5 simulations and an 1800-year CESM preindustrial control simulation. Results are grouped by ΔGSAT so that each curve is based on years when ΔGSAT falls into the ±0.25°C bracket centering at the specified value. Shadings mark the Wald intervals [45] at a 95% confidence level as a measure of uncertainty. Selection of cities aims to cover some of world's most populous regions in a variety of climates, but is not meant to be exhaustive. Each site is represented by the CESM grid cell enclosing it. A map showing the coordinates of the selected sites is available in SI.
Download figure:
Standard image High-resolution imageIn the current climate, where ΔGSAT ∼1°C, the frequency of WBGT* extremes comparable to Chicago95 (31°C) has significantly increased compared to the preindustrial climate. In the US Midwest, the frequency of extreme heat days as severe as those during Chicago95 in the preindustrial climate was likely below one day per century (figure 4 and S17), compared to one day per 35 years today. With ΔGSAT rising to 2°C, extreme WBGT* equivalent to Chicago95 are expected at one day per 5 years, about 7 times more frequent than the current climate for Chicago. Based on current policies, ΔGSAT by 2100 is likely to exceed 3°C [31], when Chicago95 would become biennial events. If emissions were to follow the RCP8.5 scenario [46], by the end of this century, when ΔGSAT approaches 4.5°C, Chicagoans would have to deal with on average 4 days of heat as severe as Chicago95 every year.
In western Europe, under the current climate, the region subject to WBGT* > 29°C more frequently than 1 day per decade is limited to southwestern France, but that would expand to much of southern Europe as ΔGSAT rises to 2°C, and to almost the whole continental Europe excluding Scandinavia if ΔGSAT approaches 4.5°C (SI figure S19). For Rome, the frequency of extreme WBGT* days equivalent to those during the 2003 heatwave (with WBGT*
 > 27°C) would increase ten-fold from its current climate to 3.5 days per year when ΔGSAT reaches 2°C. This frequency is expected to approach 16 days per year with ΔGSAT ∼3°C, and to 49 days per year if ΔGSAT rises to 4.5°C.
The 33°C reference WBGT limit is already exceeded at frequencies above 1 day/decade in areas around Persian Gulf and in South Asia in the current climate (figure 3). The impacted region is projected to expand with rising ΔGSAT, encompassing areas including central US and eastern China with ΔGSAT ∼3°C. A WBGT* as high as 35°C, likely the all-record high value worldwide and lethal for long-term exposure, is limited to only a few CESM grid cells of South Asia at frequencies higher than 1 day/decade in the current climate (figure 3 and SI figure S21). That would expand to much larger areas including the south of Persian Gulf, the Indus Valley, and the Ganges Valley if ΔGSAT reaches 3°C. With ΔGSAT around 4.5°C, decadally reoccurring WBGT* greater than 35°C would gain a foothold in additional populous regions including central US and much of eastern China. Multiple extreme heat days may be packed into one heatwave, so the frequency of heatwaves with WBGT*
 exceeding a specific threshold is expected to be lower than indicated by the exceedance frequency of WBGT*
 . However, given a life expectancy of several decades, an average person living in aforementioned areas is still likely to be vulnerable to lethal heat stress during their lifetime. In the RCP8.5 scenario, GSAT rises at a rate of ∼0.5°C/decade, meaning children, if born three decades later than their parents, would be placed in a world ∼1.5°C warmer—a change substantial enough to drastically increase the risk of experiencing life-threatening heatwaves.
3.4. Population exposure to extreme WBGT*
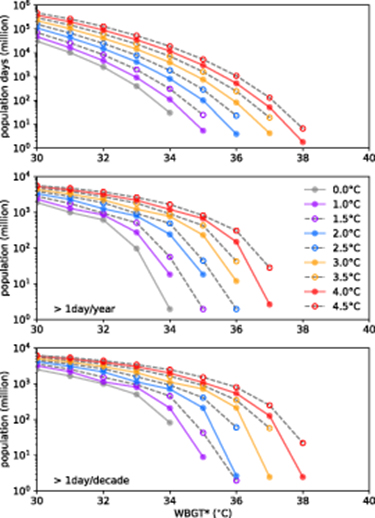
Dangerous levels of WBGT* pose a significant threat to some of the world's most densely populated areas even in the current climate. With elevated ΔGSAT, areas subject to dangerous WBGT* expand and affect a larger population. Currently, 1.28 billion people experience Chicago95 level WBGT* annually or more frequently, compared to 0.99 billion under a preindustrial climate (figure 5 and SI table 1). The affected area would expand to encompass areas currently home to 2.28 billion people with ΔGSAT ∼2°C; affected population would increase to 3.25 billion with ΔGSAT ∼3°C, and to 4.71 billion—61% of current world population—with ΔGSAT ∼4.5°C.
Figure 5. World population exposure to WBGT* exceeding a range of thresholds. From top to bottom, panels show the integrated product of population and frequency of exceedance of WBGT*
 , population experiencing WBGT*
 exceeding specified thresholds at a frequency of greater than 1 day per year and that at a frequency greater than 1 day per decade. As in figure 4, each curve shows result indexed by ΔGSAT.
Download figure:
Standard image High-resolution image
The population exposed to more perilous WBGT* would increase even more dramatically. Currently 275 million people worldwide are exposed to WBGT exceeding 33°C annually, compared to 97 million under a preindustrial climate, 789 million with ΔGSAT ∼2°C, 1.22 billion with ΔGSAT ∼3°C, and 2.62 billion with ΔGSAT ∼4.5°C. In the current climate, 9 million people worldwide are vulnerable to WBGT* exceeding 35°C decadally, compared to none in the preindustrial climate, 210 million with ΔGSAT ∼2°C, 711 million with ΔGSAT ∼3°C, and 1.51 billion with ΔGSAT ∼4.5°C.
The above results are based on a fixed population distribution. If future population growth is accounted for, the population exposed to life-threatening WBGT* also increases. Using gridded global population projection data based on Shared Socioeconomic Pathways (SSPs) [47] in years when CESM-LE RCP8.5 ensemble mean ΔGSAT reaches 2°C (2042), 3°C (2061), and 4.5°C (2090), the areas subject to 35°C WBGT* at least one day per decade are home to 263 million (2.8% of world total), 1.16 billion (11% of world total), and 2.46 billion (20% of world total) respectively under scenario SSP3 ('regional rivalry') (SI figure S25); under SSP5 ('fossil-fueled development'), affected areas are home to 216 million (2.6% of world total), 790 million (9.2% of world total), and 1.29 billion (16% of world total), respectively (SI figure S26). It is worth noting that in these scenarios, although the population distribution changes with time, the responses of human society to a deteriorating environment caused by increased heat stress are not modeled. For a more logically consistent design of socioeconomic pathways, the effects of heat stress on mortality rate and emigration should be integrated in population projections.
The benefits of limiting ΔGSAT to 1.5°C rather than 2°C are evident for the reduction of world areas exposed to life-threatening level of WBGT*: with ΔGSAT constrained to 1.5°C, areas subject to 33°C WBGT* annually are home to 508 million rather than 789 million at 2°C, and those exposed to at least one day per decade of 35°C WBGT* are home to 42 million instead of 210 million. Quantifying worldwide human heat stress as the integrated product of population and frequency of exceedance of WBGT* , a world of 1.5°C warming sees less than half the heat stress for a WBGT* threshold of 33°C than a world of 2°C warming, at 1.96 billion people days/year instead of 4.15 billion people days/year. For more extreme heat days with WBGT*
 > 35°C, a 1.5°C warming results in about a quarter of the heat stress of a 2°C world, at 24 million people days/year rather than 100 million people days/year.
The significant increase in heat stress from a 1.5°C to a 2°C warming, and from 2°C to higher levels of warming, has clear implications for global policy discourse around temperature targets [48]. In this context, it should be recognized that our analysis—which is based on transient climates following RCP8.5 and RCP4.5 trajectories over the 21st century—likely understates the long-term benefits of temperature stabilization. Compared to a stabilized global climate, the transient response of surface temperature to radiative forcing shows a spatial pattern with elevated warming over land and the Northern Hemisphere, whereas in a stabilized climate a 'recalcitrant' pattern emerges with more hemispheric symmetry and a more even land/ocean warming pattern [37, 49, 50]. It can thus be expected that, compared to a climate that has stabilized for many centuries, a transient warming state with the same GSAT imposes higher heat stress on the global population, which virtually all dwells on land.
Acknowledgments
This work was supported by a grant from the Rhodium Group to Rutgers University, as part of the Climate Impact Lab collaboration. REK has previously served as a consultant to the Rhodium Group. The authors acknowledge the Office of Advanced Research Computing (OARC) at Rutgers University for providing access to the Amarel cluster and associated research computing resources that have contributed to the results reported here (http://oarc.rutgers.edu)). DL thanks Thomas R Knutson for suggestions on WBGT. The authors thank two anonymous referees for helping improve the paper.
Data availability
The data that support the findings of this study are openly available. ERA5 hourly data on single levels from 1979 to present are available at doi:10.24381/cds.adbb2d47. The CESM Large Ensemble data are available from NCAR's Climate Data Gateway doi:10.5065/d6j101d1; a subset of the data is available on Amazon Web Services (AWS) S3 at doi:10.26024/wt24-5j82. Python scripts used in this work are posted on GitHub (https://github.com/dw-li/WBGT) and are also available from the corresponding authors upon request.