

Abstract
Large scale and rapid urbanization processes call for a better quality of urban planning to support human well-being. While compact cities aim to reduce land consumption, densification puts pressure on the remaining green areas, influencing ecosystem services provision and ultimately the life quality of the growing urban population. Supply of and demand for urban ecosystem services differ however greatly across the globe. In this study, we derive a set of urban typologies and their related ecosystem services bundles in both a temperate and a tropical city. We show that the supply of urban ecosystem services does not increase linearly with green area coverage, but is highly dependent on the urban form. While the surface sealed by infrastructures and the buildings themselves play a key role in influencing ecosystem services provision, we observe that the share of trees is particularly important for supporting regulating ecosystem services in built up neighborhoods. With a similar average surface-to-volume ratio, open midrise neighborhoods in Singapore provide more water flow regulation and air pollution control services than the same urban typology in Zurich. Microclimate regulation, in contrast, does not seem to be dependent on the context, but more on the amount of built up surface. Interestingly, we observe that open midrise neighborhoods synergistically support the supply of many regulating services in both case study areas, including microclimate regulation, water flow regulation and air pollution control. Large water and forest patches are unquestionably essential in both Singapore and Zurich to support bundles of ecosystem services, particularly also for recreational activities. Using open data, the approach can be transferred to other cities and support decision makers in their efforts to plan the sustainable development of cities across the world.
Export citation and abstract BibTeX RIS

Original content from this work may be used under the terms of the Creative Commons Attribution 4.0 license. Any further distribution of this work must maintain attribution to the author(s) and the title of the work, journal citation and DOI.
1. Introduction
By 2050, sixty-eight percent of the world population is projected to live in cities (United Nations 2018). Developing livable cities becomes thus central to human life on our planet and has been enshrined in the 2030 United Nations Sustainable Development Agenda (United Nations 2015). A dominating trend in this effort is to densify already built up areas, thus reducing urban sprawl, protecting agricultural and amenity land, and helping reduce energy consumption. City densification, however, also puts high pressure on urban green spaces directly affecting people's quality of life (Pauleit et al 2005, Wolsink 2016). The shortage of space within the cities and the growing urbanization of the hinterlands (Van Vliet 2019) are et al affecting the supply of ecosystem services needed to sustain urban dwellers (Grimm et al 2008, Seto et al 2013, Elmqvist et al 2013). Cities in the tropics particularly experience high densification (figure 1—population density) and a strong expansion of lower-density settlements in rural areas as well as a transformation of the scattered peri-urban areas towards more compact urban structures (figure 1—built area) with impacts on water provisioning, air quality regulation, recreation and crops and livestock supply inside and outside the city boundaries (Haberman and Bennett 2019). The supply and demand of urban ecosystem services in cities and their hinterlands vary considerably, however, across the globe; while the cooling effect of vegetation is a priority in tropical cities (e.g. Tran et al 2006), temperate cities invest in high quality recreational areas (e.g. Larondelle and Haase 2013). Furthermore, while urban agriculture is mostly used as a cultural service in the developed world (Bell et al 2016, Langemeyer and Latkowska 2016), urban food production is not only essential for many citizens in developing countries but contributes also to urban employment and to the reduction of inequalities (Poulsen et al 2015). Planning for sustainable settlement development thus et al requires understanding how the rapidly developing urban forms influence ecosystem services' provision and how multifunctional areas can be secured to cover the needs of the growing urban population.

Figure 1. Temporal changes in built area and densification in temperate and tropical regions between 2000 and 2015. (Data: Global Human Settlement dataset with the three data layers 'urban center' = 'urban', 'urban cluster' = 'peri-urban', and 'rural' = 'rural' (Pesaresi et al 2017).)
Download figure:
Standard image High-resolution imageInvestigating urban forms and their relations to ecosystem services across the globe requires using comparable data and methods (Kremer et al 2016). Earth Observation products provide an increasing amount of detailed, freely available data for quantitative analysis of the city's urban spatial structure and their relationships to various socio-economic processes (e.g. Bettencourt and West 2000, Schläpfer et al 2016, Krehl et al 2016) and ecosystem services (see review by Ayanu et al 2012, Andrew et al 2014), such as products from the Sentinel satellite mission, the Landsat archive or the 'Atlas of the Human Planet' (Pesaresi et al 2017). They not only allow area-wide spatial assessments, but also temporal investigations and analyses of various land cover types and their relation to ecosystem services provision.
We present here the first study investigating the relationships between urban forms and ecosystem services in both a temperate and tropical city. Using Zurich (Switzerland) and Singapore as case studies, we identify a set of urban typologies and their ecosystem services bundles and compare their tradeoffs and synergies. Both cities are justifiably proud of their green space with Singapore describing itself as a 'City in a Garden', and Zurich having developed around a lake and being endowed with numerous parks. In the 2018 Mercer Quality of living survey, Zurich is ranked 2nd and Singapore 25th. We demonstrate that fostering ecosystem services in cities is not only a question of decreasing the surface-to-volume ratio, but is also highly dependent on the type of vegetation and the amount of sealed surface in the surrounding of the buildings. Using open source data, our approach is transferable even to less developed regions facing the most dramatic urban transitions (United Nations 2018).
2. Data and methods
2.1. Urban typology
High-resolution WorldView2 satellite images (2 m pixel size) and Quickbird images were used to map the land cover, vegetation types, as well as building and vegetation heights. A digital surface model (DSM) derived from photogrammetric reconstruction of Digital Globe stereo satellite images (https://www.aw3d.jp/) was used to derive a digital terrain model (DTM), buildings and vegetation heights (for details in Singapore, see Dissegna et al (2019); for details in Zurich, see Ginzler and Hobi (2015). Building and vegetation heights were obtained by cross-referencing the DSM and the DTM with building location data and the vegetation layers of the land cover map. In summary, nine indicators were used to describe the land cover of both cities, including tree area, shrub area, grass area, bare soil/sand area, area covered by buildings ('build'), built surface (excluding buildings, called 'built area'), water area, building heights and vegetation heights.
The urban typology was identified using the partitioning-based k-medoids cluster analysis in an iterative, explorative procedure (Velmurugan and Santhanam 2010) based on the multivariate similarity of the nine land cover indicators available at 10 m resolution. The selection of indicators was based, on one hand, on Kremer et al (2016) recommending the use of high resolution data on human activities and urban morphology, including the 3-D representation of green and blue elements when working with land cover indicators. On the other hand, we were constrained by the availability of similar datasets in both cities and thus used mainly available Earth Observation products. The optimal number of clusters was obtained in an iterative process, in which we augmented the number of clusters used in the k-medoids analysis until we obtained one cluster that was clearly too small (too few cells) compared to the other clusters. In that case, we considered the previous number of clusters (without the small one) as the optimal. Based on this cluster number, we conducted a sensitivity analysis with varying cluster dimensionalities from 100 m × 100 m to 500 m × 500 m and 1000 m × 1000 m. The same process was done independently for both case studies. Finally, the obtained clusters were checked for consistency based on their geographical distribution, homogeneity and their separation. The results were validated in a workshop in Singapore with experts.
2.2. Ecosystem services
We assessed and mapped the supply of five ecosystem services for the year 2017, including four regulating services (water flow regulation, microclimate regulation, carbon storage and air pollution control) as well as one cultural service (nature recreation). We chose these services based on a weighting exercise conducted in the frame of an expert workshop in Singapore involving state officials as well as scientific experts. While all the ecosystem services selected are listed as relevant in the TEEB Manual for Cities (Berghöfer et al 2011), some ecosystem services, such as urban food production, were not prioritized and therefore not considered further. The main criteria for the selection of the set of ecosystem services were their applicability in both the tropical and the temperate city of Singapore, resp. Zürich, their potential for transfer to other cities using comparable spatially explicit datasets, as well as their relevance for planning. An overview of the ecosystem services models is provided in table 1 and details are provided in appendix
Table 1. Overview of ecosystem services models used in Singapore and Zurich.
| Ecosystem Service | Indicators | Unit | Dataa | Main References |
|---|---|---|---|---|
| Air pollution control | Potential to capture airborne particulate matter based on LAI per vegetation types weighted by the distance to highways | Leaf Area Index (LAI) |
|
Asner et al (2003) and Durant et al (2010) |
| Water flow regulation | Runoff potential based on the Curve Number method. | Runoff potential Index (L) |
|
USDA, S. (1986) |
| Microclimate regulation | Thermal emission index based on satellite-based thermal band units | Thermal emission index (%) |
|
Schwarz et al (2011) |
| Carbon sequestration | Carbon stored in above ground vegetation and roots | Weight (kg) |
|
Jackson et al (1996), Proulx et al (2015), and Martin and Thomas (2011) |
| Recreation | Recreation sufficiency rate based on the supply of (urban green areas) and the demand for recreational space that is directly related to the amount of population living in the surrounding of each urban green area. | Sufficiency rate (%) |
|
Grün Stadt Zürich (2005) |
aAll the ecosystem services models use the land cover and 3D building and vegetation heights data extracted from WorldView2 satellite images and Quickbird images as well as Digital Globe stereo satellite (see methods).
2.3. Case study area
Singapore is located in a tropical climate with high average temperature (26 °C–27.7 °C) and annual rainfall (2300 mm) (Köppen classification: Af (Essenwanger 2001), while Zurich is characterized by an oceanic climate with four distinct seasons, an average temperature of 9.3 °C and a mean annual rainfall of 1133 mm (Köppen classification: Cfb) (figure 2).
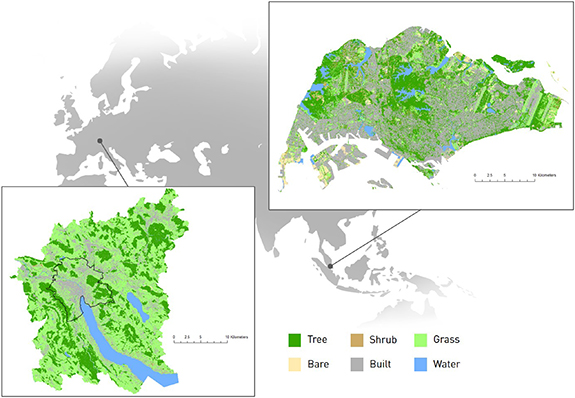
Figure 2. Overview land cover Singapore and Zurich with the municipality of Zurich at the end of the lake. World map: (https://lcviewer.vito.be/).
Download figure:
Standard image High-resolution imageThe island of Singapore covers 719.9 km2 with a percentage of impermeable land of 40%, 11% lower than Zurich, and has a population density of 7796 people per km2 (Department of Statistics Singapore 2018). As an island state, Singapore, unlike other cities, must explore various densification strategies, but maintaining green areas has always taken high priority. The strong urbanization Singapore has undergone in the past 50 years is associated with the building of high-rise housing estates around the island, high-rise offices in the CBD in the south and industrial factories in the west. Singapore describes itself as a 'City in a Garden', with the city covered in greenery including parks, park connectors, roadside greenery and nature reserves.
With an area of around 800 km2, the Zurich agglomeration hosts a population density of 4514 people per km2 (Statistical Office Canton Zurich 2018, Department of Statistics Singapore 2018). It is built at the end of the lake of Zürich and contains densely built-up residential and industrial areas, but also a large number of public and private green spaces.
3. Results
While the expansion of buildings and infrastructure is rapidly reducing green areas in the hinterlands worldwide, the demand for ecosystem services provided by the remaining open areas in cities is increasing with the growing urban population (figure 1). Form and structures of the built environment play however an important role in improving the provision of ecosystem services while densifying cities. In the following, we first present the urban typologies used for understanding and comparing the role of urban form in fostering ecosystem services between Singapore and Zurich. We then follow by identifying bundles of ecosystem services in the various urban typologies and close with showing spatial synergies and trade-offs in ecosystem services.
We clustered our land cover data layer in seven well-separated and homogenous clusters in Singapore and four in Zurich on a 1 km grid. Figures 3 and 4 provide the share of the indicators in each urban type and satellite images of typical examples in both cities. The urban types include (1) bare soil or sand, (2) water, (3) bush/shrub, (4) dense trees, (5) sparsely built, (6) open midrise and (7) compact high-rise. In a workshop with experts, the results were confirmed to provide a good representations of the various urban typologies observed in the city. Although not all urban types are present in both cities (bare soil and compact high-rise areas were only identified in Singapore), we show that the clustering pattern and the bundles of ecosystem services in each urban typology are robust to variations in cell size resolutions (appendix
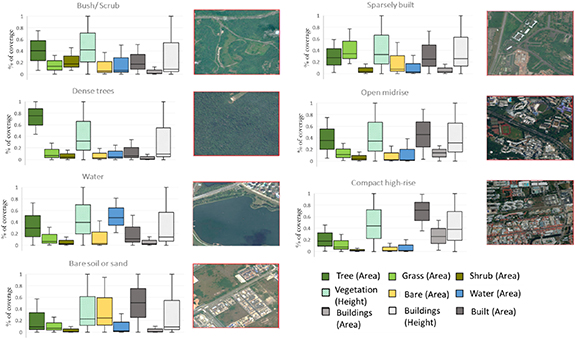
Figure 3. Singapore—detailed characteristics of urban typologies (left) and satellite images of examples (right).
Download figure:
Standard image High-resolution image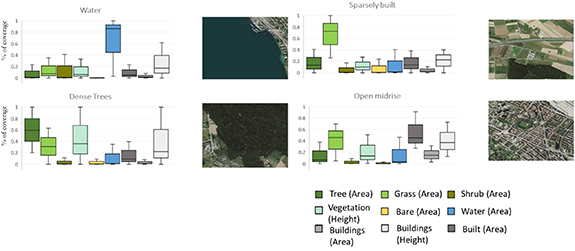
Figure 4. Zurich—detailed characteristics of urban typologies (left) and satellite images of examples (right).
Download figure:
Standard image High-resolution imageGreen and blue areas in tropical cities are particularly important for providing regulating services such as air pollution control, water flow regulation, and microclimate regulation to the urban dwellers (figure 5). In all urban typologies, Singapore provides more ecosystem services (normalized ecosystem services values) than the temperate city of Zurich per km2. The provision of ecosystem services is however highly dependent on the urban form. While microclimate regulation decreases with increasing urban compactness in both case studies, water flow regulation and carbon sequestration increase from the sparsely built to the open midrise typology, but seem to reach a maximum threshold in the open midrise type compared to the even more compact neighborhood of high-rise buildings in Singapore. In contrast, air pollution control continuously increases with compactness in Singapore. This is probably due to the fact, that the compact high-rise buildings in Singapore are mostly located in the vicinity of highways, where pollution levels are higher, thus pointing to the different environmental conditions in such neighborhoods. In Zurich, water flow regulation and air pollution control slightly decrease with compactness. While the average surface-to-volume ratio of open midrise neighborhoods is similar between Zurich and Singapore, Singapore has a higher share of trees in open midrise neighborhoods compared to the same typology in Zurich. The open midrise typology also provides more recreation compared to the sparsely built neighborhoods in both cities. This highlights the importance of the many green areas accessible to all urban dwellers, including extensive forest and water bodies such as small streams or ponds. These compact green areas not only provide essential recreational opportunities, but are also hotspots of regulating ecosystem services (figure 6).

Figure 5. Average normalized ecosystem services values for each urban typology on a gradient from urban to natural. The error bars represent the standard deviation.
Download figure:
Standard image High-resolution image
Figure 6. Hot- and coldspot maps of ecosystem services in Singapore and Zurich and the share of hotspots per urban typology in Singapore and Zurich (for details, see appendix
Download figure:
Standard image High-resolution imageIn Singapore, ecosystem services bundles are geographically more concentrated than in Zurich with an important 'hotspot' known as the central catchment area that includes Bukit Timah Nature Reserve and Central Catchment Nature Reserve (figure 6, and appendix
In general, there is a stronger positive spatial correlation between the ecosystem services in the temperate city than in the tropical city (figure 7). In particular, open midrise neighborhoods provide important areas for the synergetic supply of regulating services, including microclimate, water flow regulation and air pollution control. In Zurich, forests provide also important bundles of regulating ecosystem services, whereas in Singapore, forests especially support microclimate regulation together with recreation. Water areas are important for microclimate regulation in both case studies and are positively related to recreation, particularly in Singapore. The hexbin plots especially point to the importance of certain patches for supporting bundles of ecosystem services. Singapore, for example, provides some important forest patches for the provision of regulating ecosystem services. In contrast, forests also show high ecosystem services trade-offs between water flow regulation, microclimate regulation and recreation. This can be related to the fact that some green areas providing essential ecosystem services, such as the Western Catchment area in Singapore, have restricted use and are thus not accessible for the residents. Finally, carbon sequestration is mostly correlated with air pollution control, but rather distributed over space in both case studies.
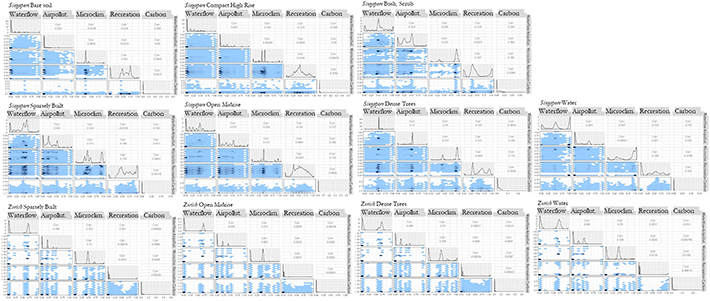
Figure 7. Hexbin scatter plots and correlation coefficients for pairs of ecosystem services per urban typology in Singapore (p < .001).
Download figure:
Standard image High-resolution image4. Discussion
Combining ecosystem services with urban forms provides insights into the provision of ecosystem services under different spatial configurations and highlights more or less favorable urban typologies supporting specific ecosystem services bundles. By covering a range of ecosystem services in a temperate and a tropical city, we show that densification puts ecosystem services under pressure. In general, the tropical city provides more ecosystem services per square kilometer than the temperate city, but the potential provision of ecosystem services in cities is not simply linearly dependent on the amount of green. While decreasing the sealed surface has a positive effect on all ecosystem services, we observe that the type of vegetation around the buildings and the locations of the neighborhoods play an important role in ecosystem services provision. While the open midrise typology in Zurich and Singapore have a similar surface-to-volume ratio, the increased share of trees in Singapore improve water flow regulation and air pollution control. Microclimate regulation, in contrast, does not seem to be highly dependent on the case study region, but more on the amount of built up surface. Interestingly, there is a stronger spatial correlation between ecosystem services in Zurich than in Singapore. While dense forest patches in particular help regulate the climate and water flow in temperate cities and provide important recreational opportunities, sparsely and midrise built neighborhoods also provide important regulating ecosystem services in tropical cities.
Keeping the ecosystem service assessment approach simple increases the transferability to other case studies, but it is clear that the ecosystem services models selected in this study have strong limitations (Eigenbrod et al 2010). Firstly, we were missing similar data in both Singapore and Zurich to be used in more fine-scaled, sophisticated models, and could thus only run more specific models in one or the other case study area. Secondly, studies covering urban ecosystem services have mostly been conducted in cities or metropolitan areas of the global North (e.g. (Haase et al 2014, Derkzen et al 2015, Baró et al 2016, Kremer et al 2016) or taking a global approach (Seto et al 2012, Haberman and Bennett 2019). But cities in the tropics differ strongly not only in terms of their climate, but also their ecology, demography, economic development and lifestyle (Song et al 2017). Detailed ecosystem services models were thus mostly available for temperate cities but not specifically for tropical cities, except for microclimate regulation models (see Dissegna et al 2019). Promising ways to map ecosystem services at a higher resolution using widely available data would be to use plant functional traits, which are quantifiable using remote sensing (e.g. Ustin and Gamon 2010, Lavorel et al 2011) or using a more fine-grained land-use mapping as suggested for example by Kain et al (2016). Embedding such approaches in a multi-scaled study would allow discussing trade-offs across scales, which would be essential for planning green infrastructures supporting multiple ecosystem services in urban environments (Hansen and Pauleit 2014). Thirdly, our approach only considered ecosystem services supply, except for recreation. It is obvious that not all the ecosystem services estimated in the study will be demanded locally. Measures as well as the appropriate scale of governance to enable the supply of ecosystem services to meet the demand can however only be designed through an in-depth understanding of the demand for and benefits of the services at various scales (e.g. Gómez-Baggethun et al 2013; Frantzeskaki and Tillie 2014). Finally, we have only considered a set of five ecosystem services. While the selection was based on a stakeholder process, some other ecosystem services have been shown to be highly relevant in urban contexts, such as food production (Mougeot 2006) or various cultural ecosystem services (e.g. Voigt et al 2014, Langemeyer et al 2015).
While our classification of urban areas was based on land cover indicators and height information and generated categories fairly consistent with the local climate zone proposed by Stewart and Oke (2012), the selection of other attributes, such as stand attributes, as suggested by Stokes and Seto (2019), or socio-economic data would allow generating other typologies, which could provide additional support for spatial planners. The calculation of the air pollution control service showed, for example, to be highly dependent on the air quality in the surrounding of the neighborhood. A better understanding of the role of socio-economic and environmental processes in the definition of the urban typology, as suggested in recent studies (e.g. Ewing and Cervero 2010, OECD 2012, Ewing et al 2014, Schläpfer et al 2016, Krehl et al 2016), could help isolate the role of other variables in ecosystem service assessments and provide more robust results (e.g. Andersson et al 2015). Furthermore, an improved typology could help better understand the combined role of spatial, transportation and environmental planning to foster urban ecosystem services. In this regard, considering the privately owned land and the differences in ecosystem services provision between privately and public owned land could affect the results considerably.
As urbanization proceeds, cities will continue to change in the coming decades (Luck and Wu 2002). Understanding this dynamic and the profound influence of such a transformation on ecosystem services are crucial for planning (Renard et al 2015). While datasets at various time steps are available at coarse resolution (see figure 1), they are inadequate for assessing the relationships between urban forms and ecosystem services bundles. Investigating temporal trajectories of the interactions between urban forms and ecosystem services would however be critical to better understand non-linear urban transformation and ultimately predict irreversible changes in the development of cities.
Finally, while we show that some urban forms support more ecosystem services bundles, vertical greening systems or green roofs have only received little attention in ecosystem services research. High density urban forms supported by living walls have been shown to provide various ecosystem services, from air pollution mitigation (Osanyintola and Simonson 2006) to temperature reductions (Fernández-Cañero et al 2011) and aesthetic benefits (White and Gatersleben 2011). Such structures however come along with major management and maintenance challenges (Pérez-urrestarazu et al 2015), providing additional arguments for investments in the remaining green areas in dense urban environments.
5. Conclusion
Urban typologies and their related ecosystem services bundles, as derived in this study, can be used in numerous ways to steer sustainable urbanization. They provide action-oriented knowledge that can help decision-makers choose between alternative planning strategies, allowing them to weight advantages and disadvantages of densification options. The comparison of a temperate and a tropical city allowed to demonstrate that decreasing the amount of sealed area is essential to foster the provision of ecosystem services, and that ecosystem services supply is not only linked to the surface-to-volume ratio of the buildings but particularly to the amount of infrastructures around the buildings. Furthermore, the management of the areas around the buildings is important when planning, managing and governing urban green infrastructure. Trees, especially, can provide important services for air pollution control and water flow regulation. Finally, large patches of green and blue areas are essential for supporting a high quality of life in both contexts, particularly if their accessibility is secured. In summary, a more systematic understanding of how urban form and the management of their surroundings influence ecosystem services provision has much to contribute to improving the quality of life in compact cities and in cities undergoing densification.
Acknowledgments
This research was supported by the National Research Foundation, Prime Minister's Office, Singapore under its Campus for Research Excellence and Technological Enterprise (CREATE) Programme (NRF2016-ITC001-013). We thank Tiangang Yin and Leslie Norford from the Singapore-MIT Alliance for Research and Technology for their expertise in remote sensing, and collaboration in sharing key datasets of Singapore. High resolution satellite imagery was provided courtesy of the DigitalGlobe Foundation (www.digitalglobefoundation.org). We are grateful for the support of Dr. Maarten van Strien in the spatial analysis.
Data availability statement
The data used for this study as well as the resulting maps are available in the ETH Research Collection with the identifier (https://doi.org/10.3929/ethz-b-000394053) or under (https://www.research-collection.ethz.ch/handle/20.500.11850/394053).
Appendix A.: Urban typology
Figure A1 shows the share of land covers in the various urban typologies in Singapore and Zurich. Figure A2 presents the clustering using various cell sizes in Singapore and Zurich. The clustering pattern is robust to variation in cell size resolutions. At the finer scale, an additional cluster of bare soil area was identified in Singapore, which was not considered relevant for the current analysis.
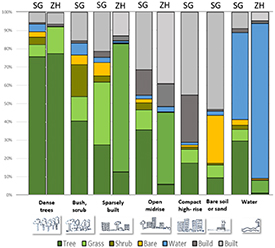
Figure A1. Urban typology of Singapore (SG) and Zurich (ZH) with their share of land covers ('build' refers to buildings, while 'built' includes any built surface, excluding the buildings). Vegetation heights and buildings heights were not included in this figure.
Download figure:
Standard image High-resolution image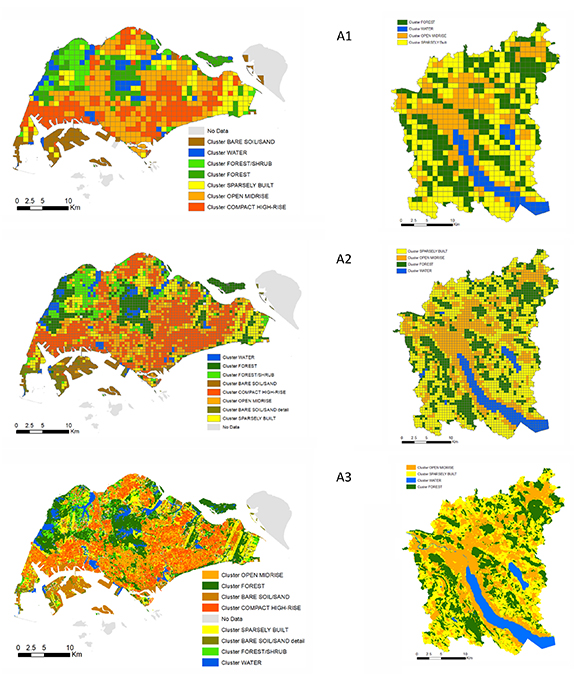
Figure A2. Sensitivity of clustering to cell size. A1–A3 and B1–B3 are the results of k-medoids clusterings with 1000 m × 1000 m, 500 m × 500 m, and 100 m × 100 m cell sizes in Singapore, resp. in Zurich.
Download figure:
Standard image High-resolution imageAppendix B.: Ecosystem services models and validation
Appendix. Air pollution control
Model used in Singapore and Zurich: Air pollution control was evaluated based on the potential of vegetation to capture particulate matter using a Leaf Area Index assigned to each vegetation type (tree, shrub, grass) based on a global synthesis of plant canopy Leaf Area Index measurements from more than 1000 published estimates representing around 400 unique field sites (Asner et al 2003) and the distance to highways, which are a major source of particulate matter in cities (Janhäll 2015). Values were weighted with a factor of 2 for the vegetation located closer to the highways (200 m, based on Durant et al (2010), who monitored vehicular pollutant gradients on highways in the United States of America) and were kept with no extra weight further away from highways based on Derkzen et al (2015), who have shown that ecosystems regulate the air quality even at far distances from pollution sources.
Model used for validation in Zurich: The yearly averaged PM 10-immissions values in μg/m3 for the canton of Zurich were simulated using the Swiss immission model PolluMAP (Heldstab and Künzle 1997) and reported on a 1 ha grid for the year 2010 (AWEL 2015). The dispersion model PolluMAP is fed by detailed emission inventories and actual measurements concentrations for validations purposes.
Appendix. Water flow regulation
Model used in Singapore and Zurich: Water flow regulation was estimated based on the Curve Number method proposed by USDA, S. (1986), in which run off is estimated based on land cover types. We assumed a fixed and uniform amount of precipitation over the study area based on Singapore's highest daily precipitation since 1993 of 211,1 mm day−1 (http://www.data.gov.sg) and Zurich's highest daily precipitation since 1980 of 73.5mm day−1 (www.meteoschweiz.ch). Curve numbers for characteristic land covers were based on estimates empirically taken by the USDA Natural Resources Conservation Service. Taking the inverse of the runoff potential, the ecosystem service can be interpreted as the runoff control provided by the vegetation under a maximal local daily precipitation.
Model used for validation in Zurich: Surface runoff was modeled for Switzerland using the FloodAREAHPC (Tyrna et al 2016) simulation model based on a 1m resolution DTM, amount of precipitation and run off based on land cover types, including buildings, infrastructures, agricultural land, moor, garden, forest, glacier, and rocks. Details are provided in the technical report of geo7 (2018). The resulting map shows run off for return periods of 100 years (AWEL 2018).
Appendix. Microclimate regulation
Model used in Singapore and Zurich: Microclimate regulation was computed based on emissivity values derived from the Landsat 7 ETM+ satellite (band 6, spatial resolution of 60 × 60 m) described by Schwarz et al (2011). The raw data on radiance from band 6.1 (low gain) was used directly without correcting for in-scene variability or atmospheric influence and assigned to the land cover categories derived from the land cover map and refined with information from both the masterplan of Singapore (Singapore Urban Redevelopment Authority 2008) and Zurich (Office of Spatial Development 2009). The thermal emission index is based on the ratio between the thermal emissivity of the different land cover types and the thermal emission of an urban green area. The higher the thermal emission index, the higher the potential of the land cover to produce heat.
Model used for validation in Singapore: The radiative budget of Bedok planning area in Singapore was assessed using the 3-D Discrete Anisotropic Radiative Transfer model (DART) run on the datasets described in the method section of this paper. Optical properties were assigned to urban properties in the selected neighborhood, while Leaf Area Density was assigned to various vegetation types. Datasets and details about the method are available in Dissegna et al (2019). The model was validated with a flux tower measurement at Telok Kurau site near Bedok planning area.
Appendix. Carbon sequestration
Model used in Singapore and Zurich: Carbon storage was estimated using the vegetation type and its volume as well as the root to shoot ratio to account for the root contribution based on a literature study of Jackson et al (1996). We assumed that each cubic meter of vegetation contains 1 kg dry weight of biomass, which was assessed by Proulx et al (2015) based on the analysis of published data from more than 900 plant communities across nine ecosystems. Each kilo of biomass was assumed to store 0.5 kg of carbon based on a study of 59 tropical trees by Martin and Thomas (2011).
Model used for validation in Zurich: Carbon sequestration was compared to a map calculated based on the values of the national greenhouse gas inventory report, listing carbon stocks for different land cover classes (n = 18), elevations (n = 3) and bioclimatic regions (n = 5) (Retsa, 2019). The carbon stock values are reported in tons of carbon per hectare (tn C/ha) for four pools: carbon in living biomass, in dead wood, in litter, and in mineral and organic soil and were mapped on a resolution of 1ha.
Appendix. Recreation
Model used in Singapore and Zurich: Recreation was estimated by evaluating the available green space within a service area against the demand by population density. The service area was calculated using the road network of Zurich (Grün Stadt Zürich 2005) and Singapore (Singapore Urban Redevelopment Authority 2008) considering a maximal walking travel distance of 400 m. We selected all the city parks in Singapore and Zurich from the Singaporean master plan (Singapore Urban Redevelopment Authority 2008) and the dataset of Grün Stadt Zürich (2005). For each park, a sufficiency rate was calculated based on the provision of and the demand for recreational space at the same time. For recreational provision, we considered a capacity of 50 people per ha. To assess demand, we estimated the total number of people in each service area by multiplying the number of buildings by the mean number of people per building, and assumed that a maximum of 8% of this number would use the park at any one time, based on recommendations from the city of Zurich (Grün Stadt Zürich 2005). Number of buildings and people per service area were estimated based on data layers from Zurich (AWEL 2019, FSO 2013) and Singapore (Singapore Urban Redevelopment Authority 2008).
Model used for validation in Zurich: The results of the recreational model were compared to results of a model estimating the recreation suitability based on an online survey (Rabe et al 2018). The model considers expert estimates to define criteria and weights to be considered in the suitability model as well as online surveys of over 500 participants rating the recreation suitability of various sites.
Appendix. Comparison of modeling outputs
We compared the resulting maps of the various models using the overall quantity and allocation disagreement index based on Pontius and Millones (2011) at a resolution of 100m, the lowest resolution of all datasets. The quantity disagreement (Q) measures the mismatch in the proportion of the output categories (equations 1 and 2), while the allocation disagreement (A) assesses the mismatch in the spatial allocation of the output categories (equations 3 and 4), where p is the portion of a map with a particular value, J is the total number of values, and g is one of the category of the values. Low values show a high overlap between the ecosystem services model results (table B1).


Table B1. Quantity and allocation disagreement index over pairwise comparisons of ecosystem services model results.
| Allocation and quan- | ||
|---|---|---|
| City | Ecosystem Service | tity disagreement (%) |
| Zurich | Air pollution control | 0.43 |
| Singapore | Microclimate Regulation | 0.62 |
| Zurich | Water Flow Regulation | 35.73 |
| Zurich | Carbon stock | 0.40 |
| Zurich | Recreation | 1.05 |
The outputs of the more detailed models match very well the outputs of the ecosystem services models run in both case studies, except for water flow regulation. The more detailed water flow model run in the Swiss case study takes into account linear features as preferential water flow pathways, which is not considered in the curve number based approach, leading to mismatches in the spatial allocation.
Appendix C.: Ecosystem services maps
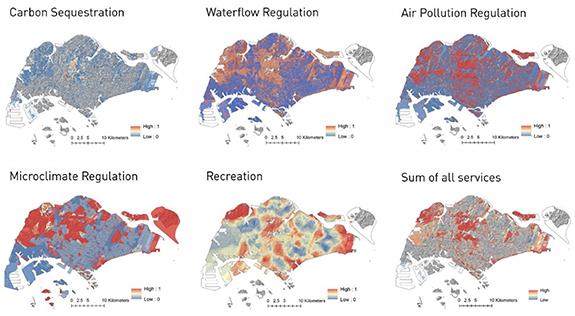
Figure C1. Map of ecosystem services in the Singaporean case study.
Download figure:
Standard image High-resolution image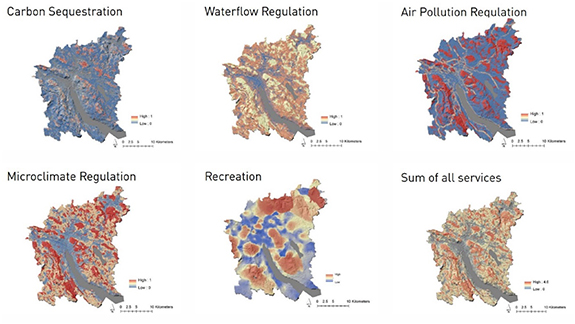
Figure C2. Map of ecosystem services in the Zurich case study.
Download figure:
Standard image High-resolution image
Appendix D.: Hotspots per urban typology
Appendix.
Table D1 shows the share of cold- and hot-spots in Singapore and Zurich per urban type.
Table D1. Share of hotspots per urban typology in Singapore and Zurich.
| Coldspots % | Hotspots% | |||
|---|---|---|---|---|
| Urban types | Singapore | Zürich | Singapore | Zürich |
| Sparsely built | 10 | 45 | 16 | 18 |
| Open mid-rise | 19 | 40 | 32 | 4 |
| Compact high-rise | 45 | — | 20 | — |
| Bare soil | 17 | — | 10 | — |
| Dense trees | 3 | 10 | 22 | 77 |
| Water | 6 | 5 | 0 | 1 |