

Abstract
Rangelands are one of the Earth's major ice-free land cover types. They provide food and support livelihoods for millions of people in addition to delivering important ecosystems services. However, rangelands are at threat from climate change, although the extent and magnitude of the potential impacts are poorly understood. Any declines in vegetation biomass and fluctuations in grazing availability would be of concern for food production and ecosystem integrity and functionality. In this study, we use a global rangeland model in combination with livestock and socio-economic datasets to identify where and to what extent rangeland systems may be at climatic risk. Overall, mean herbaceous biomass is projected to decrease across global rangelands between 2000 and 2050 under RCP 8.5 (−4.7%), while inter- (year-to-year) and intra- (month-to-month) annual variabilities are projected to increase (+21.3% and +8.2%, respectively). These averaged global estimates mask large spatial heterogeneities, with 74% of global rangeland area projected to experience a decline in mean biomass, 64% an increase in inter-annual variability and 54% an increase in intra-annual variability. Half of global rangeland areas are projected to experience simultaneously a decrease in mean biomass and an increase in inter-annual variability—vegetation trends both potentially harmful for livestock production. These regions include notably the Sahel, Australia, Mongolia, China, Uzbekistan and Turkmenistan and support 376 million people and 174 million ruminant Tropical Livestock Units. Additionally, the rangeland communities currently the most vulnerable (here, with the lowest livestock productivities and economic development levels and with the highest projected increases in human population densities) are projected to also experience the most damaging vegetation trends for livestock production. Although the capacity of rangeland systems to adapt is highly complex, analyses such as these generate some of the information required to inform options to facilitate pastoral system mitigation and adaptation strategies under climate change.
Export citation and abstract BibTeX RIS

Original content from this work may be used under the terms of the Creative Commons Attribution 4.0 licence. Any further distribution of this work must maintain attribution to the author(s) and the title of the work, journal citation and DOI.
1. Introduction
Rangelands contribute to the livelihood of millions of people worldwide and are important providers of ecosystems services. However, these systems are potentially at threat from climate change. Rangelands—primarily native grasslands, shrublands and savannas—are one of the Earth's dominant ice-free land cover types (Godde et al 2018). They are most commonly used as natural ecosystems for the production of domestic grazing livestock and are subject to limited disturbance such as land clearing or cultivation (Allen et al 2011). These systems contribute to the economy, social traditions and resilience of many communities (Hoffmann et al 2014, Hounet et al 2016, Coppock et al 2017) and provide a source of highly bioavailable micronutrients that can be vital to people's health, especially in low income regions (Dror and Allen 2011, Headey et al 2018). These systems are simultaneously important providers of ecosystems services, such as the maintenance of biodiversity (Alkemade et al 2013, Newbold et al 2015) and carbon storages compared with other production land uses (IPCC 2000, Garnett et al 2017).
Rangeland systems are vulnerable to climate change. Rangelands vegetation dynamics, and in consequence livestock production, are highly sensitive to climate—mean climate trends, but also and importantly climate variability (example of field studies: Yang et al 2008, Bat-Oyun et al 2016; including herd dynamics aspects: McCown et al 1981, Homewood and Lewis 1987, McCabe 1987, Oba 2001, Desta and Coppock 2002, Angassa and Oba 2007, O'Reagain and Bushell 2011, Angassa and Oba (2013). High inter-annual (year-to-year) climate variability creates large fluctuations in forage supply, and thus represents a challenge for herd management (Sayre et al 2013, Marshall 2015). Increases in intra-annual (within year) climate variability may also affect livestock production, although studies establishing relationships between climate seasonality and livestock dynamics and productivity are scarce and often limited to the analysis of drought and flood events. Studies focused on vegetation have however found that changes in seasonal climate patterns can have either positive or negative impacts on above ground biomass and forage quality, depending on the nature of the change and the agro-ecological context (Craine et al 2012, Peng et al 2013, Guan et al 2014, Prevéy and Seastedt 2014, Zeppel et al 2014).
Rangelands are also threatened by climate change-driven woody plant encroachment. In addition to altering rangelands ecosystems services, these dynamics impact on ruminant production systems since woody forage is harder to physically access for cattle and sheep and less palatable, digestible and nutritious than herbaceous plants.
Rangelands sensitivity to climate patterns has been identified at the global scale through modelling studies. Pastures with high year-to-year precipitation variability support lower livestock stocking rates than less variable regions (Sloat et al 2018). Over the last century, inter- and intra-annual precipitation variabilities have generally increased across global grasslands. Year-to-year variability increases were found to be negatively related to mean Normalised Difference Vegetation Index, a modelled proxy for vegetation growth (Sloat et al 2018). However, no distinction was made between herb, shrub and tree vegetation. A global rangeland model, G-range, which represents plant functional groups and their competition for resources, also provided new insights by going beyond characterising future climate patterns and highlighting future trends for key ecosystems variables under Representative Concentration Pathways (RCP) 4.5 an 8.5 (Boone et al 2018). In particular, it highlighted that mean global annual net primary productivity (NPP) may decline by 10 g C m−2 yr−1 in 2050 under RCP 8.5, but herbaceous NPP may increase by 3 g C m−2 yr−1 although responses varied substantially geographically. To the authors' knowledge, there has not been, however, any global study of projected changes in herbaceous biomass variability as well as how these compare to projected changes in mean biomass. This study aims to help fill this gap.
Rangeland community vulnerability depends not only on climate impacts on ecosystems processes but also on the ability of these communities to change in response to or cope with stressors, i.e. adaptive capacity (Gallopín 2006, Stafford Smith et al 2011, Marshall 2015). A particular attribute of rangeland systems compared with other food production systems is that they are mostly located in remote areas with few people, whom tend to have limited adaptive capacity (Thomas and Twyman 2005, Godber and Wall 2014, Marshall 2015). Rangelands are also usually not suitable for other food production types. These above-mentioned characteristics make these systems and the communities that rely on them particularly vulnerable to climate risks (Reid et al 2014). Combining rangeland vegetation analyses with information on rangelands socio-economic contexts can help gain insights as to the climate impacts on such systems.
In this study, we characterise projected vegetation trends to provide novel insights as to the extent and magnitude of climate change impacts on global rangelands. A particular focus is on herbaceous biomass, a key forage resource in ruminant production systems. Herbaceous trends are described not only in terms of mean values but also in terms of inter- and intra-annual variability and related to changes in woody and bare ground covers. In addition, we couple the projected vegetation trends with livestock, demographic and economic datasets to identify the extent of the rangeland human populations who may experience vegetation trends potentially harmful for livestock production, i.e. decreases in herbaceous mean or increases in its year-to-year variability. We also describe some of the socio-economic traits of these communities.
2. Methods
To better understand the extent to which global rangelands are at threat from climate change, the global rangeland model G-range was run under climate change scenarios (see method sections 2.1 and 2.6). The modelled vegetation outputs from G-range were then combined with spatially-explicit global livestock, economic and demographic datasets (see method sections 2.3–2.5) to provide further insights as to the vulnerability of rangelands to climate change, which depends on both climate impacts on ecosystems processes and the socio-economic contexts.
2.1. Rangelands modelling
The spatially explicit process-based model G-range was used to represent global rangeland ecosystems dynamics in response to climatic scenarios through 2050 (Boone et al 2018). G-range, which was built upon the CENTURY (Parton et al 1993) and SAVANNA models (Coughenour 1992, e.g. Boone et al 2002, 2005, 2011a, 2011b, Boone and Lesorogol 2016) is the only global ecosystem model currently available that has been developed to specifically represent rangeland plant functional groups and their changes in relative abundance over time. The model includes grazing and browsing by herbivores and tracks biogeochemical processes.
As detailed in Boone et al (2018), in G-range, water and nutrient dynamics are tracked through four soil layers and up to five plant parts. Plants compete for water, nutrients, light, and space to yield biogeochemical- and population-level changes in annual and perennial herbaceous plants, shrubs, and evergreen and deciduous trees. Proportions of shrub, tree and herbaceous covers in each grid cell are defined based on the spatial extent of the overstorey and understorey vegetation type. Within each grid cell, these proportions are added to the proportion of bare ground cover to achieve a sum of one. Per-grid cell fire extent and frequencies are stochastic, calculated from satellite-derived products (Giglio et al 2010). The proportion of plant material grazed is vegetation-type and biome-specific, and as such constant over time (Boone et al 2018). Atmospheric CO2 concentration effects on plant productivity and transpiration were modelled using a radiation use efficiency model (Parton et al 2001) (e.g. as in Pan et al 1998, King et al 2013). Soil parameters were derived from the Harmonised World Soil Database (FAO/IIASA/ISRIC/ISSCAS/JRC 2012). Sources for other spatial data used are as cited in Boone et al (2018).
G-range was run at a 0.5° spatial resolution on a monthly time-step with its main dynamic inputs being monthly precipitation and minimum and maximum temperature data. The model was initiated with a 2000 year spin-up, using historical climate from the AgMerra dataset (Ruane et al 2015, original spatial resolution: 0.25° grid cell) and repeated as needed. The model with initialised parameters was then run under different climate scenarios. G-range global- and site-scale model evaluation through space and time for key ecosystem variables of interest are presented in Boone et al (2018) and Sircely et al (2019).
The G-range outputs considered in this study included the proportion of herbaceous, shrub, tree and bare ground covers as well as herbaceous green leaf carbon (g C m−2) which was converted into g m−2 biomass by the multiplying factor 2.5 (Verchot et al 2006).
2.2. Rangeland extent for livestock production
Rangelands global extent (i.e. a binary rangeland spatial layer used as an overlay) was based on Boone et al (2018)'s assignment using land classifications within Loveland et al (2000). This assignment used in Boone et al (2018)'s G-range model parametrisation and evaluation excludes, for example, most regions of India, which are considered in other global classification work as mixed crop-livestock systems and not grazing only systems (Herrero et al 2013). Grid cells with less than 30% of land classified as grasslands according to Ramankutty et al (2008) for the year 2000 were also excluded from the global rangeland extent. With this approach, global rangeland area was 1846 million hectares, at the lower end of the range of existing estimates as this study focuses on regions with farmed livestock. In the result section, we cite the percentage of rangeland per pixel as one proxy of the local economic or social importance of rangelands.
2.3. Ruminant stocking rates and milk and meat productivities per unit area
Ruminant (cattle, buffaloes, sheep and goats) densities (head/grid cell) were from the area-weighted Gridded Livestock of the World (GLW 3) for the year 2010 (Gilbert et al 2018a, 2018b, 2018c, 2018d, 2018e, original resolution: one twelfth degree). They contain the area-weighted animal numbers per pixel in polygons where data were available in the subnational census and area-weighted predictions from the GLW 3 model in census area where the information was missing. They thus do not use additional data (e.g. climate data) to allocate the animal population between grid cells. Tropical Livestock Units (TLU) were used to provide an equivalent estimate of livestock biomass, with one TLU equivalent to 250 kg. The TLU conversion factor for cattle and buffaloes was 0.7 and for sheep and goats, was 0.1 (FAO 1993). Ruminant stocking rates in this study were estimated by dividing the total ruminant population per grid cell by the rangeland area in the grid cell. Ruminant milk and meat productivities per unit area (kg/ha/yr) were from Herrero et al (2017, 2018) for the year 2005 (original resolution: one twelfth degree). We note in passing that inferring meat and milk productivities per TLU from ruminant densities (Gilbert et al 2018a, 2018b, 2018c, 2018d, 2108e) and productivity per hectare (Herrero et al 2017) (not undertaken in this study) results in estimates at the lower end of what has been suggested in previous studies (Herrero et al 2017, 2018), due to the different dataset sources. We use stocking rates and milk and meat productivities as proxies to characterise rangelands food production status, which depends on agro-ecological conditions and farming management intensity.
2.4. Gross domestic product (GDP)—purchasing power parity (PPP)
GDP-PPP data were from the latest Global Gridded Geographically Based Economic Data (G-Econ), Version 4 for the year 2005 (Nordhaus 2006, Nordhaus and Chen 2016, original resolution: one degree). PPP is the exchange rate between a country's currency and US dollars adjusted to reflect the actual cost in US dollars of purchasing a standardised market basket of goods in that country using the country's currency. GDP comparisons using PPP are argued to be more useful than those using nominal GDP when assessing domestic markets because PPP takes into account the relative cost of local goods, services and inflation rates of the country, rather than using international market exchange rates which are more volatile over time and may distort the real differences in per capita income (African Development Bank 2009). We use GDP-PPP as a vulnerability indicator to characterise rangeland communities' economic development status and adaptive capacity potential under climate change (Thomas and Twyman 2005, Godber and Wall 2014, Marshall 2015). For instance, human population with the lowest GDP-PPP may have the lowest access to resources necessary to adapt in times of change, including institutional support, capital, infrastructures and education.
2.5. Human population density
Human population data (person/grid cell) for year 2010 and 2050 under the Shared Socioeconomic Pathways SSP2 were from The Global Population Projection Grids Based on SSPs, 2010–2100 version 1 (Jones and O'Neill 2016, 2017; original resolution: one eighth degree). SSP2 represents a 'middle of the road' world development pathway where trends broadly follow their historical patterns (Riahi et al 2017). In this study, human population density was estimated by dividing the total human population per grid cell by the grid cell area. This dataset allows us to assess the number of people who live in regions that may experience vegetation trends potentially harmful or beneficial for livestock production. Changes in population density can also have an impact on rangelands adaptive capacity. Indeed, regions projected to experience the largest increases in human population density may be the ones experiencing the highest increases in food demand and land pressures (Godber and Wall 2014). Climate change mitigation strategies such as herders' mobility may then become more constrained and risks of overgrazing may become more important, as discussed in section 5. These communities may require social safety net in priority, particularly if these regions are associated with vegetation trends potentially harmful for livestock production.
2.6. Climate change scenarios
The climate change scenarios were sampled for the period 1985–2065 from the most recent generation of climate change scenarios available, the ISI-MIP scenarios (Warszawski et al 2014), to account for uncertainties in the radiative forcing and the response from the climate system. Uncertainties concerning CO2 effects on grassland were also considered (tables 1, 2). The Generalised Circulation models considered were the spatially and temporally contrasting HadGEM2-ES and NorESM1-M. HadGEM2‐ES (Warszawski et al 2014, Havlík et al 2015a, 2015b). The RCPs considered in this study were the two most extreme RCPs (RCPs 2.6 and 8.5) as they allow us to infer the effect of the intermediate emission pathways impacts by approximate interpolation (van Vuuren et al 2011, Rogelj et al 2012). Atmospheric CO2 concentrations projections were from Meinshausen et al (2011), as recommended by the fifth phase of the Coupled Model Intercomparison Project (CMIP5) (Taylor et al 2012, Hovenden et al 2019). Due to large uncertainties regarding CO2 effects (Tubiello et al 2007), we also considered an additional climate scenario in which CO2 effects were constant over time at 370.66 ppm (average concentration for the period 1975–2015) as a sensitivity analysis on RCP 8.5 with the HadGEM2‐ES climate change projections.
Table 1. Climate change scenarios setting and G-range modelled herbaceous biomass (mean, inter- and intra-annual variability) in 2000 and 2050 (data-points weighted by their amount of area devoted to rangelands, spatial standard deviations in parentheses).
| Climate scenario | |||||
|---|---|---|---|---|---|
| Variable | Year | RCP 8.5a HadGEM2-ES with CO2 effect | RCP 8.5a NorESM1-M with CO2 effect | RCP 8.5a HadGEM2-ES without CO2 effect | RCP 2.6b HadGEM2-ES with CO2 effect |
| Hb-mean (g m−2) | 2000 | 156.9 (232.7) | 147.6 (231.7) | 151.9 (233.8) | 156.1 (230.9) |
| 2050 | 149.5 (258.0) | 138.9 (240.2) | 132.4 (221.6) | 145.1 (241.1) | |
| Hb-CVinter | 2000 | 1.37 (1.51) | 1.40 (1.50) | 1.44 (1.55) | 1.38 (1.52) |
| 2050 | 1.67 (1.69) | 1.70 (1.72) | 1.67 (1.71) | 1.63 (1.72) | |
| Hb-CVintra | 2000 | 0.21 (0.10) | 0.21 (0.09) | 0.21 (0.10) | 0.21 (0.11) |
| 2050 | 0.23 (0.13) | 0.23 (0.13) | 0.23 (0.15) | 0.23 (0.14) | |
aGreenhouse gases concentration: radiative forcing levels of 8.5 Watts per square metre, corresponding to concentrations of 1370 ppm CO2-eq in the atmosphere by 2100. On emerged land, anticipated temperature increase is on average +4.8 °C ± 0.9 °C by 2081–2100 (Collins et al 2013). CO2 concentration: increase at 541 ppm in 2050 and 936 ppm in 2100 (Meinshausen et al 2011). bGreenhouse gases concentration: radiative forcing levels of 2.6 Watts per square meter, corresponding to concentrations of 450 ppm CO2-eq in the atmosphere by 2100. On emerged land, the temperature increase is on average +1.2 °C ± 0.6 °C by 2081–2100 (Collins et al 2013). CO2 concentration: increase at 443 ppm in 2050 and 421 ppm in 2100 (Meinshausen et al 2011).
Table 2. G-range modelled vegetation cover dynamics between 2000 and 2050 (data-points weighted by their amount of area devoted to rangelands).
| Climate scenario | ||||
|---|---|---|---|---|
| Percent rangeland area that experience: | RCP 8.5 HadGEM2-ES with CO2 effect | RCP 8.5 NorESM1-M with CO2 effect | RCP 8.5 HadGEM2-ES without CO2 effect | RCP 2.6 HadGEM2-ES with CO2 effect |
| Increase in herbaceous cover | 23 | 25 | 25 | 28 |
| Increase in shrub cover | 61 | 52 | 71 | 56 |
| Increase in tree cover | 32 | 25 | 39 | 30 |
| Increase in woody (tree and shrub, undifferentiated) cover | 62 | 52 | 72 | 57 |
| Increase in bare ground | 43 | 51 | 31 | 45 |
2.7. Statistical analyses to characterise rangelands dynamics
Mean vegetation values for years 2000 and 2050 were averages of values over the periods 1985–2015 and 2035–2065, respectively, 30 years being the standard reference period to define a climate (WMO 2018). Analyses were completed in R version 3.5.1 (R Core Team 2018). We considered the most recently published spatially explicit socio-economic datasets and selected years that fell within the 1985–2015 time period for consistency with the vegetation baseline.
Rangelands herbaceous biomass trends considered as potentially harmful for livestock food production are decreases in mean herbaceous green leaf biomass (Hb-mean) and increases in inter-annual coefficients of variation of herbaceous green leaf biomass (Hb-CVinter) (see literature references in the Introduction section). These trends, together with changes in intra-annual variability in herbaceous green leaf biomass (Hb-CVintra), may modify rangelands ecosystems integrity and functionality and may result in overgrazing and land degradation if farming practices are not adequately adjusted to the vegetation changes. The significance of these trends is further explored in the discussion section. Hb-CVinter was calculated over the 30 year period as the standard deviation of annual Hb-mean divided by the average of annual Hb-mean. Hb-CVintra was calculated over the 30 year period as the standard deviation of the average Hb-mean for the 12 months of the year divided by the mean of these 12 monthly averages. ANOVA and 'post-hoc' Tukey HSD (honest significant difference) tests with a confidence level of 0.95 were performed to assess the statistical difference of means of different groups.
3. Results
3.1. Herbaceous dynamics and livestock production
Hb-mean places limits on livestock production, such that areas with the lowest Hb-mean as simulated by G-range currently tend to have the lowest animal stocking rates (see figure 4(A) and appendix A.5, which is available online at stacks.iop.org/ERL/15/044021/mmedia). The relationship between Hb-CVinter, Hb-CVintra and animal stocking rates, irrespective of Hb-mean is less apparent, which can be in part explained by the global nature of the datasets (appendix A.5). Also, Hb-mean and herbaceous variability tend to be correlated, with regions having low Hb-mean also showing high inter- and intra-annual variability and vice-versa, which is a known statistical inevitability (Conrad 1941).
3.2. Projected herbaceous biomass mean and variability
Overall, Hb-mean is projected to decrease across rangelands between 2000 and 2050, while Hb-CVinter and Hb-CVintra are projected to increase (table 1). However, we find a large spatial patchwork of both positive and negative trends.
G-range output values varied under the four different climate scenarios, but the spatial patterning of the temporal trends was similar enough amongst climate scenarios (as detailed in Appendix and in Boone et al 2018) to portray in this result section responses under RCP 8.5 with the HadGEM2‐ES climate change projections and CO2 effects enabled. For instance, on 73% of global rangeland area, the projected trends in mean herbaceous biomass (i.e. increase versus decrease) were the same under the four climate scenarios tested. On over 81% of global rangeland area, the projected trends in herbaceous biomass variability (inter- and intra-annual) as well as the projected trends in herb, shrub, tree and bare ground covers, were similar under RCP 8.5 with HadGEM2‐ES and CO2 effects enabled and under at least two of the three other climate scenarios tested. Global absolute mean values for years 2000 and 2050 for the four climate scenarios are presented in table 1. Comparisons of trends at the pixel and regional levels are presented in appendices A.1 and A.2.
On average, and as simulated by G-range under the RCP 8.5 HadGEM2-ES scenario with CO2 effect enabled, Hb-mean is projected to decrease (−4.7%, from 156.9 to 149.5 g m−2), with 74% of the 1846 million hectares of global rangelands showing a decreasing trend and 26% an increasing trend. These projections are driven by changes in agro-ecological land suitability for herbaceous production as well as by competition for resources with woody vegetation. On average, Hb-CVinter is projected to increase (+21.3%, from 1.37 to 1.67), with 64% of global rangeland area showing an increasing trend and 30% a decreasing trend. On about 4% of global rangeland area, herbaceous vegetation is projected to be completely replaced by shrubs and trees, and on 3% by bare ground covers. As for Hb-CVintra, it is projected to increase (+8.2%, from 0.21 to 0.23), with 54% of global rangeland area showing an increasing trend and 40% a decreasing trend. Global maps of absolute values for the year 2000 and projected changes by 2050 are provided in appendices A.4–9.6.
In terms of mean regional trends in herbaceous dynamics (figure 1(A)), the following regions show decreases in Hb-mean by 2050: Oceania (−37%), sub -Saharan Africa (−23%), Southeast Asia (−18%), South Asia (−18%), North America (−8%) and Middle East and North Africa (−3%) (see Appendix A.13 for region definitions). In contrast, the following regions show increases in Hb-mean: Europe and Russia (+19%), Eastern Asia (+9%) and Latin America (+8%). All nine regions show increases in Hb-CVinter, ranging from +5% (the Middle East-North Africa) to +42% (Europe). All regions also show increases in Hb-CVintra, ranging from +2.7% (the Middle East-North Africa) to +17.3% (Oceania). Thus, in terms of livestock production, Oceania, sub-Saharan Africa, Southeast Asia and South Asia are potentially the most at threat as these regions show both the largest decreases in Hb-mean and the largest increases in Hb-CVinter. In Europe, the benefits of large increases in Hb-mean on livestock production may be offset by large increases in Hb-CVinter. Indeed, the later can place pressures on long-term sustainable stocking rates. These regional mean values, however, hide large heterogeneities at finer spatial scales (see global maps presented in appendices A.4–A.5).
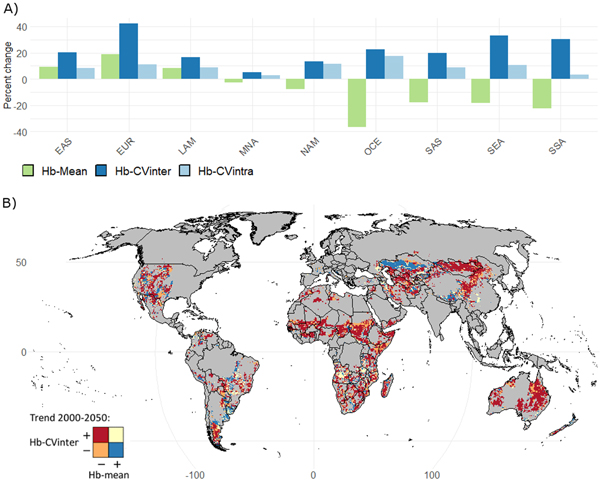
Figure 1. Trends in herbaceous biomass (mean, inter- and intra-annual variations) between 2000 and 2050 as modelled in G-range. Panel (A) shows regional percent changes in herbaceous dynamics (data-points weighted by their amount of area devoted to rangelands, i.e. 0.5° grid cells values weighted by the proportion of rangeland in the grid cells). Panel (B) highlights at the pixel level trends in herbaceous biomass mean (Hb-mean) and inter-annual variability (Hb-CVinter). A positive sign in the legend (+) indicates an increase in the vegetation variable by 2050 and a negative sign (−) a decrease. About 54% of rangeland area are projected to experience a decrease in Hb-mean and an increase in Hb-CVinter (red), 16% show an increase in Hb-mean and a decrease in Hb-CVinter (blue), 14% show a decrease in both Hb-mean and Hb-CVinter (orange) and 10% show an increase in both Hb-mean and Hb-CVinter (yellow). Global maps of absolute values for year 2000 and projected changes by 2050 are provided in appendices A.4–A.6. Climate scenario: HadGEM2‐ES RCP 8.5 with atmospheric CO2 effects enabled. Abbreviations: Eastern Asia (EAS), Europe and Russia (EUR), Latin America and the Caribbean (LAM), the Middle East-North Africa (MNA), North America (NAM), Oceania (OCE), South Asia (SAS), Southeast Asia (SEA) and sub-Saharan Africa (SSA). See Appendix A.13 for regions definitions.
Download figure:
Standard image High-resolution imageOver half (54%) of global rangelands show a combination of both decreases in Hb-mean and increases in Hb-CVinter (figure 1(B), red colour). For example, the large majority of rangeland area in the Sahel, Australia, Mongolia, China, Uzbekistan and Turkmenistan may experience simultaneously these two potentially harmful trends for livestock production. In contrast, 16% of global rangelands are projected to experience two beneficial trends (i.e. increases in Hb-mean and reduced Hb-CVinter), especially in Kazakhstan, southwest China and in parts of Brazil and the US.
Herbaceous biomass dynamics are affected by changing agro-ecological land suitability and competition for resources with other vegetation types. Decreases in herbaceous cover associated with woody and bare ground expansion are projected to occur on 77% of global rangeland area. In 52% of the cases, this decrease is associated with woody encroachment, while the fraction of bare ground remains steady or decreases (figure 2, red colour). In 34% of the cases, the decrease is associated with bare ground cover increases while woody cover remains steady or decreases (yellow). In the other cases (14%), both woody and bare ground covers increase at the detriment of herbaceous cover.

Figure 2. Trends in herbaceous covers between years 2000 and 2050, as projected by G-range, presented in relation to changes in woody (shrub and tree) and bare ground covers. About 23% of global rangeland area show an increase in herbaceous cover (blue), 40% show a decrease in herbaceous cover associated with an increase in woody cover while bare ground cover remains steady or decreases (red), 26% show a decrease in herbaceous cover associated with an increase in bare ground cover while woody cover remains constant or decreases (yellow) and 11% show a decrease in herbaceous cover associated with an increase in woody cover and/or bare ground cover (orange). Global maps of absolute values for year 2000 and projected changes by 2050 are provided in appendices A.7–A.10. Climate scenario: HadGEM2‐ES RCP 8.5 with atmospheric CO2 effects enabled.
Download figure:
Standard image High-resolution image3.3. Characteristics of pastoral communities subject to the potentially most harmful vegetation trends for livestock production
We couple the above described herbaceous vegetation trends with spatially-explicit livestock, demographic and economic datasets to identify the extent of the rangeland human populations whose livestock production may be most negatively impacted by vegetation changes. We also describe some of the socio-economic traits of these communities.
Half of the people living in rangeland systems (51%, 376 million people) live in regions that are projected to experience both a decrease in Hb-mean and an increase in Hb-CVinter. These regions currently support 174 million ruminant TLUs (49% of rangelands ruminant numbers). On 75% of these potentially harmfully affected rangelands, human population densities are projected to increase by 2050 (75% of total rangeland area show projected increases in human population density, i.e. decreases in per capita land, see appendix A.11 for global maps). In contrast, 89 million people live in regions that may experience beneficial vegetation trends for livestock production (i.e. increases in Hb-mean and reduced Hb-CVinter, 12% of rangelands population). These regions currently support 61 million ruminant TLUs (17% of global rangelands ruminant numbers). The rest of the population (201 million people) is projected to experience simultaneously a potentially beneficial and a potentially harmful vegetation trend: 90 million people may experience an increase in Hb-mean and Hb-CVinter and 111 million people a decrease in these variables. These regions currently support 101 million ruminant TLUs.
The potentially harmful vegetation trends for livestock production are projected to occur in pastoral communities that are currently the most vulnerable according to the socio-economic variables considered in this study. Indeed, areas projected to undergo both a decrease in Hb-mean and an increase in Hb-CVinter (figure 3, red colour) are also areas that currently have the lowest mean ruminant stocking rates as compared to areas that are projected to experience beneficial vegetation trends (0.19 versus 0.24 TLU/ha, figure 3(A)) (Tukey HSD test with p-value<0.05). They also have the lowest meat and milk land productivities (4.1 versus 6.7 and 18.0 versus 43.2 kg ha−1 yr−1, respectively, figure 3(B) and (C)), the lowest GDP-PPP (1.3 versus 2.2 billion US dollars, figure 3(D)), and the highest projected increases in human population density (+0.13 versus +0.08 people/ha, figure 3(F)). Areas that show beneficial trends also have on average the highest proportion of land devoted to rangelands, although the difference in mean values is not large (0.64% versus 0.61%, figure 3(E)).

Figure 3. Trends of herbaceous dynamics as projected by G-range by 2050 and current rangeland livestock, economic and demographic characteristics. Characteristics considered: (A) ruminant stocking rates, (B) meat and (C) milk annual productivities, (D) GDP-PPP, (E) amount of area devoted to rangelands, and (F) human population density changes by 2050. A positive sign in the legend (+) indicates an increase in the vegetation variable by 2050 and a negative sign (−) a decrease. The solid symbol indicates the mean value. The number of data-points (i.e. 0.5° grid cells) in each boxplot is as follows: 1856 (blue), 1221 (yellow), 1659 (orange), 6203 (red). Within each of the six panels, groups that were found to have means statistically significantly different from all other boxes in pairwise comparison do not share the same letter (a)–(c) (Tukey HSD test (p-value < 0.05)). The outliers are not represented but accounted for in the statistical analysis. For instance, in the first panel, the areas projected to experience simultaneously a decrease in mean herbaceous biomass and an increase in inter-annual variability are areas that, in 2010, have on average the lowest ruminant stocking rates. Climate scenario: HadGEM2‐ES RCP 8.5 with atmospheric CO2 effects enabled.
Download figure:
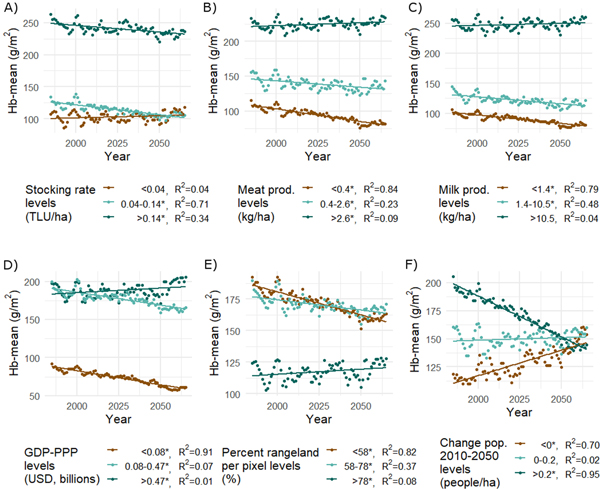
Standard image High-resolution imageFigure 4 provides information on Hb-mean values and rates of change between 1985 and 2065 for pastoral communities with different livestock, economic and demographic characteristics. Graphical interpretation shows a positive relationship between current Hb-mean, livestock food production and economic development levels. Indeed, areas with currently the lowest Hb-mean (figure 4, see Y-axis values) also currently have the lowest animal stocking rates, the lowest milk and meat land productivities and the lowest GDP-PPP (figure 4(A)–(D), brown and light blue colours). Regarding food productivities, this relationship can be explained in part by the Herrero et al (2013) dataset accounting for climate classes (i.e. regions and length of growing periods are accounted for in productivity estimates). Regions with the highest stocking rates, lowest food productivity and GDP-PPP are also projected to experience the highest biomass decrease rates by 2050. Areas with currently the lowest proportion of land devoted to rangelands tend to be associated with the highest Hb-mean, highlighting potential land competition with other food systems due to favourable agro-ecological conditions. These regions are projected to experience the largest declines in Hb-mean over time (figure 4(E), brown and light blue colours). Areas projected to experience the largest increases in human population density (>0.2 people/ha by 2050, figure 4(F), dark blue) are areas that currently have the highest Hb-mean but are projected to experience the largest declines in Hb-mean. In contrast, communities that may experience decreases in population density, while having currently the lowest Hb-mean, may also experience the highest increase rates (figure 4(F), brown colour).
Figure 4. Changes in mean annual herbaceous biomass between years 1985 and 2065 for regions with current low (brown), medium (light blue) and high (dark blue) levels of: (A) ruminant stocking rates, (B) meat and (C) milk productivities, (D) GDP-PPP, (E) amount of area devoted to rangelands, and (F) projected changes in human population density by 2050. Low, medium and high level thresholds were created by distributing a similar amount of rangeland area in each bin. Low, medium and high levels include the following number of datapoints: (A) low: 3508, medium: 3556, high: 4604; (B) low: 3667, medium: 3845, high: 4156 ;(C) low: 3743, medium: 3799, high: 4126; (D) low: 2997, medium: 3454, high: 5217; (E) low: 5398, medium: 3597, high: 2673; (F) low: 1843, medium: 5414, high: 4411. These bins which are created based on datasets for years 2000–2010 (see Method section) are kept constant over time. Regression lines and coefficients of determination (R2) of the linear regressions year ∼ mean annual herbaceous green leaf biomass for each group level are indicated on each of the panels. P-values below 0.05 are indicated with an asterisk. Climate scenario: HadGEM2‐ES RCP 8.5 with atmospheric CO2 effects.
Download figure:
Standard image High-resolution image
4. Discussion
This study finds that climate change may negatively impact vegetation dynamics in most rangelands, thus threatening the livelihood of millions of people who rely on them for goods and services. It also highlights that the pastoral communities currently the most vulnerable (here, with the lowest livestock productivities and economic development levels and with the highest projected increases in human population densities) are associated with significant declines in projected herbaceous biomass.
4.1. Forage mean and variability trends
Half of the global rangeland area is projected to experience simultaneously a decrease in mean biomass and an increase in inter-annual variability—vegetation trends highlighted in the literature as potentially harmful for livestock production (see Introduction). In contrast, 24% of the global rangeland area is projected to experience at the same time a potentially damaging (decrease in biomass or increase in interannual variability) and a potentially beneficial trend (increase in biomass or decrease in interannual variability). The understanding of the relative influence of biomass mean versus variability and their implications for forage quality, livestock production, farms economics and livelihoods is limited and highly context specific. For example, thresholds between equilibrium and non-equilibrium rangeland dynamics have been widely debated (e.g. Ellis and Swift 1988, Coppock 1993, Briske et al 2003, Boone and Wang 2007, Derry and Boone 2010, von Wehrden et al 2012), and studies have often lacked going beyond identifying generalised thresholds to quantitatively assess climate impacts in different systems. Decreases in mean biomass or increases in inter-annual variability may also not be a threat to livelihoods on lands that are currently below animal carrying capacity (Fetzel et al 2017).
Although a majority of global rangeland production systems may experience an increase in climatic risk, some regions may experience more favourable climatic conditions. For instance, parts of Kazakhstan, southwest China, Brazil and the US are projected to experience both increases in mean herbaceous biomass and decreases in inter-annual variability. These regions should, however, be considered with caution as the ability to take advantage of these favourable trends may be limited due to high local heterogeneities in agro-ecological conditions and limiting socio-economic contexts (Lin et al 2013). Many of these grazing systems are also already considered to be overgrazed (Hankerson et al 2019).
While a key rangeland dynamic presented in this study is herbaceous forage availability for grazing, herb quality, which was not studied here, is also a major determining factor of animal productivity and the carrying capacity of the land and is strongly related to climatic patterns (McCown et al 1981). For instance, tropical pastures across the world (Peel et al 2007) are usually of low quality in the dry season (i.e. low protein content and digestibility), especially so in Australia and sub-Saharan Africa due to nutrient-poor soils (Humphreys 1991). Forage quantity and quality can also be affected by changes in herbaceous species composition under climate change (Lin et al 2013), a dynamic not modelled in this study.
Shifts from herbaceous vegetation to shrubs and trees will also have consequences on livestock production. Indeed, shrub and tree forage can be harder to physically access for cattle and sheep, and is less palatable, less digestible and generally has a lower digestible protein content. In this study, decreases in herbaceous cover associated with woody encroachment are projected to occur on 51% of global rangeland area. Encroachment dynamics associated with rising atmospheric CO2 levels and changes in fire and precipitation regimes have already started to be observed in several regions (e.g. US Great Plains, Southern Africa, Northern Australia) (Archer et al 2017).
4.2. Adaptation strategies across ecological, socioeconomic and institutional systems
In the face of global warming and overall harmful impacts on forage production, as projected in this modelling study, the existing suite of adaptation strategies across ecological, socioeconomic, and institutional systems and coping range that have been developed in response to existing variability may not be enough (Ash et al 2012, Kates et al 2012, Joyce et al 2013). With projected increases in variability, livestock mobility will be key in arid and semi-arid systems. These systems have developed under low to medium mean precipitation and high climate variability. Livestock keepers have used mobility to take advantage of forage spatial and temporal variability. This mobility has however been greatly constrained since the mid- to last-twentieth century, especially in Asia and Africa, due to changes in land tenure and land use policy, including land privatisation and increased land competition (Fratkin 2001, Kerven et al 2004, Herrick et al 2012, Reid et al 2014, Zalles et al 2018). For example, the state-driven nomad sedentarisation projects in China (Hruska et al 2017) and shifts from communal to semi-commercial land tenures in southern African rangelands (Dube and Pickup 2001) have reduced opportunities for herders to take advantage of spatial heterogeneity in forage. In these systems, increasing institutional support through policies that address the issues of land tenure, fragmentation and degradation is a priority (Galvin et al 2008, Hobbs et al 2008), especially considering the projected potentially harmful vegetation trends for livestock production highlighted in this study. More transformational production systems shift will also be required where increases in population density and land competition limit opportunities for herders' movement. For instance, feeding livestock with crop residues in regions where cropping encroachment is occurring is an option that needs to be considered (e.g. in East and West Africa); as are transitions from cattle and sheep rearing to goat systems in places where the woody cover is expanding. Other opportunities to increase production efficiencies—which tend to be the lowest in South Asia, Latin America and the Caribbean, and Africa—include improved animal performance (e.g. genetics, health), pasture and feeding practices, and herd structure management (e.g. reducing breeding overhead) (Gerber et al 2013, Herrero et al 2013). In developed regions where overall variability is lower and access to resources higher, the adoption of technologies that are economically and environmentally sustainable will be key in the face of future climate changes.
Barriers to the implementation and maintenance of adaptation strategies can be significant and span from the inability of natural systems to adapt to the rate and magnitude of climate change, to constraints in technology, financing, cognitive and behavioural components, and social and cultural settings (Marshall and Stokes 2014, Joyce and Marshall 2017). Some of these barriers may be stronger in areas with low economic development, which this study found to potentially also experience the most negative climate-driven vegetation trends. Projected increases in human population densities in these regions and a growing demand for ruminant meat products reinforce the increasing importance of social safety nets as food insecurity and land pressure might be exacerbated. Additional indicators than those presented in the Result section can help inform on rangelands vulnerability to climate change. While this study focusses on spatially-explicit datasets (0.5° spatial resolution), additional analyses at the country level presented in appendix A.12 also show that potentially harmful vegetation trends for livestock production are projected to occur in countries that are currently the most vulnerable according to the grazing systems-related vulnerability indicators developed by Godber and Wall (2014). These countries, particularly in sub-Saharan Africa and parts of Asia, tend to have the highest nutritional reliance on grazing animal-based food products, the lowest level of food security, the highest exposure to projected population growth and the lowest adaptive capacity. Other vulnerability indicators, not studied here at the grid-cell or country level, also merit attention and include, but are not limited to, considerations of risks of disease outbreak (Allen et al 2017, FAO 2018), access to veterinary and extension services and enrolment in livestock insurance schemes (Skees and Enkh-Amgalan 2002), research investment in agriculture, level of education and strength of the agricultural innovation systems, which depend on a set of factors relating to research, extension, business and policy (Grovermann et al 2019).
4.3. Future climate-related and other uncertainties
Global climate models performance in simulating climate extremes and trends in the present climate has been improving over the last two decades (Sillmann et al 2013a), but uncertainties remain as to climate futures (Sillmann et al 2013b, Eyring et al 2019). In particular, our understanding of changes in the frequency, intensity and duration of extreme climatic events (e.g. droughts and floods) is limited (Sillmann et al 2017), and climate indices have been developed to reduce the knowledge gap (e.g. spatiotemporal assessments of global drought events in Sheffield and Wood 2008a, 2008b, Sheffield et al 2009, Nijssen et al 2014, Herrera-Estrada et al 2017). Considering these uncertainties, climate changes may arise that are currently not adequately represented in global climate models and thus not accounted for in this study. Additionally, some ecosystems dynamics influenced by climate patterns and other factors, such as differences in management practices and historical land-use patterns (Polley et al 2017), are not fully captured. For example, fire extent and frequencies are stochastic in the current modelling application and based on observed frequencies, but may be expected to increase in the future (Running 2006, Syphard et al 2018). Land uses such as grazing also regulate rangeland responses to climate change. For instance, sheep grazing has been found to limit CO2 stimulation of grassland productivity by selectively consuming legumes and forbs, plants with the greatest growth responses to CO2 (Newton et al 2014). Furthering our understanding of ecosystems functioning under changing climates and our ability to model these ecosystems dynamics are required (Schewe et al 2019). We note for example that the absolute values for herbaceous biomass inter-annual variability as modelled by G-range tend to be higher than those measured on the ground, especially in low productivity rangelands (Knapp and Smith 2001, O'Reagain and Bushell 2011). Climate change will also impact on animals (e.g. water and heat stress, diseases emergence and spread). Besides climate change, new and accelerating demographic, political and economic dynamics are impacting on rangelands resilience and adaptive capability.
5. Conclusion
This study highlights the urgency of developing and implementing context-specific adaptation options in these social-ecological systems, with the support of relevant science as well as policy and enabling environments. These adaptations will differ among the different social-ecological systems. The deepening of our understanding of the climate vulnerability of the ecological, economic, and social components of rangeland systems is a necessary step to identify pathways for adaptation in times of climate change and other future uncertainties.
Acknowledgments
This paper constitutes an output of the following projects: Bill and Melinda Gates Foundation LiveGaps (OPP1134229), International fund for Agricultural Development 'Climate-smart dairy systems in East Africa through improved forages and feeding strategies: Enhancing productivity and adaptive capacity while mitigating greenhouse gas emissions' (2000001002). The authors also acknowledge financial support from the CGIAR Programme on Climate Change Agriculture and Food Security (CCAFS).
The views expressed here cannot be taken to reflect the official opinions of these organizations.
Data availability
AgMerra historical climate data are available at https://data.giss.nasa.gov/impacts/agmipcf/agmerra/. Information on how to access the ISI-MIP climate change scenarios is provided here: https://isimip.org/gettingstarted/data-access/#for-external-non-participant-users. Atmospheric CO2 concentrations projections used in this study are available at http://pik-potsdam.de/~mmalte/rcps/. G-range vegetation outputs presented in this study are available from the corresponding author on reasonable request. G-range model and other associated input data used in this study are available at: http://www2.nrel.colostate.edu/projects/grange/index.php. Grassland extent data used in this study are available at: http://earthstat.org/cropland-pasture-area-2000/. Ruminant density data used in this study are available at: https://nature.com/articles/sdata2018227. Ruminant milk and meat productivities per unit area used in this study are available at: https://data.csiro.au/dap/landingpage?pid=csiro:29893&v=2&d=true. Gross Domestic Product (GDP) Purchasing Power Parity (PPP) data used in this study are available at: http://sedac.ciesin.columbia.edu/data/set/spatialecon-gecon-v4. Human population data used in this study are available at: http://sedac.ciesin.columbia.edu/data/set/popdynamics-pop-projection-ssp-2010–2100. Country-level vulnerability indicators related to grazing-systems are available at: https://onlinelibrary.wiley.com/doi/full/10.1111/gcb.12589.