

Abstract
Previous research indicates that the effects of climate warming, including shrub expansion and increased fire frequency may lead to declining lichen abundance in arctic tundra and northern alpine areas. Lichens are important forage for caribou (Rangifer tarandus), whose populations are declining throughout most of North America. To clarify how lichen cover might affect caribou resource selection, ecologists require better data on the spatial distribution and abundance of lichen. Here, we use a combination of field data and satellite imagery to model lichen cover for a 583 200 km2 area that fully encompasses nine caribou ranges in interior Alaska and Yukon. We aggregated data from in situ vegetation plots, aerial survey polygons and unmanned aerial vehicle (UAV) imagery to align with 30 m resolution Landsat pixels. We used these data to train a random forest model with a suite of environmental and spectral predictors to estimate lichen cover. We validated our lichen cover model using reserved training data and existing external datasets, and found that reserved data from aerial survey polygons (R2 = 0.77) and UAV imagery (R2 = 0.71) provided the best fit. We used our lichen cover map to evaluate the influence of estimated lichen cover on caribou resource selection in the Fortymile Herd from 2012 to 2018 during summer and winter. In both seasons, caribou avoided lichen-poor areas (0%–5% lichen cover) and showed stronger selection as lichen cover increased to ∼30%, above which selection leveled off. Our results suggest that terrestrial lichen cover is an important factor influencing caribou resource selection in northern boreal forests across seasons. Our lichen cover map goes beyond existing maps of lichen abundance and distribution because it incorporates extensive field data for model training and validation and estimates lichen cover over a much larger spatial extent. We expect our landscape-scale map will be useful for understanding trends in lichen abundance and distribution, as well as for caribou research, management and conservation.
Export citation and abstract BibTeX RIS

Original content from this work may be used under the terms of the Creative Commons Attribution 3.0 licence. Any further distribution of this work must maintain attribution to the author(s) and the title of the work, journal citation and DOI.
1. Introduction
Lichens are major contributors to overall biodiversity and biomass in many Arctic and subarctic ecosystems around the world. These long-lived and slow-growing organisms play important roles in ecosystem function by being among the first species to colonize newly exposed surfaces (Cutler 2010). Lichens also fix nitrogen (Cornelissen et al 2001) and provide crucial forage, especially during winter, for arctic and subarctic herbivores such as caribou and reindeer (Rangifer tarandus; Heggberget et al 2002, Joly et al 2007). However, multiple factors directly related to climate change may lead to decreased lichen abundance in high-latitude areas.
Experimental and observational studies in arctic tundra and northern alpine areas show that climate warming has facilitated widespread expansion of shrubs (Myers-Smith et al 2011), which outcompete terricolous (occurring on the ground) lichen through shading and litter accumulation (Joly et al 2009, Elmendorf et al 2012a, Fraser et al 2014). Increases in shrub density, height, and spatial coverage decrease surface albedo, increase evapotranspiration, and increase accumulation of snow and litter, which may promote more shrub growth and reduce lichen abundance (Sturm et al 2001, Joly et al 2009, Blok et al 2011, Loranty et al 2011). However, evidence linking warming temperatures and declining lichen abundance in circumpolar areas is not consistent throughout plot-scale studies (Elmendorf et al 2012b).
In boreal regions, forest fire has long been a major driver of lichen abundance and distribution. Over hundreds of years fire can prevent late-successional replacement of lichen by feathermosses and forest litter, yet lichen requires decades to fully recover after a fire (Klein 1982, Payette et al 2000, Coxson and Marsh 2001, Jandt et al 2008). The increasing frequency, spatial extent, and severity of fires observed in western North America's boreal forests and Arctic tundra during recent decades (Hu et al 2010, Kasischke et al 2010) may lead to lichen declines (Collins et al 2011). Therefore, climate change in both arctic and subarctic regions may significantly reduce lichen cover through shrub expansion and altered fire regimes.
Terricolous lichens provide an easily digestible source of carbohydrates for caribou in winter, when the availability of high-protein forage is limited (Person et al 1980, Parker et al 2009). Changing fire regimes, through their effects on lichen and shrub expansion (Fraser et al 2014), may influence the movements, distribution, and nutritional ecology of caribou, which depend on habitats with forage lichen during winter (Joly et al 2003, Collins et al 2011).
Most caribou populations in arctic, subarctic and boreal regions of western North America are declining (Vors and Boyce 2009, Hebblewhite 2017). Managers are concerned that the effects of climate change on lichen abundance and distribution may alter caribou population dynamics for many northern caribou populations that are subject to less human disturbance than those farther south (Joly et al 2010, Gustine et al 2014, Mallory and Boyce 2017). Recent observations from the Fortymile Herd in interior Alaska and western Yukon may indicate nutritional limitation, including low calf weights, low parturition (birth) rates of three-year-old females and population range expansion (Boertje et al 2017). These data suggest caribou may be struggling to meet energy requirements (Boertje et al 2017).
Lichens eaten by caribou in Alaska and Yukon are primarily terricolous, light-colored macrolichens (i.e. fruticose and foliose growth forms) from the Cetraria and Cladonia genera (figure 1; nomenclature following Esslinger et al 2019 except for Cetraria following McCune and Geiser 2009, henceforth, 'light macrolichens;' Rees et al 2004, Joly and Cameron 2018). Spatially-explicit maps depicting lichen distribution and abundance are necessary to quantify changes to caribou forage availability and assess relationships between lichen forage and caribou population dynamics (Parker et al 2009).

Figure 1. Photos showing mats of Cladonia stellaris (left) and Cladonia rangiferina (dominant species on right) in the Fortymile caribou herd range in interior Alaska. Photos by MJM and ECP.
Download figure:
Standard image High-resolution imageHowever, creating lichen cover distribution maps is difficult due to the challenge of consistently linking remotely-sensed spectral reflectance to lichen cover, volume, and biomass (Nelson et al 2013, Falldorf et al 2014, Rickbeil et al 2017). Terricolous lichen occurs in mats that often encompass a few square meters or less and can be difficult to detect and map over large spatial extents using satellite imagery. Existing published lichen maps based on satellite imagery generally have focused on relatively small spatial extents (Nelson et al 2013, Falldorf et al 2014) or have not incorporated in situ sampling data for training and validation (Rickbeil et al 2017).
The goal of our study was to estimate current cover of light macrolichens across a large spatial extent covering the range of the Fortymile Herd and adjacent caribou ranges in Alaska and Yukon (figure 2). Managers and researchers are interested in using the resulting lichen cover map as a predictive layer in caribou resource selection analyses to gain a better understanding of the spatial and nutritional ecology of caribou in the region. We demonstrate an application of our lichen map, using step selection functions (SSFs; Fortin et al 2005, Thurfjell et al 2014), to test our hypothesis that lichen cover affects seasonal resource selection of female Fortymile Herd caribou. We predict that caribou will select areas with higher lichen cover, and that strength of selection for high lichen cover will be strongest in winter, when deciduous vegetation has senesced.
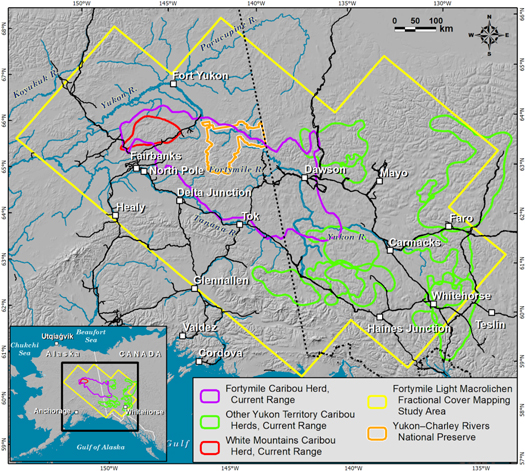
Figure 2. Map of eastern Alaska and Yukon showing lichen map footprint and caribou population range boundaries.
Download figure:
Standard image High-resolution image2. Methods
2.1. Study area
We modeled current (circa 2015) fractional cover of light macrolichens across 583 200 km2 of east-central Alaska, central and southern Yukon, and far northwestern British Columbia. We selected this area to fully encompass the ranges of the Fortymile (100 000 km2), White Mountains (6500 km2), Aishihik (10 000 km2), Clear Creek (3000 km2), Chisana (8000 km2), Hart River (13 000 km2), Klaza (11 000 km2), Kluane (8000 km2), Pelly (9000 km2) and Laberge (5000 km2) caribou ranges (figure 2). The study area consists of rolling hills, subalpine and alpine areas, and large forested river valleys stretching from Alaska's White Mountains in the northwest to near Whitehorse, Yukon in the southeast. The historical fire rotation in interior Alaska's boreal forest is 100–200 years (Lynch et al 2004, Kasischke et al 2010). Approximately 73% of the study area and 61% of the Fortymile Herd range remains unburned since the 1940s (figure A1), according to fire occurrence data from the Alaska Large Fire Database (ALFD; Kasischke et al 2002) and the Canadian National Fire Database (CNFD; Stocks et al 2002).
2.2. Primary training and validation data
2.2.1. Existing vegetation data
We used existing in situ plot data from 528 plots across 29 sites in Yukon–Charley Rivers National Preserve (YUCH) collected from 2006 to 2015 as part of the US National Park Service's Central Alaska Network vegetation monitoring program (Roland et al 2004, Roland et al 2019; table 1; figure A2; see appendix A1 for sampling details). We used data from 486 of these plots (27 sites) to train models and reserved data from 42 plots (2 sites) for validation. We used existing visual aerial estimates (n = 838 polygons) of lichen cover collected by Environment Yukon during helicopter-based vegetation surveys of three areas in Yukon: Dawson City (summer 2010), Klaza caribou range (summer 2013) and Hart River/Clear Creek caribou ranges (summer 2016). These polygons ranged from 5 to 439 Landsat pixels in area. We randomly sampled five 30 m resolution pixels from each of 684 polygons for training the lichen cover model and reserved pixels from the remaining 154 polygons for validation. The model training and validation splits were determined randomly by assigning each site (YUCH plot or Environment Yukon aerial survey polygon) a uniformly distributed random number between 0 and 1. Sites with a value <0.8 were used for training and all others were used for validation.
Table 1. Summary of training and validation datasets used for modeling fractional lichen cover in the Fortymile caribou (Rangifer tarandus granti) range in Alaska and Yukon, 2006–2017.
| Dataset | n | Location | Years | Cover type | Size | Notes | Modeling status |
|---|---|---|---|---|---|---|---|
| UAV survey | 22 | Alaska, Yukon | 2017 | Image-based, sum to 100% | 0.25 m2 quadrats, 2–30 ha image | Lichen to species or color group | Training, reserved validation |
| BLM CIR imagery | 15 | Alaska | 2015–2016 | Photo-interpretation. Lichen cover only | 1000–2000 ha | Highly variable image quality | Validation |
| Yukon aerial survey polygons | 738 | Yukon | 2010–2016 | Aerial visual, sum to 100% | 0.4–40 ha | Light macrolichens to genus | Training, reserved validation |
| Yukon–Charley vegetation plots | 528 | Alaska | 2006–2013 | Point-intercept any-hit cover (Coulloudon et al 1999), sum to >100% | 0.02 ha | Point-intercept to lifeform; quadrats to genus | Training, reserved validation |
| Forest Inventory and Analysis sites | 44 | Alaska | 2012–2013 | Validation | |||
| BLM White Mountains plots | 386 | Alaska | 2007, 2012 | Point-intercept, sum to 100% | Lichen to forage or non-forage | Validation |
2.2.2. Additional vegetation data and coincident UAV imagery
We collected additional terrestrial lichen-cover data and high-resolution RGB imagery in summer 2017 from UAVs at 22 forested and alpine sites across interior Alaska and western Yukon within three caribou ranges: Fortymile (n = 13), Hart River (n = 8), and Clear Creek (n = 1; table 1; figure A2). We chose sites that were easy to access (≤6 km from a road) and had relatively high lichen cover. At each site, we visually estimated the percent cover (top-hit cover, sensu Karl et al 2017) of terrestrial lichen and vegetation in ten 0.25 m2 square ground quadrats spaced 10 m apart along a 100 m transect. We marked quadrat corners on the ground with 1 m long PVC pipe or wood lath to ensure the quadrats were clearly visible in the UAV imagery and to eliminate the need for precise ground control points. We grouped lichen species into color groups (white, gray, yellow, green, brown, black, orange) and estimated percent cover for each group within quadrats. Cover estimates for terrestrial lichen and vegetation species totaled 100% for each quadrat, allowing for direct comparisons with cover estimates derived from classified two-dimensional nadir RGB imagery.
We flew a DJI Phantom 4 Pro unmanned aerial vehicle (UAV) with a 20-megapixel camera sensor over a 2–6 ha rectangular grid at 30 m above ground level (AGL) that fully encompassed the 100 m transect and captured nadir RGB imagery at ∼0.8 cm pixel resolution at each site (figure A3). Whenever possible, we flew UAVs under overcast skies to minimize shadows in the resulting imagery. We used a fixed white balance for each flight to minimize spectral variation across sites. All flights had 80%–85% image overlap along the flight path (endlap) and 70% overlap between flight lines (sidelap). At seven of the Fortymile sites, we collected additional nadir RGB imagery from a DJI Phantom 3A with a 12 megapixel camera sensor at 46–70 m AGL over 5–29 ha, yielding 2.0–3.2 cm pixel resolutions.
We uploaded raw UAV imagery to Pix4Dmapper Cloud (Pix 4D S.A. 2017), where we used structure-from-motion processing to produce several products for each site, including a two-dimensional RGB orthomosaic image, a digital surface model (DSM) and a digital terrain model (DTM). Using guidance from quadrat photos (see below), we visually classified each of the 29 RGB orthomosaics to 'light macrolichens' (white, gray, and yellow color groups), 'Other', and 'No Data'. The 'Other' class included canopy, dark lichens, other vegetation, and non-vegetated surfaces, while 'No Data' included shadows and areas off the edge of the mosaic. In sites with shrubs and/or trees, we mapped the canopy using a canopy height model (CHM) generated by subtracting DTM values from DSM values. Then, we extracted the ground layer for spectral classification by masking out all pixels that were >20 cm in height in the CHM layer—a threshold that corresponds to the cutoff between dwarf and low shrub in the Alaska Vegetation Classification (Viereck et al 1992).
We conducted a supervised spectral classification of the ground layer using a maximum-likelihood algorithm in Multispec software (Biehl and Landgrebe 2002). We created training polygons throughout each UAV orthomosaic in ArcMap (ESRI 2017) using photo- interpretation. We used ground photographs of the sampling quadrats from a Nikon D3300 camera as references to calibrate the photo-interpretation. We classified each UAV mosaic independently due to variations in light and color balance among mosaics. As a measure of classification accuracy, we compared lichen cover estimates derived from classified UAV imagery with ocular cover estimates for each 0.25 m2 sampling quadrat and found good agreement between the two (10.3% mean absolute error; figure A4). Visually-estimated lichen cover within quadrats averaged 6.3% higher than classification-derived lichen cover.
We overlaid our classified UAV imagery with 30 m resolution Landsat pixels and used the 'raster' package in Program R (Hijmans 2019) to aggregate UAV pixels by calculating the proportion of each UAV pixel class within Landsat pixels (figure 3). We masked out 'No Data' UAV pixels that composed >25% of a Landsat pixel and then recalculated light macrolichen percent cover within all remaining UAV pixels. Finally, we merged the 30 m lichen cover summaries into a single raster image to use as training data. Imagery data from 19 of the 22 total UAV sites provided fractional lichen cover training data for 1437 Landsat pixels. We reserved three UAV sites (90 Landsat pixels) for validation using the same random number assignment procedure as for the vegetation datasets (section 2.2.1).
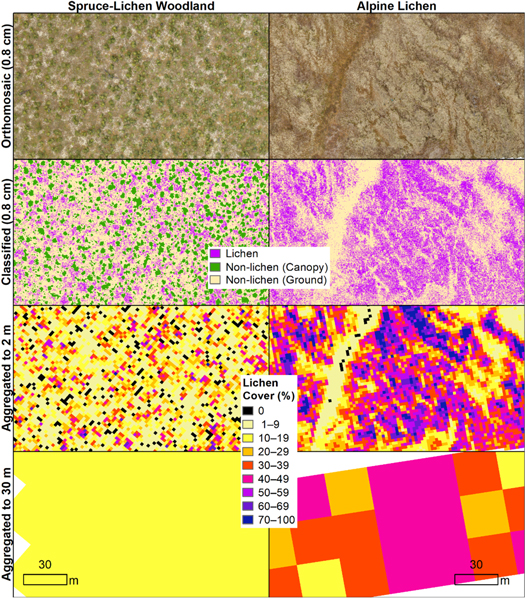
Figure 3. Examples of maximum likelihood classification of UAV orthomosaic images and aggregation from UAV to Landsat resolution in the Fortymile caribou range.
Download figure:
Standard image High-resolution image2.3. Remote sensing datasets, framework and model development
We used three types of training data to model fractional cover of light macrolichens, including terrestrial lichen cover estimates from the in situ plots, aerial survey polygons, and UAV imagery. Prior to using these data for training, we applied the lichen cover estimate for each YUCH in situ plot to the Landsat pixel overlapping the plot center. We used Google Earth Engine to apply the overall lichen cover estimate from each aerial survey polygon to five randomly selected Landsat pixels within that polygon. The pooled data from all three datasets was used to train a random forest model that applied a suite of environmental and spectral predictors to estimate lichen cover throughout the study area. In addition to validating our model with reserved training data from in situ plots, aerial survey polygons, and UAV imagery, we also used additional existing lichen cover data for validation (details below in 2.3.3 and 2.3.4), including data from in situ plots, aerial imagery, and an existing lichen cover map that overlapped a portion of our study area.
2.3.1. Spectral predictors
We used Google Earth Engine (Gorelick et al 2017) to generate surface reflectance percentile composites from all available Tier 1 Landsat 7 ETM + and Landsat 8 OLI images acquired in May–September during 2014–2017. We filtered images to remove clouds, snow, shadows, and water. Then, for each band (blue, green, red, near-infrared, SWIR1, and SWIR2), we extracted the 10th, 25th, 50th, 75th, and 90th percentiles as predictors (figure A5). Similarly, we calculated six spectral indices (table A1) for every image and extracted the same percentiles for each index layer. While some previous studies (Nordberg and Allard 2002, Falldorf et al 2014, Rickbeil et al 2017) have used the Normalized Difference Lichen Index (NDLI), we note that this index is a simply a reformulation of the Normalized Difference Snow Index (NDSI; Hall et al 1995). Because there is no difference in the information content of the two formulations, we used the longer-established NDSI as a spectral predictor. The percentile composites effectively represent the range of spectral conditions that occur during the snow-free season, even though that season can vary by elevation and topographic position. We visually inspected the composites and rejected the minimum (0%) and maximum (100%) composites due to excessive noise from unmasked clouds, shadows, haze and snow.
2.3.2. Environmental predictors
We used elevation data from the Global Multi-resolution Terrain Elevation Data 2010 (GMTED2010) Breakline Emphasis 7.5 arc-second product (Danielson and Gesch 2011). We estimated percent tree cover for 2016 using Hansen et al's (2013) global forest cover and forest cover loss datasets by using 2000 tree cover estimates and assigning areas with forest loss from 2000–2016 to 0% tree cover. We used the maximum water extent from 1984 to 2015 from the JRC Global Surface Water Mapping Layers v1.0 (Pekel et al 2016) to exclude areas that we assumed had no lichen cover, but we did not include water extent as a model predictor. These global layers were resampled and reprojected to the coordinate system of our final lichen cover map using nearest neighbor resampling. The global forest cover and surface water layers were nominally 30 m resolution, while the GMTED2010 was nominally 225 m resolution and was primarily used to distinguish broad-scale terrain differences (e.g. mountainous areas versus low valleys). Although we did not use fire occurrence data as predictors in our lichen cover model, we summarized estimated lichen cover values by fire year using polygon data from the ALFD and the CNFD.
2.3.3. Model development and evaluation
We developed random forest models (Breiman 2001) in Google Earth Engine using selected data from existing field datasets and 2017 UAV imagery. Approximately 20% of each training dataset was reserved for validation. In our random forest models, we used a random forest classifier with 10 trees, the regression mode, and a random seed of 1. We compared the performance of models with raw surface reflectance predictors versus those with topographically-corrected surface reflectance predictors (Soenen et al 2005) using reserved validation data. We selected the best model based on root mean square error (RMSE) and mean absolute error (MAE) using the reserved validation data.
Validating an extensive map derived from remote sensing can be challenging but it is a very important step. We used multiple approaches to characterize the performance and uncertainty of our map: (1) pooling all reserved training data, (2) validating against each reserved training dataset separately, (3) validating against selected independent plot datasets not used in model training, (4) cross-validation of training data predicted in 'out-of-bag' mode, (5) a stratified sample of photo-interpreted points using color infra-red (CIR) imagery from the Bureau of Land Management (BLM), and (6) a comparison to an existing Klaza caribou range lichen cover map created using Landsat 5 imagery and Environment Yukon aerial imagery as training data (Caslys Consulting Ltd 2014; see appendix A2 for details on Klaza lichen map).
2.3.4. Additional remote sensing validation data
We validated the final model using existing BLM point-intercept vegetation data from 386 plots in burned and unburned areas of the White Mountains, Alaska, collected in 2007 and 2012 (table 1). We also used US Forest Service (USFS) Forest Inventory and Analysis (FIA) lichen cover data from 45 sites in interior Alaska in 2012–2013. In addition, we used BLM aerial imagery from 2015 to 2016 collected from a Nikon DSLR camera modified to capture CIR to validate our model (see appendix A3 for details on BLM CIR imagery). The BLM CIR imagery encompassed 11 of the 22 UAV sample sites from 2018 but covered much larger areas (967–2062 ha).
2.4. Application of lichen cover model to caribou resource selection
We used step selection functions (SSF; Fortin et al 2005, Thurfjell et al 2014) to evaluate the influence of estimated lichen cover on adult female caribou resource selection in the Fortymile caribou range from 2012–2018 during summer and winter (see appendix A4 for more details on SSFs and caribou GPS location data). In an SSF, the step length is the distance between consecutive GPS locations, and the relative turning angle is the difference in bearing between consecutive steps (Fortin et al 2005). Using conditional logistic regression, we contrasted lichen cover at used steps with lichen cover at random 'available' steps that we presumed were available to the animal along its movement path (figure A6). In addition to lichen cover, we annotated both used and available locations with values for percent tree cover, elevation, slope, and snow cover frequency (Macander and Swingley 2017).
We defined summer as the period between the mean dates of peak calving and rut across all collared females and years (May 25–October 5) that we determined from daily movement speeds. Winter represented the remaining portion of the year. We derived movement distributions for each individual during both seasons at three step scales (2.5, 10 and 25 h), which roughly correspond to Johnson's (1980) third through fourth orders of habitat selection, by fitting gamma distributions to observed step lengths and von Mises distributions to observed turning angles. We used these distributions to generate five random displacements from used locations at time t, and local availability at time t + 1, for every step made by an individual for each of the three step scales. We clustered locations by animal in our conditional logistic regression models to account for the lack of independence between steps made by the same individual (Prima et al 2017).
3. Results
Mean modeled lichen cover values increased from 1.4% at 0–200 m elevation up to 8.1% at intermediate elevations in alpine areas (1400–1600 m; e.g. Blackstone Uplands, Ogilvie Mountains, Yukon-Tanana Uplands) then dropped towards zero at high elevations (e.g. Wrangell Mountains and Alaska Range; figures 4 and 5). Mean lichen cover was highest (8.1%) in areas with no record of fire in the ALFD and CNFD. Mean lichen cover within mapped burn perimeters ranged from 3.0% in areas burned in 2000–2009 to 5.9% in areas burned prior to 1950.

Figure 4. Distribution of lichen cover across the range of elevation (excluding elevations >2200 m) within 583 200 km2 in eastern Alaska and Yukon. Violin area is proportional to the total area of map pixels in that elevation zone. The top 5% of lichen cover values within each elevation zone are excluded from violins. Horizontal lines indicate median lichen cover within elevation zones, including the top 5% of lichen cover values.
Download figure:
Standard image High-resolution image
Figure 5. Fractional cover of light macrolichens estimated for 2015 across 583 200 km2 in eastern Alaska and Yukon.
Download figure:
Standard image High-resolution image3.1. Model validation
We examined model performance separately for each of the reserved validation datasets (table A2). The R2 was highest for Yukon aerial survey polygons and lowest for the YUCH vegetation monitoring plots. The best-fit line for the UAV plots was nearly 1:1, indicating consistent model performance results across the range of lichen cover values (figure 6). Results from cross-validation with the training data were very similar to the reserved data for the UAV sites, better than the reserved sites for Yukon aerial survey polygons, and worse than the reserved sites for the YUCH plots.
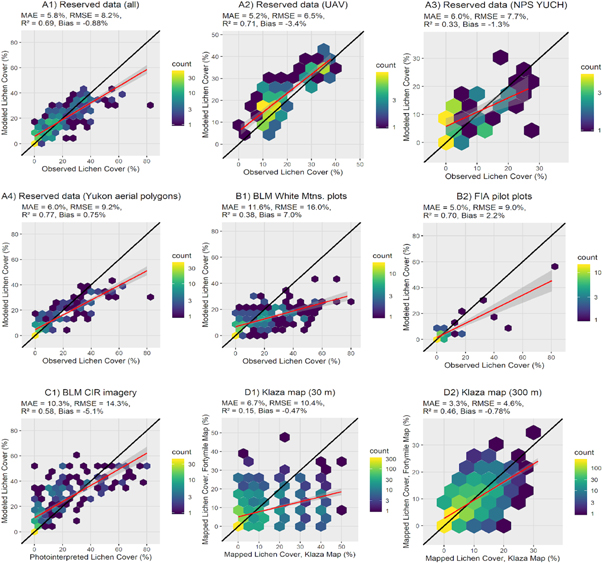
Figure 6. Hexagonal bin plots showing modeled lichen cover versus in situ lichen cover for validation datasets (A1–C1) and existing lichen cover map (D1–D2) in the Fortymile caribou (Rangifer tarandus granti) range.
Download figure:
Standard image High-resolution imageThe BLM White Mountains vegetation plots from 2007 and 2012 had similar R2 and best-fit lines, and a larger RMSE than the reserved YUCH vegetation plots (figure 6). Both datasets are based on similar point-intercept vegetation sampling methods and include plot data from the mid-2000s. There was good agreement between our map and recent FIA plots. Agreement between our map and the existing Klaza lichen map was poor when compared pixel-wise at 30 m resolution, but much better when both products were aggregated to 300 m. Photo-interpretation of 200 usable samples from BLM orthoimagery had an RMSE of 14.3% and showed that the model had fairly good performance at high observed lichen cover values.
3.2. Caribou-lichen resource selection analysis
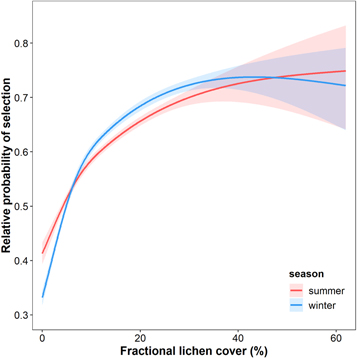
Caribou generally avoided areas with lowest lichen cover (0%–5%) during both summer and winter seasons and selected areas with higher lichen cover (figures 7 and A7). There was little difference in selection strength for lichen cover between seasons and the response to lichen cover was consistent across spatiotemporal scales (figure A8). The best models for both winter and summer included a two-knot spline for lichen cover and quadratic terms for elevation, slope and snow cover frequency (table A3).
Figure 7. The effect of lichen cover on the relative probability of selection in adult female caribou in the Fortymile caribou population, Alaska and Yukon. All other covariates were held at mean values. Shaded regions indicate 95% confidence intervals.
Download figure:
Standard image High-resolution image
4. Discussion
We used data products derived from satellite imagery, in situ vegetation sampling plots and UAV imagery to estimate fractional cover of light macrolichens across 583 200 km2 of boreal forest and alpine tundra in interior Alaska, western Yukon and northern British Columbia. We found a strong, positive relationship between lichen cover and caribou resource selection. Based on these results, we expect our landscape-scale map will be useful for understanding trends in lichen abundance and distribution, as well as for caribou research, management and conservation.
4.1. Comparison to existing lichen maps
There are very few existing studies that have modeled lichen cover or volume at landscape scales. Falldorf et al (2014) estimated lichen volume for lichen-dominated alpine heath communities within an 8000 km2 study area in Norway using two indices derived from Landsat imagery and training data from hundreds of ground-based measurements. Rickbeil et al (2017) used Falldorf et al's (2014) equations to estimate lichen volume for all Landsat pixels classified as tundra by a MODIS-derived land cover layer within 700 000 km2 in the Northwest Territories and Nunavut. Unlike Falldorf et al (2014), Rickbeil et al (2017) did not incorporate in situ training or validation data into their model, and the authors state that their estimates of lichen volume should not be interpreted as absolute values. Nelson et al (2013) estimated percent cover of usnic (yellow) lichens and light macrolichens (yellow + white or gray color groups) across 12 000 km2 of Denali National Park using a combination of vegetation plots, midsummer Landsat imagery, and topographic metrics.
Both Falldorf et al (2014) and Nelson et al (2013) reported better model performance using topographically-normalized reflectance predictors rather than raw predictors. During model development, we evaluated the use of topographically-normalized predictors based on the Modified Sun–Canopy–Sensor topographic correction function (Soenen et al 2005). We pursued models with raw surface reflectance predictors because they outperformed those with topographically-normalized predictors, though we expect our model with normalized predictors might have performed better with a more accurate digital elevation model across the entire study area. Further, our suite of predictors included six spectral indices, which collectively dampen the effects of topographic illumination.
Visual observations of lichen on the landscape indicate that it may be much more easily seen at certain times, for example after a period of warm weather following abundant rain. Our percentile composite approach captured unusual spectral conditions that may be diagnostic, while avoiding the extreme outliers (minimum, maximum) that tend to be dominated by remnant cloud and shadow.
Falldorf et al (2014) developed their lichen volume estimator for a homogeneous, lichen-rich landscape. Our study area included a variety of land cover types, including forested areas and alpine tundra, that precluded the use of a single lichen volume estimator such as that in Falldorf et al (2014). Further, while lichen volume or lichen biomass are likely more directly relevant to caribou than lichen cover, these data were not available for the YUCH plots and aerial survey polygons that we used to train and validate our model. Instead, we modeled lichen cover, which is positively correlated with volume and biomass in most locations (Dunford et al 2006, Moen et al 2007, Collins et al 2011), and thus reflects the patterns of forage abundance for caribou. We note, however, that if core portions of the Fortymile caribou range were heavily grazed, the relationship between lichen cover and biomass may be weak in those areas. Nonetheless, our model combined with additional biomass data (Hebblewhite, unpubl. data) could subsequently be used to explore the effects of caribou grazing intensity. Our results showing highest lichen cover on non-glaciated alpine slopes at intermediate elevations is consistent with results from past studies in Alaska that did not generate map products (Holt et al 2008) or else did so for a limited spatial extent (Nelson et al 2013).
4.2. Sources of uncertainty
While the lichen cover model performed well overall, there was a bias towards overestimating lichen cover at low lichen cover values and underestimating lichen cover at high lichen cover values (figure 6). The overestimates at low lichen cover were mostly related to erroneously mapping areas with zero or negligible lichen cover as having low lichen cover, i.e. 10% or less. These areas were generally correctly mapped as no to low lichen cover. No and low lichen cover areas occurring with other vegetation were challenging to distinguish because the lichen cover was largely obscured by canopy and shadow in many of these areas. High lichen cover areas tended to be patchy at Landsat scale (e.g. figure 3 bottom panel). High-resolution image-based lichen cover summaries such as the UAV aggregation (figures 6 and A2) and the stratified photo interpretation (figures 6 and C1) were most suitable for characterizing the spatial heterogeneity of lichen cover and these validation datasets also showed smaller biases for higher lichen cover areas. This suggests that including more UAV blocks in future mapping efforts may improve model performance for lichen-rich areas.
We did not systematically assess the robustness of our modeled lichen cover estimates to the use of different percentile composites as spectral predictors. However, we do not expect the specific percentiles selected to be important if noise from unmasked clouds, shadows, haze, and snow is minimized. We caution that excessive noise in the 10% and 90% percentile composites could be problematic for studies with fewer Landsat observations and/or less effective masking.
4.3. Application of lichen maps to caribou resource selection
Results from our resource selection analysis supported our hypothesis that lichen cover influences caribou resource selection and demonstrates the utility of lichen cover mapping for caribou management efforts. Even when accounting for the effects of topography, tree cover and snow cover frequency, caribou selected areas with higher lichen cover. During both winter and summer, caribou selection for lichen cover increased steadily until ∼30% lichen cover (figure 7). Estimated lichen cover values >30% were very rare (<1% by area) across the Fortymile caribou range. Our results suggest that lichen may be important forage for Fortymile caribou not only during winter but also after vegetation senescence in late summer and early fall, consistent with a recent diet analysis of caribou in the Western Arctic Herd (Joly and Cameron 2018).
Our resource selection results corroborate those from past studies that were based primarily on field site observations, which found caribou select areas with high lichen cover. Woodland caribou in Canada's Jasper and Banff National Parks selected locations with high terrestrial lichen cover (Shepherd et al 2007); migratory caribou from the Western Arctic Herd selected areas with higher percent cover and volume of lichen during winter compared to random locations (Joly et al 2010); the Nelchina Herd, whose range is to the Fortymile Herd range, selected areas with high lichen cover and biomass (Collins et al 2011), and caribou in Denali National Park increased their use of areas with high lichen abundance through winter (Nelson et al 2018).
4.4. Implications for future research
We believe our use of high-resolution UAV imagery helps bridge the gap between fine-scale in situ sampling and satellite imagery, demonstrating a relatively inexpensive and efficient way to collect data on vegetation cover with relevance to wildlife management. Imagery from UAVs provided data to calibrate and validate our regional lichen cover models over large spatial extents and provided a baseline for tracking lichen cover over time at field sites. A larger footprint from UAV flights would provide even more model training data, although additional research on the trade-off between larger image footprint versus decreased spatial resolution would be valuable for future mapping efforts.
Our mapping of lichen cover distribution across several caribou ranges in central Alaska and Yukon provides a useful baseline for future efforts estimating lichen cover change over time. Change analyses would be potentially valuable for exploring longer-term population dynamics of caribou relative to their resource selection and nominal range distributions, as well as for assessing the effectiveness of caribou management actions and the potential impacts of climate change.
Acknowledgments
We received funding from the Bureau of Land Management, Alaska Department of Fish and Game, National Park Service, Environment Yukon, and the National Aeronautics and Space Administration (NASA) through Arctic Boreal Vulnerability Experiment (ABoVE) grants to MH (NNX15AW71A), and SG/MM (NNX17AE44G/NNX15AU03A). EP received support from NASA's Earth and Space Science Fellowship, Wildlife Conservation Society Canada's W Garfield Weston Fellowship, University of Montana's W A Franke Graduate Fellowship and Montana Institute on Ecosystems' Graduate Research Award. We thank the dozens of botanists who collected ground and aerial vegetation data that we used to train and develop the lichen cover model.
This work builds on an earlier project supported by Dave Gustine and Layne Adams (USGS) and Kyle Joly (National Park Service), which mapped terricolous macrolichen cover within Yukon–Charley Rivers National Preserve. Field data were collected by ABR Inc., Environment Yukon, Bureau of Land Management, University of Montana, and Central Alaska Network Vegetation Program of the National Park Service. Carl Roland (National Park Service) provided vegetation data from Yukon–Charley Rivers National Preserve. Marcus Waterreus and Jennifer Staniforth (Environment Yukon) provided vegetation data from Yukon. High-resolution aerial color-infrared imagery was collected and processed by Seth Kiester (BLM). Patrick Burns (Northern Arizona University) and Christopher Swingley (ABR) assisted with the development of Google Earth Engine scripts for normalized Landsat surface reflectance composites.
Data availability statement
The data that support the findings of this study are available upon request from the authors.