

Abstract
This study examines the effects of 1.5 °C and 2 °C global warming levels (GWLs) on intra-seasonal rainfall characteristics over the Greater Horn of Africa. The impacts are analysed based on the outputs of a 25-member regional multi-model ensemble from the Coordinated Regional Climate Downscaling Experiment project. The regional climate models were driven by Coupled Model Intercomparison Project Phase 5 Global Climate Models for historical and future (RCP8.5) periods. We analyse the three major seasons over the region, namely March–May, June–September, and October–December. Results indicate widespread robust changes in the mean intra-seasonal rainfall characteristics at 1.5 °C and 2 °C GWLs especially for the June–September and October–December seasons. The March–May season is projected to shift for both GWL scenarios with the season starting and ending early. During the June–September season, there is a robust indication of delayed onset, reduction in consecutive wet days and shortening of the length of rainy season over parts of the northern sector under 2 °C GWL. During the October–December season, the region is projected to have late-onset, delayed cessation, reduced consecutive wet days and a longer season over most of the equatorial region under the 2 °C GWL. These results indicate that it is crucial to limit the GWL to below 1.5 °C as the differences between the 1.5 °C and 2 °C GWLs in some cases exacerbates changes in the intra-seasonal rainfall characteristics over the Greater Horn of Africa.
Export citation and abstract BibTeX RIS

Original content from this work may be used under the terms of the Creative Commons Attribution 4.0 licence. Any further distribution of this work must maintain attribution to the author(s) and the title of the work, journal citation and DOI.
1. Introduction
Extreme climatic events such as flooding, droughts, and heatwaves have profound implications on the livelihoods of communities. In a warming world, it is projected that such events will be more frequent and intense (Sanchez et al 2004, Mcgregor et al 2005, Dai 2011, Vizy and Cook 2012, Dosio et al 2018). The 21st Conference of Parties (COP21) to the UNFCCC held in Paris in December 2015 reached a resolution (Paris Climate Change Agreement—Christopher 2016) to limit the global temperature rise to well below 2 °C over the pre-industrial levels and preferably limit the increase to below 1.5 °C. This will help in reducing further adverse effects of climate change, particularly in developing countries (IPCC 2018), which have low adaptive capacities to climate change compared to the developed countries (Mirza 2003).
The region of study is the Greater Horn of Africa (GHA, figure 1) consisting of 11 countries, namely: Burundi, Djibouti, Eritrea, Ethiopia, Kenya, Rwanda, Somalia, South Sudan, Sudan, Tanzania, and Uganda. The region is characterised by three major rainy seasons: March–May (MAM) and October–December (OND) over the equatorial sector and the June–September (JJAS) season over the northern part of the region.

Figure 1. The study area map showing the Greater Horn of Africa (21° E–52° E and 12.5° S–24.5 °N). The northern sector consists of Sudan, Eritrea, Djibouti, Ethiopia, South Sudan, and the northern part of Somalia while the equatorial sector is composed of Uganda, Kenya, Rwanda, Burundi, Tanzania, and southern Somalia. The shaded colour represents the topography.
Download figure:
Standard image High-resolution imageOver the last few decades, countries in the GHA, whose gross domestic products rely heavily on rain-fed agriculture productivity, have frequently experienced unexpected extreme weather events such as heavy rainfall and severe droughts (Funk et al 2008, Lyon and Dewitt 2012, Mwangi et al 2014). These events, coupled with other socio-economic factors, have negatively impacted the communities within the region. In order to alleviate the negative impacts, information about the intra-seasonal rainfall metrics such as the onset, cessation, extended wet and dry periods and length of rainy season (LRS) are fundamental in the planning of agricultural activities.
Limited research has been conducted on variability and predictability of the intra-seasonal metrics of rainfall over the GHA (e.g. Camberlin and Okoola 2003, Segele and Lamb 2005, Mugalavai et al 2008, Camberlin et al 2009, Sylla et al 2013, Philippon et al 2015). These studies have utilised in situ datasets for analysis. The linkages to the climate drivers and the predictability of some of the intra-seasonal characteristics have also been investigated (e.g. Camberlin 1995, Camberlin and Okoola 2003, Gitau et al 2013). Efforts have also been made to understand the models performance in reproducing the current climate (e.g. Otieno and Anyah 2013a, Endris et al 2013 and 2016, Ongoma et al 2019, Kisembe et al 2019) and assess future projected changes in rainfall and temperature over the GHA (e.g. Shongwe et al 2011, Anyah and Qiu 2012, Otieno and Anyah 2013b, Omondi et al 2014, Endris et al 2019). However, only a limited number of studies over the region have investigated the model representation of these intra-seasonal rainfall characteristics as well as their projected changes on climate change time-scales (e.g. Cook and Vizy 2012 and 2013).
In response to the COP21 resolution, much of the climate change research has focused on quantifying the impacts of 1.5 °C and 2 °C global warming levels (GWLs) since pre-industrial times on various aspects of Sub-Saharan Africa climate (e.g. Kumi and Abiodun 2018, Maure et al 2018, Nangombe et al 2018, Nkemelang et al 2018, Osima et al 2018). Over GHA, Osima et al 2018 assessed the potential effects of 1.5 °C and 2 °C GWLs on the changes in the mean and extreme rainfall and temperature during MAM and JJAS seasons.
We examine the effect of 1.5 °C and 2 °C GWLs on the onset, cessation, LRS and consecutive wet and dry days over the GHA using 25 multi-model ensemble members from the coordinated regional climate downscaling experiment (CORDEX) initiative. Furthermore, we quantify the impact of the extra 0.5 °C warming above the 1.5 °C GWL on these intra-seasonal characteristics to help inform the debate on the need to limit global warming increase to well below 2 °C.
2. Data and methods
2.1. Data
Data from 9 CORDEX (Giorgi et al 2009) regional climate models (RCMs) driven by 10 global climate models (GCMs) of the Coupled Model Intercomparison Project (CMIP5) were utilised. The data were accessed from https://esgf-data.dkrz.de/search/cordex-dkrz/ and http://csag.uct.ac.za/. We used Representative Concentration Pathway 8.5 (RCP8.5) as this provides the largest number of ensemble members and considers the most realistic business-as-usual scenario given the current trajectory of global greenhouse gas emissions (Taylor et al 2012).
The methodology used for identifying the period a GCM reaches each GWL can be found in Nikulin et al (2018) and has been utilised by other studies over Sub- Sahara Africa (e.g. Kluste et al 2018, Maure et al 2018, Mba et al 2018, Osima et al 2018). We briefly summarise the methodology for identifying the period a GCM reaches each GWL and refer the reader to Nikulin et al (2018) for further details. The timing of the GWL for each GCM is defined as the first 30 year moving average (centre year) of global temperatures above the predefined GWL compared to the pre-industrial time period (1861–1890). The same 30 year period identified from GCMs were used to extract simulated data for analysis from the corresponding CORDEX RCM that downscaled the GCM.
3. Methods
A number of definitions exist for calculating rainfall onset and cessation. Proposed methods to calculate onset based solely on rainfall include those that utilise threshold values on accumulated rainfall (e.g. Sivakumar 1988, Segele and Lamb 2005, Marteau et al 2009, Marteau et al 2011), percentage cutoff on the accumulated rainfall (e.g. Odekunle et al 2005) and the sum of accumulated anomalies (e.g. Liebmann and Marengo 2001, Marengo et al 2001, Camberlin and Diop 2003, Camberlin et al 2009, Recha et al 2012, Dunning et al 2016).
In this study, a wet day is defined as a day on which accumulated rainfall is at least 1 mm. The onset is defined as the first day of the wet season when a wet spell of accumulated rainfall in 3 consecutive days is at least 20 mm and there is no dry spell of at least 7 d in the next 20 d. The onset algorithm is consistent with one currently being used operationally at the IGAD Climate Prediction and Applications Centre (ICPAC), the Regional Climate Centre for the GHA. This definition has previously been applied in the region to study the interannual variability of onset and cessation over Ethiopia (e.g. Segele and Lamb 2005). Table 1 summarises the definitions of intra-seasonal variables utilised in the study.
Table 1. Definitions of intra-seasonal variables used in the study.
| Variable | Definition |
|---|---|
| Wet day | Day on which accumulated rainfall is at least 1 mm |
| Dry day | Day on which accumulated rainfall is less than 1 mm |
| Onset | The first day of the season when a wet spell of accumulated rainfall in 3 consecutive days is at least 20 mm provided there are no continuous dry days of at least 7 d in the next 20 d |
| Cessation | First day of a dry-spell when the total rainfall in 20 d is less than 10 mm following a 30 d period after the onset |
| LRS | Number of days between onset and cessation |
| Consecutive dry days (CDD) | Maximum number of consecutive days with less than 1 mm(dry days) of rainfall |
| Consecutive wet days (CWD) | Maximum number of consecutive days with more than 1 mm (wet day) of rainfall |
To assess how global temperature rise of 1.5 °C and 2 °C from the pre-industrial period impacts the rainy season over GHA, the mean changes in the onset, cessation, LRS and maximum consecutive wet and dry days from the control 1971–2000 period were calculated. It must be noted that climate models are known to overestimate the number of rainy days of low intensity. This overestimation is attributed to phase errors of rainfall amount, and the peak time of the simulated rainfall intensity, as reported by Choi et al (2015), Prein et al (2015), Salih et al (2018) and Otieno et al (2019). Therefore, the results from this study on the intra-seasonal rainfall characteristics are interpreted with this information in mind.
The robustness of the climate change signal is fulfilled when the following conditions are satisfied.
- (1)Signal to noise ratio (SNR), which is defined as the ratio of the mean to the standard deviation of the differences between the climatology and the future periods, exceeds 1 (Collins et al 2013). SNR is a measure of the strength of the climate change signal.
- (2)The difference between the means of the control and future periods is significant at 5% level using the Student t-test.
Finally, we used box plots to assess the onset/cessation spread of the ensemble models for historical and future time periods, in the three sub-domains, shown in supplementary figure S1 available online at stacks.iop.org/ERL/15/034037/mmedia.
4. Results and discussion
We first evaluate the ability of the model to reproduce the onset/cessation over the region. It is shown that the CORDEX ensemble is able to reproduce the onset and cessation over the region for all three seasons (supplementary figures S3–S5). The white regions within the GHA region in figures 2–4 and 7–10 show areas that normally do not receive substantial rainfall during the season considered using the criterion discussed in the supplementary information (see section Methods). The impact of the different warming periods for the GCMs on the onset over the GHA region is investigated and it is found that different warming periods did not have a statistically significant influence on the onset results of the ensemble mean as shown by the results from statistical test in supplementary table 1.

Figure 2. GHA CORDEX ensemble mean for MAM onset and cessation for 1971–2000 (CTL, (a), (e)), the projected changes at the 1.5 °C and 2 °C GWLs with respect to the control period (b), (c), (f), (g) and the difference between the changes at 2 °C and 1.5 °C GWLs (d), (h). Statistically significant areas are marked by backward slashes (\\\) and those with a signal to noise ratio greater than 1 are indicated by forward slashes (///).
Download figure:
Standard image High-resolution image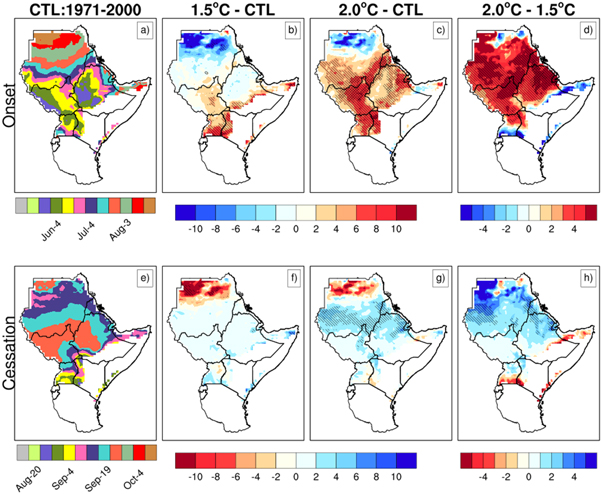
Figure 3. Same as figure 2 but for JJAS.
Download figure:
Standard image High-resolution image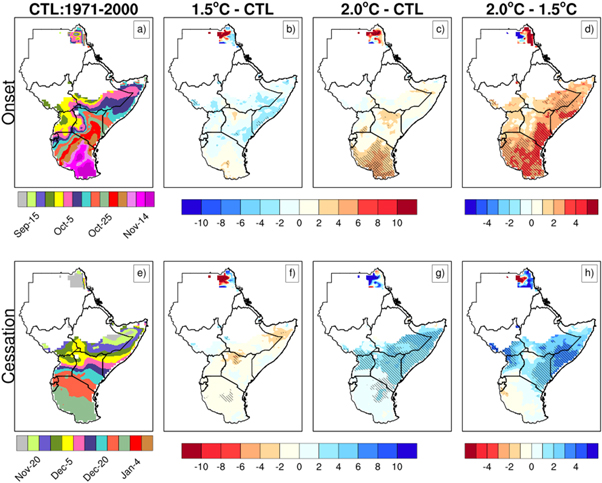
Figure 4. Same as figure 2 but for OND.
Download figure:
Standard image High-resolution image4.1. Projected changes in onset and cessation
4.1.1. March to May
Historically the MAM rainfall onset progresses northwards from Tanzania to Ethiopia, due to the movement of the Intertropical Convergence Zone (figure 2(a)). Global warming is projected to have different responses in mean onset dates over the region during the MAM season. While onset is projected to be early over eastern parts of Tanzania and Kenya, it is projected to be delayed over parts of Ethiopia and South Sudan (figures 2(b), (c)). The changes in mean onset dates, that is early (delayed), are up to 6 d (8 d) for both GWLs. These changes are statistically significant at both GWLs, especially over parts of Ethiopia, South Sudan, and Tanzania. There are marginal differences in mean onset dates due to an additional 0.5 °C of warming from 1.5 °C GWL (figure 2(d)).
Compared to mean cessation dates for the control period (figure 2(e)), early cessation is projected to occur over most parts of the region under both GWLs (figures 2(f)–(g)). Statistically significant changes of up to 6 d are projected over Djibouti, Ethiopia, Burundi, Rwanda, Tanzania and Kenya at the 1.5 °C, and over parts of Kenya, Ethiopia, South Sudan, Uganda and Tanzania at 2 °C GWL. The difference in mean cessation dates at 1.5 °C and 2 °C GWLs is statistically significant over South Sudan and southwestern Ethiopia (figure 2(h)).
These results are consistent with Dunning et al (2018) who found that CMIP5 models over the equatorial region projected early-onset and cessation. Onset over equatorial East Africa is linked to the 700 mb zonal winds, the Madden Julian Oscillation, and sea surface temperature in the western Indian Ocean (Camberlin and Okoola 2003, Pohl and Camberlin 2006, Zaitchik 2017, Wainwright et al 2019). It is projected that in the future the MJO precipitation amplitude will increase (Maloney et al 2019), thus affecting the rainfall onset, in this case leading to early-onset. In addition, the western Indian Ocean is projected to be warmer (Endris et al 2019, Wainwright et al 2019) hence we postulate that this could be a driver of projected early onset.
One of the major drivers of cessation over the equatorial region is the Somali jet (Camberlin et al 2010). It is projected that the Somali jet will strengthen in the future, (Zou and Zhou 2015, Wainwright et al 2019) thus in agreement with Wainwright et al (2019) we postulate that this could be one of the drivers of early cessation over the equatorial region. The dipole observed in figures 2(d) and (h), can be attributed to the trapping of ITCZ over eastern Africa by the Saharan heat low, which is projected to strengthen (Dunning et al 2018).
4.1.2. June to September
The JJAS onset dates historically occur from late-May over parts of the equatorial region, gradually progressing northwards to Sudan (figure 3(a)). Compared to the control period, early onset is projected over western parts of Ethiopia and most parts of Sudan at the 1.5 °C GWL. While over western Kenya, Uganda, parts of Ethiopia and South Sudan onset is projected to be late (figure 3(b)). In contrast, under the 2 °C GWL, the region is projected to have delayed onsets (figure 3(c)). Onset delays of over 6 d under the 2 °C GWL are robust over Djibouti, parts of Eritrea, Ethiopia, Sudan, and South Sudan. The delay in the onset with an additional 0.5 °C of warming from 1.5 °C level is more than 4 d over most of the region except southern Uganda where the onset is projected to be early by 3 d (figure 3(d)). The difference in the mean onset between the 1.5 °C and 2 °C GWLs is robust over parts of Ethiopia (figure 3(d)) and statistically significant over South Sudan and Sudan.
Mean cessation for JJAS (figure 3(e)) season is projected to occur later than the mean cessation of the control period at both GWLs (figures 3(f), (g)). Changes in the cessation dates are prolonged by up to 6 d at the 2 °C GWL. Additional delays of up to 4 d are projected in the mean cessation date under 2 °C GWL compared to 1.5 °C GWL (figure 3(h)). During this season, under the 2 °C GWL, the region is projected to have a season that starts and ends later consistent with findings from Dunning et al (2018).
The delays in the onset over the northern part of the GHA have been attributed to the strengthening of the Saharan heat Low (Cook and Vizy 2012, Dunning et al 2018). The JJAS season onset variability has also been linked to the West African and Indian Ocean monsoons (Segele and Lamb 2005). The Saharan heat low that is projected to strengthen in the future is likely to weaken the West African monsoon, thus delaying the onset over the northern sector of the region. The strengthening of the Saharan heat low is likely to affect the reversal of the monsoonal winds and the southward movement of the ITCZ thus delaying the cessation over the northern sector of the region.
4.1.3. October to December
During the OND season, projected changes in mean onset dates from the control period (figure 4(a)) are over southern Tanzania, coastal Kenya, southern Somalia, and South Sudan at 1.5 °C GWL (figure 4(b)). At the 2 °C GWL, mean onsets over most parts of the region are projected to be delayed with robust changes over the southern parts of Tanzania, where onset will likely be delayed by 4–8 d (figure 4(c)), consistent with Saeed et al (2018). The difference in the mean onset between the 1.5 °C and 2 °C GWLs is statistically significant and delayed by at least 3 d over the southern and the coastal lowlands of the region.
At the 1.5 °C GWL, statistically significant delayed cessation relative to the control cessation dates (figure 8(e)) are projected over parts of Tanzania, Kenya and Somalia (figure 4(f)). Under the 2 °C GWL, widespread statistically significant delayed cessation is projected over the equatorial regions from Uganda to Somalia (figure 4(g)). The extra 0.5 °C warming from 1.5 °C will likely prolong OND withdrawal over Uganda, Kenya and Somalia (figure 4(h)). In a study utilising the CMIP5 models for the late 21st century, Dunning et al (2018) found similar results of late-onset and delayed cessation as with the 2 °C GWL.
In the future it is projected that the ITCZ will stay longer in the northern hemisphere during the southern hemisphere winter due to strengthening of the Saharan heat low hence delaying the onset over the equatorial sector during the OND season. Rainfall during this season has mostly been attributed to the Indian Ocean Dipole and the El Niño Southern Oscillation. Dunning et al (2016) reported that cessation for the OND season is 7 d later in El Niño years and 5 d earlier in La Niña years with only a small change in onset dates. A study by Endris et al (2019) found that the frequency and intensity of ENSO events are likely to increase for the period 2070–2099 thus the late cessation could be caused by the increased El Niño events.
4.1.4. Spread in onset and cessation analysis for CORDEX ensemble members
The spread of all CORDEX RCMs in simulating onset and cessation of rainfall during the three seasons considered was conducted using box plots. The regions used for the analysis are shown in supplementary figure 1. The spread of rainfall onset dates is relatively wider for both MAM and JJAS seasons compared to OND season (figure 5). During the MAM season, the spread in model onset dates increases, with the 2 °C GWL having the largest spread. However, there are no discernible changes in the mean onset dates. Clearly, the simulated mean onset date during the JJAS season for the 2 °C warming period is projected to be late. The JJAS spread changes slightly for historical and the different GWLs. During the OND season, although differences in mean onset dates are small, for the different time periods, onset variability is projected to be large at the 1.5 °C GWL compared to that for historical runs and 2 °C GWL. On the other hand, the spread for the 2 °C GWL is comparable with that for historical simulations but the mean onset date is slightly delayed.
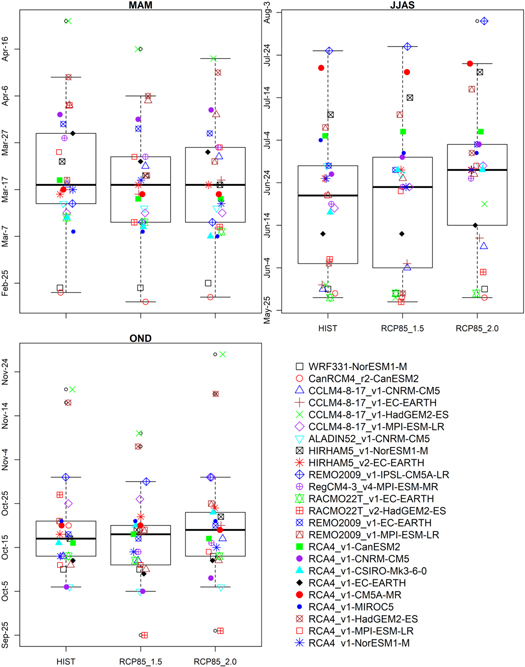
Figure 5. Onset date ranges from all the CORDEX RCM simulations used in the study for the historical period (left), and 30 year periods around the 1.5 (centre) and 2 °C (right) GWLs for the three-season considered.
Download figure:
Standard image High-resolution imageFor cessation, the results show that MAM season still has relatively large model spread compared to the other two seasons (figure 6). The spread is largest at the 2.0 °C warming level. Compared to rainfall onset during JJAS season, the spread in cessation dates is relatively narrow even though some models (all driven by HadGEM2-ES) simulate extremely early cessation dates. During OND season, the spread in the cessation of rainfall dates is comparable to the onset dates. The consistency of models driven by HadGEM2-ES model to simulate either extreme early and/or late-onset underscores the importance of boundary condition in downscaling climate information to regional scales
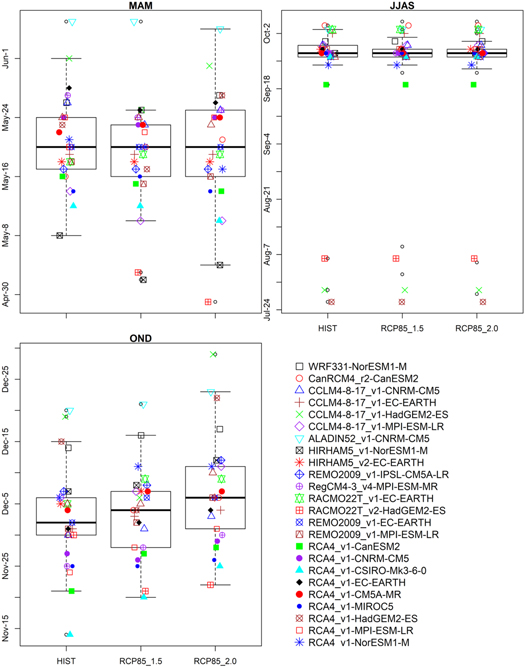
Figure 6. As in figure 5 but for Cessation.
Download figure:
Standard image High-resolution imageOnset dates have been found to be more variable than the cessation due to a wetter land surface at the end of each rainy season, which provides positive feedback on the atmosphere; this dampens remotely forced variations, whereas for the onset external forcings are stronger (Camberlin et al 2009). The model spread in both onset and cessation dates were relatively large during MAM compared to the other two seasons. This could be due to inadequate understanding of the role of different drivers of rainfall during the MAM season and the lack of skill in simulating key circulation features by GCMs such as MJO (Flato et al 2013, Nicholson 2015). Differences in the RCMs parameterisation and the driving GCM could be responsible for the spread in the models. Endris et al (2013) showed that over the region models have different biases, some models have a wet bias while some have a dry bias.
4.2. Consecutive dry and wet days within the season (CDD and CWD)
In contrast with Osima et al (2018) study for CDD/CWD which calculated these characteristics at the beginning of the defined month to the end of the month of the season in consideration, for example, the MAM season was defined between the 1st of March to the 31st of May. In this study, CDD and CWD are calculated between the onset and cessation. CDD and CWD are linked to the variability of the Madden Julian Oscillation during the MAM and OND seasons (Berhane and Zaitchik 2014). The mean CDD is projected to increase over parts of South Sudan, Uganda and Western Kenya and the mean CWD are expected to decrease during the MAM season (figure 7). Decreases in CWD are statistically significant over parts of Ethiopia, Kenya, Uganda and South Sudan for both GWL. These results are slightly different from Osima et al (2018) who found an increase in CDD especially at the Turkana Jet entrance region in northwestern Kenya. The increase in CDD from Osima et al (2018) could be due to including the dry periods in their analysis. On the contrary, there was a similarity in the decrease of CWD over most parts of the GHA from both studies. In both studies, there are marginal changes in CDD and CDW from an additional half a degree of global warming.
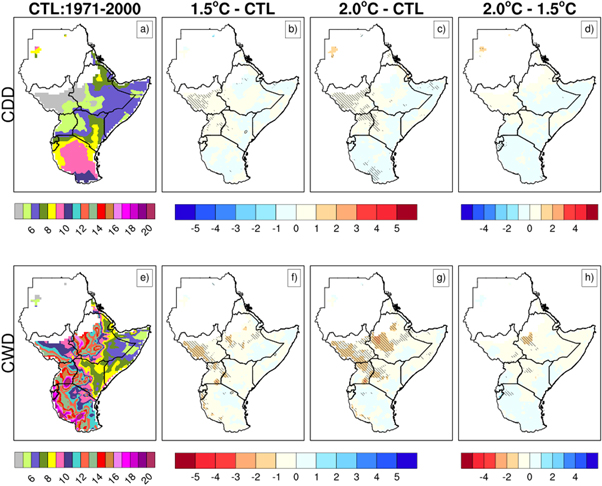
Figure 7. GHA CORDEX ensemble mean for MAM consecutive dry and wet days for 1971– 2000 (CTL, (a), (e)), the projected changes at the 1.5 and 2 °C GWLs with respect to the control period (b), (c), (f), (g) and the difference between the changes at 2 °C and 1.5 °C GWLs (d), (h). Statistically significant areas are marked by backward slashes (\\\) and those with a signal to noise ratio greater than 1 are indicated by forward slashes (///).
Download figure:
Standard image High-resolution imageFigure 8 shows the CWD and CDD during JJAS. Statistically significant increases of CDD are projected over South Sudan under 1.5 °C GWL. During this season in general CWD is projected to decrease over most parts of the northern region at both warming levels. The decrease in CWD is statistically significant over Uganda, South Sudan, Ethiopia, and Sudan. These results are consistent with results from Osima et al (2018), especially in the dipole mode pattern of decrease/increase in CDD in western Ethiopia and South Sudan during this season. Similarly, for CWD results are consistent with Osima et al (2018) especially in the projected decrease in CWD over western South Sudan and western Ethiopia under both warming levels. As observed in the MAM results, an additional 0.5 °C global warming acts to strengthen the change signals positively/negatively and this is also consistent with results from Osima et al (2018).

Figure 8. As for figure 7 but JJAS season.
Download figure:
Standard image High-resolution imageDuring the OND season, CDD is projected to slightly change under both GWL's (figures 9(b), (c)) There are marginal changes in the CDD due to an extra 0.5 °C of warming. Under 1.5 °C warming, the CWD is projected to increase over most of the region, especially the western part of the region. While under the 2 °C GWL it is expected to reduce. Statistically significant reduction in CWD is over the western parts of the region. Evidently, the different warming temperatures produce differing impacts on the CWD. In this case, half a degree of warming is projected to reduce the CWD over most parts of the region.
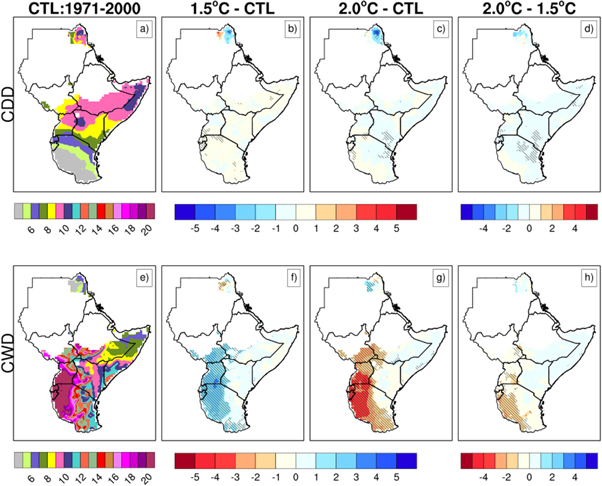
Figure 9. As for figure 7 but OND season.
Download figure:
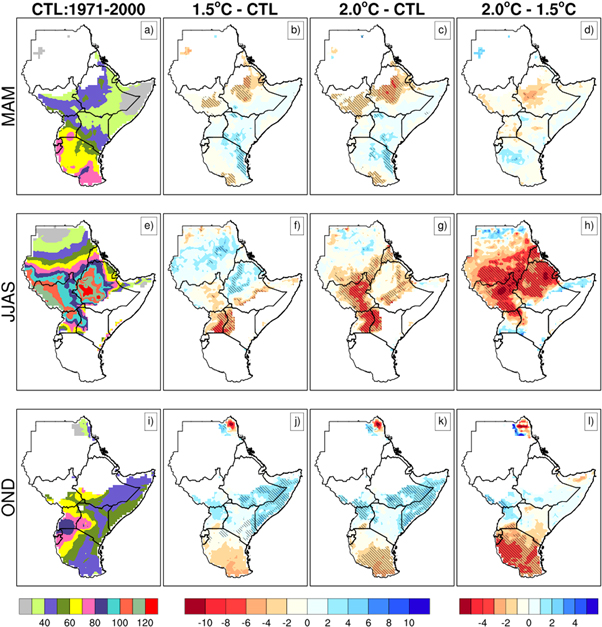
Standard image High-resolution image4.3. Length of rainy season
Figure 10 shows the mean LRS as simulated by the CORDEX models for MAM, JJAS and OND seasons and their associated projected changes. Throughout the region, the length of the rainy season ranges between 30 and 120 d (figures 10(a), (e), (i)).
Figure 10. GHA CORDEX ensemble mean for LRS in MAM (a), JJAS (e) and OND (i) for control period, the projected changes at the 1.5 °C and 2 °C GWLs with respect to the control period (b), (c), (f), (g), (j), (k) and the difference between the changes at 2 °C and 1.5 °C GWLs (d), (h), (i) for MAM, JJAS, and OND respectively. Statistically significant areas are represented by negative (\\\) slopes and those with a signal to noise ratio greater than 1 are represented by positive slopes (///).
Download figure:
Standard image High-resolution image
During MAM, statistically significant changes of reduced LRS between 2 and 4 d are projected at 1.5 °C GWL in central South Sudan, central and northeastern Ethiopia and southern Tanzania (figure 7(b)). On the other hand, coherent signals of slightly longer LRS are evident over the coastal lowlands of Tanzania and a few areas in Kenya. At the 2 °C GWL, similar spatial patterns to those at the 1.5 °C GWL are evident but with a larger spatial extent over the northern sector of the GHA (figures 10(b), (c)). Differences between LRSs at 1.5 °C–2 °C GWLs are not statistically significant (figure 10(d)). The marginal changes in LRS over the region and the early onset/cessation imply that in the future the MAM season is likely to shift and start earlier than the historical period over the equatorial region. However, South Sudan and Southern Ethiopia are projected to have a reduced season owing mostly to a late-onset. Osima et al (2018) projected reduced rainfall over the northern sector of the region, thus the reduced rainfall could be attributed to a shorter season over the northern sector of the region and reduced CWD.
Statistically significant longer LRS are projected over much of Sudan and northwestern Ethiopia at the 1.5 °C GWL during the JJAS season (figure 10(f)). However, a few areas along the Rift Valley are projected to experience a reduction in the LRS of up to 8 d. Further warming from 1.5 °C to 2 °C tends to produce drier (Osima et al 2018) and shorter LRSs compared to those at the 1.5 °C GWL. As a result, at a 2 °C GWL, the signals of reduced LRSs become more robust and the spatial extent wider over Kenya, Uganda, South Sudan, Ethiopia, and Sudan (figure 10(g)). The longer LRS signal projected at the 1.5 GWL weakens appreciably or reverses sign over Sudan and western Ethiopia (figures 10(f), (g)). Differences between LRSs at 1.5 °C and 2 °C GWL are statistically significant over most of the northern GHA (figure 10(h)). Agricultural activities are likely to be affected during this season as the CDD (CWD) will increase (reduce), LRS will also reduce and also the rainfall is projected to decrease in the future (Osima et al 2018, Endris et al 2019).
The results for OND season show dipole-like changes in the length of the rainy season over the region at both GWLs (figures 10(j), (k)). The equatorial (southern) sector of the GHA region is projected to have a prolonged (reduced) rainy season in the future at both GWLs. Over these areas, the changes in LRS are higher and statistically significant at the 2 °C GWLs. It is worth mentioning that these dipole-like signals have also been identified by Endris et al (2019) for the same season however a different time period. The observed dipole was attributed to the projected strengthening and weakening of ENSO/IOD relationship with rainfall anomalies (Endris et al 2019). A stronger (weaker) ENSO/IOD and rainfall anomaly relationship was found over the eastern (southern) part of the GHA explaining the different responses to GWL.
The results have shown that during the MAM season early (late) onset to the south (north) respectively suggest a less rapid northward migration of the ITCZ (figure 2). This leads to shorter LRS over the southern and northern parts of the region and longer over the equatorial sector (figure 10). Conversely for JJAS season, late (early) onset to the south (north) suggests a more rapid progression of the ITCZ (figure 3) thus in general shortening the season over the northern sector of the GHA. The ITCZ transition from north to south during OND season is also relatively less rapid as implied by the early (late) onset in the equatorial (south) of the region under the 1.5 °C GWL (figure 4). This suggests that future changes in ITCZ will play a key role in the intra-seasonal characteristics of rainfall in all seasons and therefore models need to skillfully represent this key feature. Results for LRS show that the largest changes, positive or negative, in LRS at both warming levels and in all the seasons will not exceed 10 d. This may not represent significant changes especially in agricultural application for the JJAS season since in some regions the season has up to 120 d. However, for the OND and MAM seasons these changes might negatively affect the crops. In addition the changes in LRS should be interpreted together with changes in CDD and CWD. For example, negative impacts could be experienced in regions where CDD/LRS is projected to increase/decrease respectively.
5. Conclusion
In conclusion, the results from this study have shown that CORDEX models present robust projected changes in onset and cessation, LRS and consecutive wet and dry days over some regions of the GHA. An additional 0.5 °C of warming will have differing impacts on the intra-seasonal indices considered in this study- in some regions the impact may be positive but in other regions negative further strengthening the change signals observed at 1.5 °C warming level. The results also suggest that future onset dates will be more variable compared to cessation dates. Finally, this study has shown that additional global warming of 0.5 °C will likely change the intra-seasonal rainfall characteristics over the GHA region. These changes are likely to affect the livelihoods of the communities in the region, especially the semi-arid areas. Findings from this study can hence be used as a basis for starting dialogue aimed at adapting to future climate in the GHA region, especially on issues related to food and water security should global temperatures rise well above 1.5 °C level.
Acknowledgments
This paper is a contribution of the East African Analysis group to the CORDEX-Africa programme. Computational analysis was conducted on the Cheyenne supercomputing system, Boulder Colorado, USA, using the NCAR Command Language (10.5065/D6WD3XH5). M Gudoshava and H Endris were supported by the UK Research and Innovation as part of the Global Challenges Research Fund, grant number NE/ P021077/1 (GCRF African SWIFT). Z Segele was supported by GCRF African SWIFT and the Weather and Climate Information Services (WISER) Support to ICPAC Project (W2-SIP). Data sharing is not applicable to this article as no new data were created or analysed in this study. Special thanks to all modeling groups that performed the simulations and made their data available free to the CORDEX-Africa program.