

Abstract
Global mitigation efforts remain insufficient to limit the global temperature increase to well below 2 °C. While a growing academic literature analyzes this problem, perceptions of which obstacles inhibit goal attainment and which responses might be most effective seem to differ widely. This makes prioritization and agreement on the way forward difficult. To inform prioritization in global climate policy and research agendas, we present quantitative data on how 917 experts from the IPCC and the UNFCCC perceive the importance of different obstacles and response options for achieving 2 °C. On average, respondents consider opposition from special interest groups the most important obstacle and technological R&D the most important response. Our survey also finds that the majority of experts perceives a wide range of issues as important, supporting an agenda that is inclusive in terms of coverage. Average importance ratings differ between experts from the Global North and South, suggesting that balanced representation in global fora and regionally differentiated agendas are important. In particular, opposition from special interest groups is a top priority among experts from North America, Europe and Oceania. Investigating the drivers of individual importance ratings, we find little difference between experts from the IPCC and the UNFCCC, while expert's perceptions correlate with their academic training and their national scientific, regulatory, and financial contexts.
Export citation and abstract BibTeX RIS

Original content from this work may be used under the terms of the Creative Commons Attribution 4.0 licence. Any further distribution of this work must maintain attribution to the author(s) and the title of the work, journal citation and DOI.
The academic literature describes a plethora of obstacles and corresponding response options associated with climate change mitigation [1–8]. The literature explains why emission reductions do not meet the temperature target of the Paris Agreement despite the urgency to act [9, 10], but there is no consensus over which obstacles and responses are most important [1, 11]. Given capacity constraints in political and academic systems [12, 13], it would seem valuable to prioritize obstacles and responses to allocate scarce resources in international policy (e.g. the UNFCCC) and research (e.g. the IPCC) most effectively.
To empirically inform such prioritization, we conducted a survey among experts from the IPCC and UNFCCC asking them to rate the importance of a wide range of obstacles and responses to achieving 2 °C. Because individual preferences are the basis for group preferences [14], an issue should likely be a priority for international policy and research agendas if it is perceived as highly important by the policy and research communities. We analyze first whether experts perceive certain obstacles and responses as significantly more or less important than the average rating. In a second step, we investigate drivers behind importance ratings. We find differences in perceptions by experts from different regional backgrounds and discuss potential reasons underlying these variations.
The survey
We contacted 3013 IPCC authors, contributors, and reviewers of the Fifth Assessment Report and 2236 UNFCCC country delegates from COP 19, 20, and 21. Respondents were first asked to state background information (IPCC/UNFCCC and their function therein, gender, home country, academic background, age). From the 917 respondents, the vast majority are IPCC scientists, male and from Europe or North America (see table 1). Second, two separate lists of obstacles and responses were presented and respondents were asked to: 'Please indicate—in your opinion—how important the following obstacles (responses) are to keeping global average temperature increase below 2°C.' Respondents could choose on a Likert scale from 'not' to 'extremely important' (figure 1). Table 2 indicates the 13 obstacles and 13 responses. These lists were compiled based on an assessment of the existing literature by the authors and pre-tests with selected experts (see Methods). We also gave the respondents the opportunity to indicate additional obstacles and responses in the survey (see Methods and table S1 is available online at stacks.iop.org/ERL/15/024005/mmedia).
Table 1. Sample characteristics.
| IPCC | UNFCCC | |
|---|---|---|
| Contacted | 3013 | 2236 |
| Response rate | 28% | 11% |
| Respondents identify asa | 683 | 158 |
| Both: 76 | ||
| Genderb | ||
| Male | 74% | 64% |
| Female | 25% | 36% |
| Region of home countryb | ||
| Africa | 4% | 20% |
| Asia | 9% | 16% |
| Europe | 48% | 35% |
| Latin America | 6% | 18% |
| North America | 23% | 3% |
| Oceania | 9% | 4% |
| Age | ||
| <36 | 9% | 24% |
| 36–49 | 35% | 39% |
| 50–63 | 41% | 32% |
| 64–75 | 15% | 5% |
aThe numbers are lower than the response rate as we exclude non-IPCC/UNFCCC respondents. bPercentages do not add up to 100% because not all respondents indicated the specific item.

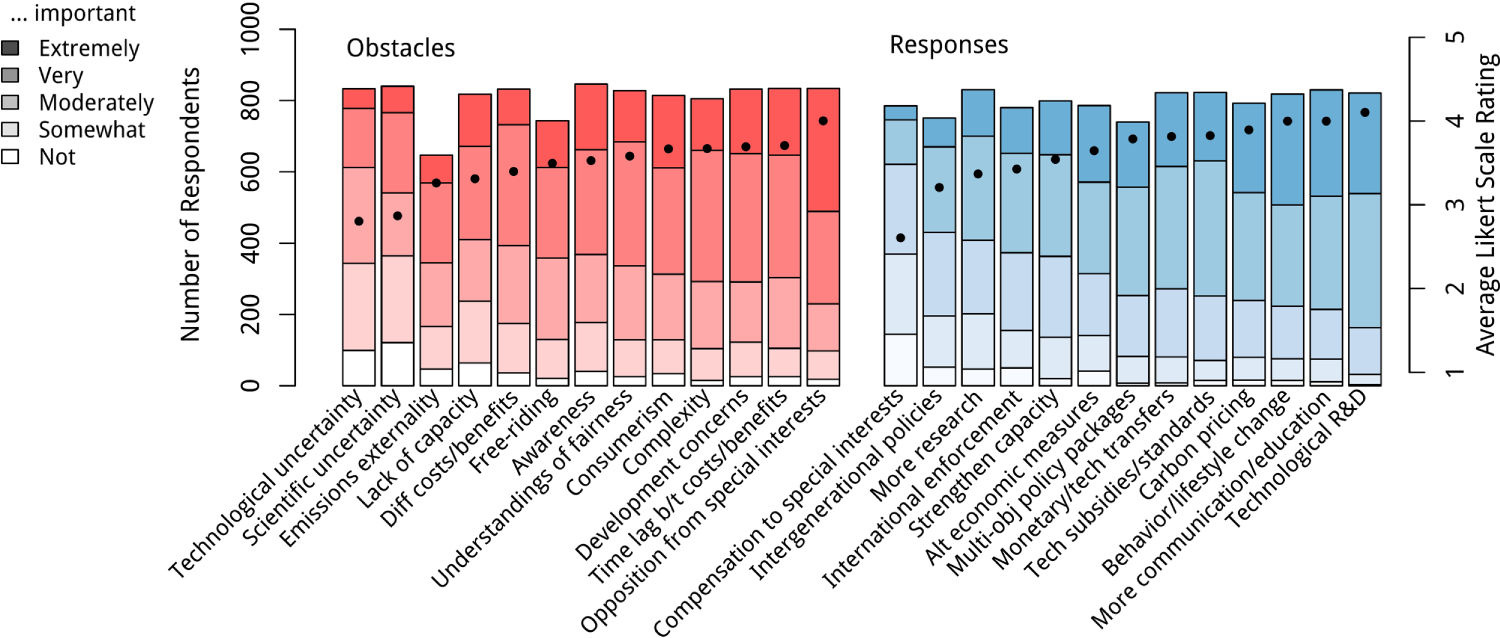
Figure 1. Number of respondents choosing each Likert scale for obstacles (red) and responses (blue). Heights in the stacked bars show how many respondents choose one of the importance ratings as opposed to not answering or choosing 'Do not Know'. For the 'Average Likert Scale Rating', importance ratings receive a numerical value from 1 (not important) to 5 (extremely important); the average across the sample is reported. Obstacles and responses are abbreviated for presentation.
Download figure:
Standard image High-resolution imageTable 2. List of 13 obstacles and 13 responses in order of appearance in the survey.
| Obstacles | Responses |
|---|---|
| (1) Uncertainty about climate change impacts or costs of mitigation | (1) More research on climate change impacts or mitigation costs |
| (2) Lack of public awareness about the magnitude of climate change impacts | (2) Intensified communication and education to build public support |
| (3) Different costs and benefits of mitigation across countries | (3) Financial and technological transfers between countries |
| (4) Time lag between costs and benefits of mitigation | (4) Compensation to special interest groups (for example, emission-intensive industries) |
| (5) Different understandings of fairness and responsibility | (5) Policies addressing intergenerational conflict (for example, appropriate discounting) |
| (6) Concerns over high mitigation costs slowing economic development | (6) Research and development for low-carbon technologies |
| (7) Uncertainty and risks about low-carbon technologies | (7) Subsidies and standards to deploy low-carbon technologies |
| (8) Negative GHG emission externality from economic activity | (8) Carbon pricing |
| (9) Consumerism in society | (9) Change lifestyles and behaviors within society |
| (10) Lack of administrative capacity for climate policy | (10) Strengthening domestic administrative capacity for climate policy |
| (11) Opposition from special interest groups (for example emission-intensive industries) | (11) Measures to enforce international emissions reductions (for example, trade sanctions) |
| (12) Global public-good nature of mitigation and free-riding incentives | (12) Applying concepts for human development other than growth of GDP |
| (13) Multitude and complexity of obstacles | (13) Coherent and multi-objective policy packages |
Results
Importance ratings across issues
Figure 1 shows the importance ratings of the entire sample. The data indicate the difficulty to identify a limited set of items that should be considered a 'priority' on global climate policy and research agendas. The majority of experts rates all items as at least 'moderately' important. Furthermore, the variation of average importance attributed to the individual items is mostly small, as measured by the 'Average Likert Scale Rating' (figure 1). For the obstacles, average importance increases steadily from 3.25 to 3.70 for the third least ('Emission externality') to the second most important item ('Time lag b/t costs/benefits'). For the responses, the seventh most important item ('Multi-obj policy packages') received only 0.3 Average Likert Scale units less than the most important response ('Technological R&D'). No clear cut-off point of low versus high importance emerges to prioritize a limited set of obstacles or responses. Even when respondents were urged to select one single item that they perceive as most important, most of them indicate that there is no single most important item (figure S1).
Yet, there is a clear difference in importance when comparing the opposite ends of the ratings, indicating that there are obstacles and responses that have a higher priority among our sample. The obstacle 'Scientific uncertainty' and the response 'Compensation to special interests' that received the lowest average importance were rated as very or extremely important by less than 40% of respondents. For the items with highest average importance, more than 70% of experts rated the obstacle 'Opposition from special interests' and the response 'Technological R&D' as very or extremely important. Moreover, the distributions of importance ratings differ significantly across issues (see Methods for a formal test).
However, prioritizing obstacles and responses based on these differences is problematic for global research and policy agendas. The next section shows that the low rating of the obstacles related to uncertainty ('Technological' and 'Scientific') and the response 'Compensation to special interests' is driven by responses from the Global North while experts from the Global South rate these items higher. Responses from the Global North also drive the higher average importance of 'Opposition from special interests'. Global agreement on low versus high priority of these items is lower than the average would suggest.
Importance ratings differentiated by background of experts
Figure 2 displays the importance ratings by organizational background, gender, academic training and region. We find that importance ratings do not differ substantially across affiliation with either the IPCC or the UNFCCC. Moreover, the gender of the respondents does not substantially influence the ratings. Male respondents rate the importance of both obstacles and responses consistently lower, which is consistent with a higher risk aversion of females [15]. However, this effect is small and ranges between 0.1 and 0.3 Average Likert Scale units.

Figure 2. Average Likert Scale ratings across different individual characteristics compared to the sample average: whether respondent is or has been IPCC author, UNFCCC country delegate or both, his or her gender, the respondents academic background and home country region (regions are based on the United Nations geoscheme M49 coding). The 'weighted sample' line is the sum of regional means weighted with their population. Obstacles and responses are abbreviated for presentation.
Download figure:
Standard image High-resolution image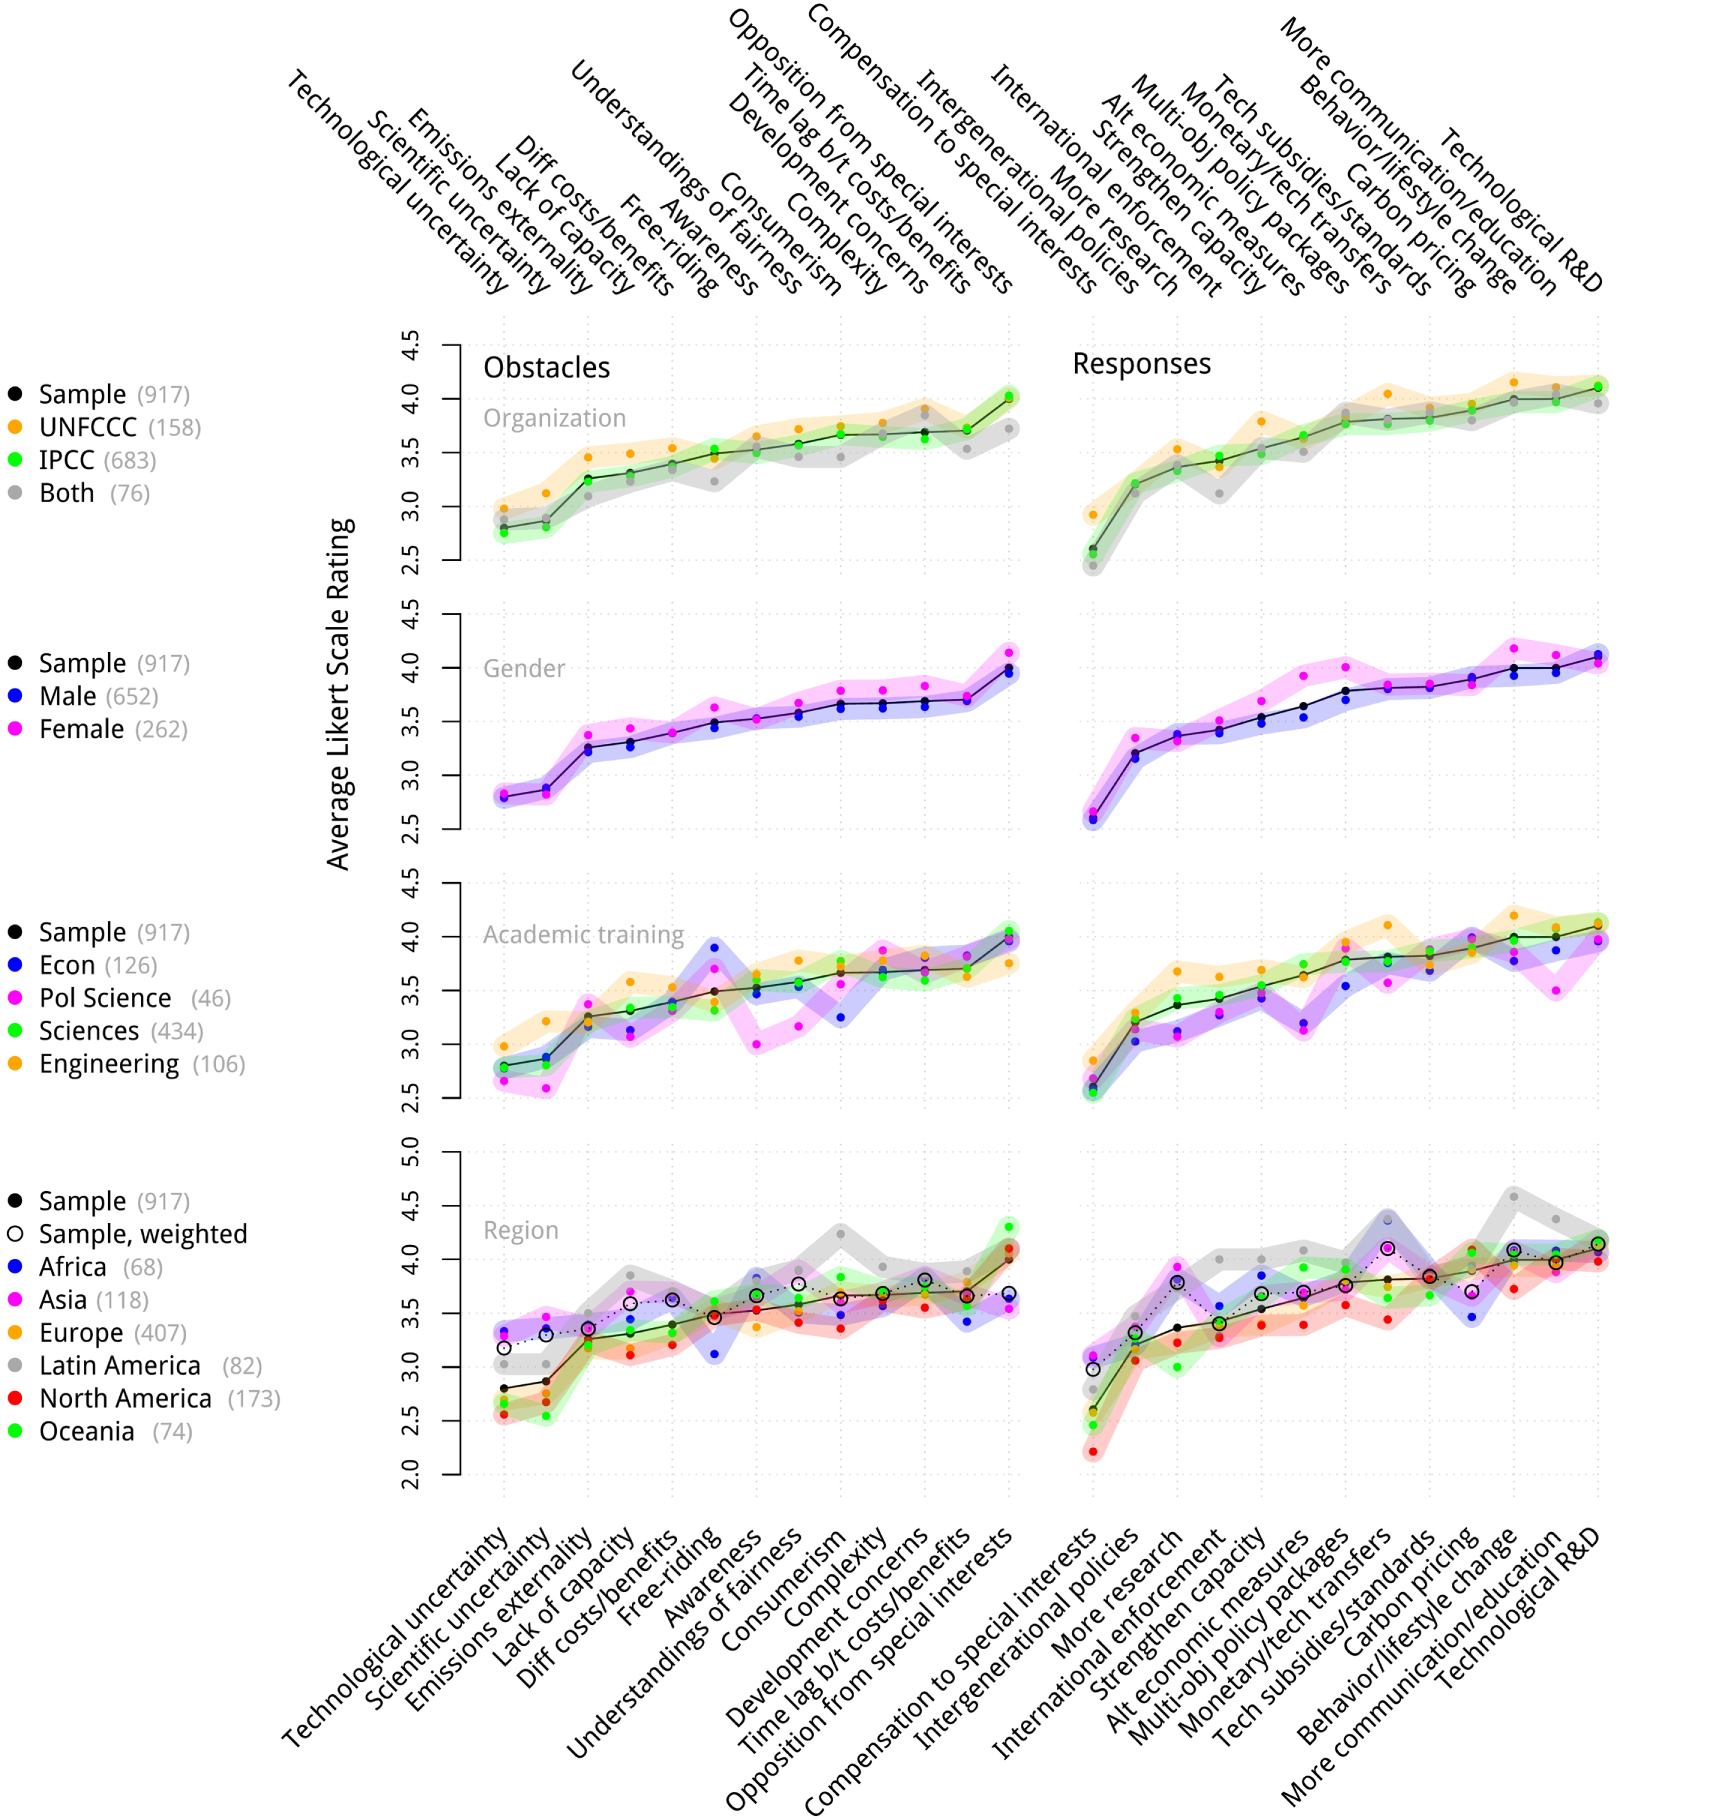
The influence of academic training on obstacle and response perceptions varies across issues. Social scientists tend to see 'Free-riding' as a more important obstacle but rate 'Consumerism' and 'Alternative economic measures' less important than natural scientists. Political scientists tend to discount the importance of 'Public awareness', 'Different understandings of fairness', and 'More communication/education' more than experts from other academic backgrounds. Natural scientists and engineers perceive 'More research' to be more important than their colleagues trained in social sciences.
The regional background of the experts influences their assessment more strongly than their academic background. In particular, we find that the substantially lower average rating of the uncertainty obstacles and the higher rating of the 'Opposition from special interests' obstacle are driven by the over-representation (relative to global population shares) of experts from the Global North in our respondents. Figure 2 shows that 'Scientific uncertainty' and 'Technological uncertainty' are perceived as less important by experts from the Global North (North America and Europe) than by experts from the Global South (Africa, Asia, and Latin America), and vice versa for the 'Opposition from special interests' obstacle. Some other items show a similar North/South divide ('Administrative capacity', 'Compensation to special interests', 'More research', 'Strengthen administrative capacity', 'Monetary and technological transfers'). There is a different regional divide between importance ratings for a few other items, perhaps most notably that experts from Latin American countries perceive 'Consumerism' and 'Behavioral/Life-style change' to be substantially more important on average.
If we extrapolate our data and adjust the regional Average Likert Scale Ratings with population weights, the difference in average importance across obstacles and responses decreases (see dotted line in figure 2). The importance of least-important items approaches the average across all issues. The obstacles 'Understandings of fairness' and 'Development concerns' would have on average the highest importance among all obstacles, but with only a small difference. For the responses, 'Monetary and technological transfers' and 'Behavioral/Life-style change' would be equally important as 'Technological R&D'. Notably, 'Technological R&D' is a top priority among experts from all regions.
We conclude that representation of experts in proportion to world region population shares would make prioritizing a limited set of issues even more difficult for global agendas. As a majority of experts perceives all items as at least 'moderately' important, and as no item is considered somewhat/not important by a majority of respondents, we also conclude that a global agenda for research and policy should consider all of them. Yet within such an inclusive global agenda some significant regional differences may persist. In particular, the 'Opposition from special interests' obstacle is a top priority for experts from North America, Europe and Oceania. We therefore now examine potential drivers of the regional variation in more detail. Understanding the underlying reasons can facilitate a targeted approach to nationally important obstacles and responses.
Regression between importance ratings and experts' backgrounds
To better understand drivers behind individual and regional variation in importance ratings, we conduct a series of ordered logistic regressions testing a range of potential explanatory variables (see Methods). We test whether characteristics of the expert's home countries are correlated with their importance ratings and could explain their choices. For some topics, like 'Consumerism' and 'Lifestyle change', little further effects beyond regional influence of Latin America can be identified. However, it turns out that the disagreement between experts on the role of science, special interests, and transfer payments may partly be explained by their diverging national experiences. We now discuss the most relevant findings:
- The higher importance given to 'Scientific Uncertainty' and 'More research' in the Global South is correlated with the size of the scientific sector in expert's home countries; less so for 'Technological uncertainty' (tables 3, 4): Experts from countries with a larger scientific sector, defined as scientific and technical journal articles per capita, tend to perceive 'Scientific uncertainty' 0.1–0.2 Likert Scale units less important and attribute 0.2–0.3 Likert Scale units less importance to 'More research' as a response. We conjecture that experts' perceptions of scientific certainty are influenced by the magnitude of the scientific community in their home country: if they are from a country with a vibrant research community, scientific certainty is perceived as more advanced and hence more research not particularly important. Including this indicator reduces the positive effect of the regional indicators of Africa, Asia, and Latin America. The influence of the size of the national scientific sector on perceived importance of technological uncertainty is similar but does not significantly reduce the effect of the regional indicators.
- The quality of government institutions in experts' home countries correlates with how important they perceive 'Opposition from special interests' (tables 3, 5): Experts from countries with effective government institutions tend to perceive 'Opposition from special interests' to be a less important obstacle (by 0.1–0.32 Likert Scale units), albeit with low statistical significance, and consider 'Compensation of special interests' as a less important solution (0.42–0.53 Likert Scales units). We suspect that countries with effective government institutions suffer less from corruption and lobbyism and experts from those countries are hence less likely to experience special interest influence on government policy. Moreover, experts from those countries may have experienced that alternative strategies to compensating polluters are politically feasible. Next to the quality of governance institutions, market-liberal cultures (0.25–0.31 Likert Scales units) reduce the importance experts attribute to the 'Compensation of special interests', which might be in line with the prevailing approach to regulation that would foresee less compensatory policies by the state.Some regional tendencies persist: the North/South divide for the special interest obstacle remains after controlling for governance and economic culture. Asian experts rate compensation more important and North American ones less important.
- Experts from lower-income countries tend to rate 'Monetary and technological transfers' more important, and so do experts from Africa, Asia, and Latin America (table 4): experts from wealthier countries tend to perceive 'Monetary and technological transfers' to be a less important response (by 0.15 Likert Scale units). However, when controlling for regional variables, this effect diminishes and regional influences prevail: African, Asian, and Latin American experts tend to perceive transfers to be more important than their colleagues from Europe, North America, and Oceania. This regional pattern follows the traditional donor/recipient pattern within the UNFCCC. The pattern may on the one hand arise out of local experience, as experts from low-income countries tend to be more exposed to the difficulties that arise from the lack of finance and technologies. On the other hand, system-justification bias may further influence experts' perceptions: as technology and monetary transfers positively affect lower-income countries and generate costs for higher-income countries, experts from high-income countries are likely to perceive them as less important [16].
Discussion and conclusion
Our survey shows that any two experts may disagree substantially in how far an obstacle is important for climate change mitigation, and on the importance of corresponding response options. We find that the academic background of experts influences their importance ratings. Perhaps most strikingly, political scientists tend to discount the importance of a lack in awareness of the climate change problem as an obstacle and of more communication and education as a response to the challenge. More importantly, we find that importance ratings differ substantially with the regional background of experts. While diverging perceptions have been described as a challenge in previous literature [1], our quantitative data point to how progress in climate agenda setting can be achieved.
First, global agendas for climate research and policy should be inclusive and not prioritize strongly. We observe that most obstacles and responses are perceived as important on average and all of them are at least moderately important for the majority of respondents. An inclusive agenda would take into account the diverging views of stakeholders and thereby enable wide support. The Paris Agreement with its wide range of topics covered can be seen as an example of using an inclusive approach. In this respect, our observations underpin that the broad scope of the Paris Agreement is justified in the perspective of research and policy expert groups. To achieve such an inclusive agenda, linking topics can be a successful strategy. Our data present a North–South divide in prioritizing issues that would need to be balanced. Countries of the Global North may perceive the science of climate change as settled and discount its importance as an obstacle. Countries of the Global South that exhibit a smaller scientific sector may emphasize the need for more research. In a package deal, a global agenda could allow for resources to be allocated to the science behind climate change and its mitigation in the Global South. The agenda would in turn need to include the obstacle of opposition from special interest groups that is perceived as particularly important by experts from the Global North. For responses, international monetary and technological transfers are a top priority in the Global South. To include this issue, the Global South may consent to putting carbon pricing on the agenda as well, which is more important in countries of the Global North.
Second, our data highlight the importance of equal representation. Global agenda setting needs to be well designed to balance substantial disagreement between stakeholders. Here, an equal voice of all stakeholders is a critical issue. At first glance, broad participation in discussions may render prioritizing a limited set of issues more difficult. On the other hand, broad participation pushes the importance of all items so that an inclusive agenda can emerge. In this regard, the integrative communication of the French presidency at COP21 in Paris has been described as a critical ingredient for the successful negotiations that lead to the Paris agreement [17, 18]. Especially in light of the failed negotiations at COP15 in Copenhagen, the Paris agreement was negotiated under broad international participation, resulting in almost global endorsement of the deal. Such an integrative approach could therefore also be a fruitful strategy for setting the research agenda within the IPCC.
Third, technological research and development stands out. This response is perceived as particularly important by almost all experts. We conclude that it should be among the top priorities. Opposition from special interest groups appears as the most important obstacle to achieving the 2 °C target. The average importance rating of this item substantially exceeds that of even the second most important obstacle, driven by responses from the Global North. Addressing opposition from special interests seems imperative, particularly in North America, Europe and Oceania. However, the response of compensating special interest groups received the lowest rating, also particularly in countries of the Global North. Our data does not allow further investigating the reasons behind expert perceptions. Therefore, we do not know if compensation to special interest groups is rated low because experts believe it is ineffective or, for example, because they believe it is morally unjustifiable. Enhanced research and political focus on understanding and responding to this obstacle is important.
Lastly, next to recommendations for global agendas, our data highlight the importance of regionally targeted agendas. In countries of the Global North opposition from special interest groups and carbon pricing are a top priority that may be tackled, at least partially, on a regional scale. Strengthening science and institutional capacity are more important for agendas in the Global South.
Methods
Sample
We collected all names of contributors to the IPCC's Fifth Assessment Report from Annex I of the report. Out of the 3562 experts listed (not unique), we distributed the survey to 3013 unique contacts for whom E-mail addresses were obtained. Hence, our contact list is nearly complete for the IPCC scientists.
Contacts for the UNFCCC country delegates were derived from the COP 19, 20, and 21 participant lists. We distributed the survey to 2236 unique contacts for whom E-mail addresses could be found online. The lists of participants encompasses 21647 names (not unique), meaning our contact list is not complete and may be subject to a bias for experts that provided an E-mail address online.
The response rate was 28% for IPCC scientists and 11% for UNFCCC experts, hence our results may be subject to non-response bias. In addition, the survey was only available in English. While a language barrier is not likely to lead to a bias in responses for IPCC scientists (as the IPCC reports are in English), UNFCCC experts may not have responded to the survey due to a lack in English proficiency.
Detailed survey design
The survey was conducted using Survey Monkey. Respondents were informed on the first page about the scope of the survey and that they were not required to answer all of the questions.
The next two pages asked respondents to indicate:
- 1.Whether she or he is an (i) IPCC author, contributor, or reviewer (ii) an UNFCCC country delegate (iii) both or (iv) other (participants who clicked other or nothing were excluded from the analysis).
- a.Experts from the IPCC were asked to indicate their working group and their role as (i) Coordinating Lead Author, Lead Author, Review Editor or (ii) Contributing Author.
- b.Experts from the UNFCCC were asked which country delegation they belonged to and their role therein (Party, Observer, etc).
- 2.Their home country.
- 3.Their educational background, with the following options: Physical and Natural Science, Engineering, Mathematics, Geography, Economics, Political Science, Law, Medicine, Arts and Design, History, Humanities, Other.
- 4.Their age group, with the following options: 35 or younger, 36–49, 50–63, 64–75, 76 or older.
- 5.Their gender: male, female, or other.
On the next page respondents were asked to take a moment to consider the questions:
- 1.What—in your opinion—is the most important obstacle to keeping the global average temperature increase below 2 °C.
- 2.What—in your opinion—is the most important response option to keeping the global temperature increase below 2 °C.
The next page presented the 13 obstacles, and respondents could choose one of the Likert scales: not—somewhat—moderately—very—extremely important, or 'Do not know'. Respondents were then asked to choose one of the 13 obstacles as the one they perceived as 'most important' or indicate that they do not consider there to be a 'most important'. Additionally, they could report an obstacle that they perceived to be more important than any of the above but was not included.
The pages for the responses were structured equivalently.
Lastly, we asked respondents to indicate how confident they are that the world can keep global average temperature increase below 1.5 °C, 2 °C, and 3 °C. They could choose from very low to low, medium, high, and very high confidence.
Selection of obstacles and responses
We compiled the list of obstacles and responses based on a survey of existing literature and expert interviews. The initial selection of items was based on an extensive reading of central literature, for example [2, 3, 19] as well as the Fifth Assessment Report of the IPCC [20]. Items were refined through an iteration with selected experts from science, the IPCC, and the UNFCCC as well as three test runs of the survey.
The importance of individual items was confirmed by the rating of experts. In order to control whether we left out important obstacles or responses we allowed individual answers on issues that were not included in our list (see above). Table S1 reports a categorization of the most common answers. It shows that there is a wide range of items that we did not include, which hints at the difficulty of defining a comprehensive list. As an example, we had previously incorporated 'Lack of political will' in our list of obstacles, which was mentioned by our respondents most often to be lacking. We chose to drop it to keep the list brief and the vagueness of the concept.
Software and statistical methods
The data were analyzed and figures prepared with the R software package [21].
To test the hypothesis that some obstacles or responses are more or less important than the average, we performed a Chi-Squared test on the relative frequencies derived from the histograms. First, the relative frequencies of Likert scale ratings were calculated for each individual obstacle and response. The Chi-Squared test in R was used to test whether these relative frequencies are significantly different from the average relative frequencies of all obstacles and all responses, respectively. The null-hypothesis that there is no significant difference between a single obstacle's or response's distribution and the respective average distribution is rejected with p-values below 0.001, except for the obstacle 'Awareness' and the response 'Alternative economic measures', which are very close to the average frequencies.
The relationship between the respondents characteristics and their Likert scale ratings were estimated with an ordered logistic regression, for which details can be found in [22, 23]. The 'polr'-package was used in R to estimate the coefficients and intercepts [24]. The 'ocME'-package calculated the marginal effects at the mean of the sample. For the individual obstacle or response, the five marginal effects estimate the change in probability of choosing each of the five Likert scales when changing the corresponding explanatory variable (holding the other variables fixed). To enable comparison, we constructed a single numerical value from these five marginal effects that is reported in tables 3–5. The marginal effect on each Likert scale was multiplied by the numbers 1 to 5 in their respective order and then summed up. A reported value of '1.00' therefore states that increasing the explanatory variable by 1 (holding the other variables fixed), increases the expected Average Likert Scale rating by 1.00 units. The standard errors and p-values were calculated using the Delta-method.
Table 3. Ordered logit regression for explaining variation in rating obstacles, reported numbers are the effect of changing the respected variable on the expected Average Likert Scale rating; p-value: . <0.1, * <0.05, ** <0.01, *** <0.001 (see Methods)
| Scientific uncertainty | Technological uncertainty | Opposition from special interests | ||||||||
|---|---|---|---|---|---|---|---|---|---|---|
| 1 | 2 | 3 | 1 | 2 | 3 | 1 | 2 | 3 | 4 | |
| UNFCCC | 0.17 (0.13) | 0.16 (0.13) | 0.22. (0.12) | 0.01 (0.11) | 0 (0.11) | 0.09 (0.11) | 0.01 (0.1) | 0.18. (0.1) | 0.13 (0.1) | 0.07 (0.11) |
| Political Science | −0.28 (0.19) | −0.28 (0.19) | −0.29 (0.19) | −0.1 (0.16) | −0.1 (0.16) | −0.11 (0.17) | ||||
| Male | 0.06 (0.09) | 0.06 (0.09) | 0.09 (0.09) | −0.06 (0.08) | −0.06 (0.08) | −0.02 (0.08) | −0.22** (0.08) | −0.23** (0.08) | −0.23** (0.08) | −0.26** (0.08) |
| Confidence in 2 degree | −0.04 (0.04) | −0.03 (0.04) | −0.04 (0.04) | −0.09** (0.03) | −0.08** (0.03) | −0.08** (0.03) | ||||
| Age | 0.08. (0.04) | 0.08. (0.04) | 0.08. (0.04) | 0.09* (0.04) | ||||||
| GNI | −0.04 (0.06) | 0.03 (0.07) | 0.12. (0.06) | |||||||
| Size of Science in Country | −0.09 (0.08) | −0.2*** (0.04) | −0.03 (0.07) | −0.18*** (0.04) | ||||||
| Economic Freedom | −0.07 (0.13) | |||||||||
| Government Effectivness | −0.32. (0.18) | −0.1 (0.16) | ||||||||
| Africa | 0.54** (0.16) | 0.34 (0.23) | 0.64*** (0.15) | 0.57** (0.21) | −0.54* (0.25) | −0.77** (0.26) | ||||
| Asia | 0.72*** (0.14) | 0.57** (0.19) | 0.59*** (0.13) | 0.56** (0.17) | −0.57** (0.2) | −0.65*** (0.18) | ||||
| Latin America | 0.21 (0.16) | 0.03 (0.22) | 0.29* (0.14) | 0.23 (0.2) | −0.15 (0.18) | −0.2 (0.19) | ||||
| North America | −0.09 (0.11) | −0.11 (0.12) | −0.17. (0.1) | −0.17. (0.1) | 0.07 (0.1) | 0.04 (0.1) | ||||
| Oceania | −0.19 (0.15) | −0.14 (0.16) | −0.04 (0.14) | −0.02 (0.14) | 0.29* (0.14) | 0.25* (0.12) | ||||
Table 4. Ordered logit regression for explaining variation in rating responses, reported numbers are the effect of changing the respected variable on the expected Average Likert Scale rating; p-value: . <0.1, * <0.05, ** <0.01, *** <0.001 (see Methods).
| More research | Monetary/tech transfers | |||||
|---|---|---|---|---|---|---|
| 1 | 2 | 3 | 1 | 2 | 3 | |
| UNFCCC | −0.02 (0.11) | −0.05 (0.11) | −0.03 (0.11) | 0.09 (0.1) | 0.1 (0.1) | 0.21* (0.1) |
| Political Science | −0.23 (0.18) | −0.23 (0.18) | −0.24 (0.18) | −0.29. (0.16) | −0.32* (0.16) | −0.34* (0.16) |
| Nat Sciences | 0.18* (0.08) | 0.19* (0.08) | 0.17* (0.08) | |||
| GNI | 0 (0.05) | −0.15*** (0.04) | ||||
| Size of Science in Country | −0.2** (0.07) | −0.29*** (0.04) | ||||
| Africa | 0.65*** (0.14) | 0.21 (0.2) | 0.62*** (0.1) | 0.6*** (0.16) | ||
| Asia | 0.78*** (0.11) | 0.44** (0.16) | 0.4*** (0.1) | 0.3* (0.14) | ||
| Latin America | 0.52*** (0.13) | 0.1 (0.2) | 0.68*** (0.1) | 0.58*** (0.13) | ||
| North America | −0.03 (0.1) | −0.07 (0.1) | −0.26** (0.09) | −0.26** (0.09) | ||
| Oceania | −0.23 (0.14) | −0.11 (0.15) | −0.1 (0.12) | −0.15 (0.12) | ||
Table 5. Ordered logit regression for explaining variation in rating response, reported numbers are the effect of changing the respected variable on the expected Average Likert Scale rating; p-value: . <0.1, * <0.05, ** <0.01, *** <0.001 (see Methods).
| Compensation to special interests | |||||
|---|---|---|---|---|---|
| 1 | 2 | 3 | 4 | 5 | |
| Political Science | 0.13 (0.18) | 0.14 (0.18) | 0.12 (0.18) | 0.14 (0.18) | 0.12 (0.18) |
| Male | −0.15. (0.09) | −0.17. (0.09) | −0.13 (0.09) | −0.18* (0.09) | −0.15 (0.09) |
| Age | 0.11* (0.05) | 0.12* (0.05) | 0.09* (0.05) | 0.12* (0.05) | 0.11* (0.05) |
| Carbon Intensity | −0.02 (0.11) | −0.2** (0.06) | −0.08 (0.1) | −0.21** (0.06) | |
| Economic Freedom | −0.25* (0.11) | −0.31** (0.09) | |||
| Government Effectivness | −0.53** (0.16) | −0.42*** (0.1) | |||
| Africa | 0.51** (0.15) | 0.08 (0.24) | 0.41* (0.2) | ||
| Asia | 0.52*** (0.13) | 0.22 (0.16) | 0.36* (0.15) | ||
| Latin America | 0.13 (0.14) | −0.32. (0.18) | −0.1 (0.16) | ||
| North America | −0.42*** (0.1) | −0.38* (0.17) | −0.26 (0.17) | ||
| Oceania | −0.17 (0.14) | −0.13 (0.17) | −0.01 (0.18) | ||
We prepared an extensive list of explanatory variables in our initial explorative analysis. The full set of variables was:
- (1)Dummy variables: 'UNFCCC', 'Physical or Natural Science', 'Economist', 'Male', 'North Africa', 'Sub Sahara Africa', 'Africa', 'Latin America', 'North America', 'Eastern Asia', 'South East Asia', 'Southern Asia', 'Asia', 'Western Asia', 'Eastern Europe', 'Northern Europe', 'Southern Europe', 'Western Europe', 'Europe', 'Oceania'.
- (2)Numerical variables: 'GNI', ' Confidence in 2 degree ', 'Age', 'Awareness of climate change', 'Climate Change Performance Indicator', 'Size of Science in the Country', 'Climate Vulnerability', 'Carbon Intensity', 'Economic Freedom', 'Government Effectiveness'.
The section 'Data Sources' in the Supplementary information defines the explanatory variables and their sources for those variables that are included in tables 3–5.
The explanatory variables 'Age' and 'Confidence in 2 degree' were converted to a numerical scale. For 'Age' the five groups and for 'Confidence in 2 degree' the five confidence levels (see previous section) were substituted for a number from 1–5 in corresponding order.
For the regressions, the explanatory variables below were scaled in the following way: Over the range of values available over all countries (counting each country one time), the difference between 20% and 80% percentile were used as a normalization of values in our data. For the following variables this is the difference between:
- GNI: Pakistan and Portugal.
- Size of Science in Country: Bolivia and Hungary.
- Carbon Intensity: Singapore and United States.
- Economic Freedom: Egypt and Colombia.
- Government Effectiveness: Angola and Germany.
We fitted our regression models so that they maximize explanatory power in terms of R square as well as in terms of explanatory meaning. To select the explanatory variables in tables 3–5, we followed the following procedure. We estimated the change in Likert scale ratings with both the ordered logistic regression and an OLS regression on the numerically converted Likert scales (giving each Likert scale a number from 1 to 5 in the corresponding order). Both methods delivered very similar effects. To choose between the explanatory power of models, we proceeded with the OLS regression. We programmed a script that would automatically fit models with the highest explanatory power in terms of R square. Based on these suggestions we excluded all model variations with substantial multicollinearity and discussed and selected the model variations in terms of their meaning. In cases where variables where statistically linked but could not be explained by the literature or any reasonable explanation, we exchanged the variable with another correlated variable that could better explain the item. We excluded all variables which did not influence the outcome (threshold 0.1 Average Likert Scale units) even when they furthered the R square. To discuss the effects in the main text, the results of the ordered logistic regression are reported.
Acknowledgments
The authors would like to thank Max Callaghan for help with retrieving expert information and Elke Weber, Anita Engels and Frank Jotzo for reviewing earlier versions of the paper. We also thank two anonymous referees for their comments.
Data availability
The data that support the findings of this study are available from the corresponding author upon reasonable request.