

Abstract
Dust storms are common meteorological events in arid and semi-arid regions, particularly in Southwest Iran (SWI). Here we study the relation between drought events in Iraq and dust storms in SWI between 2003 and 2018. The HYSPLIT model showed that central and southern Iraq are the main dust sources for SWI. Mean annual aerosol optical depth (AOD) analysis demonstrated that 2008 and 2009 were the dustiest years since 2003 and there is an increased frequency of summertime extreme dust events in the years 2008 and 2009. The Standardized Precipitation Evapotranspiration Index revealed that drought in Iraq significantly affects dust storms in Iran. Similarly, dramatic desiccation of Iraq wetlands has contributed to increasing fall dust events in SWI. AOD in SWI is highly correlated (−0.76) with previous-month vapor pressure deficit (VPD) over Iraq, demonstrating the potential of VPD for dust event forecasting.
Export citation and abstract BibTeX RIS

Original content from this work may be used under the terms of the Creative Commons Attribution 3.0 licence. Any further distribution of this work must maintain attribution to the author(s) and the title of the work, journal citation and DOI.
1. Introduction
Dust events occur in many parts of the world (Chen et al 2004, Hand et al 2012, Creamean et al 2013, Ishimoto et al 2016), but are more frequent over arid and semi-arid regions (Furman 2016, Khalidy et al 2019). Large dust events often result in extensive damage to natural and human environments (Kirkland and Fierer 1996, Chen et al 2004, Jugder 2011, Zhang et al 2016, Middleton 2017). The occurrence of dust events is influenced by complex land-atmospheric interactions, mainly due to high wind speed, sparse or lack of vegetation cover, eroded land, and low humidity, among other influencing factors (Csavina et al 2014). Therefore, determining the land-atmospheric characteristics over dust-prone regions is an active area of research.
Although the progress of dust emission is complex, considerable research has been devoted to predict dust storms using numerical models. Yuan et al (2019) reported good progress in simulating the spatial-temporal evolution of a severe dust storm that occurred in Asia using the WRF-Chem model and also highlighted some shortages. Additionally, Chen et al (2018) estimated the divergences in the natural and anthropogenic dust emission fluxes among different climatic regions in the world. They found that the natural dust sources contributed 81% of the global dust emissions and that anthropogenic sources contributed the remaining 19% (Chen et al 2018). They also concluded that the concentrate anthropogenic dust events mainly occur in semi-arid, sub-humid and humid regions. Furman (2003) studied the origin and spatiotemporal characteristics of dust storms in the Middle East between 1973 and 1993; they reported that dust storms are frequent over Iran, northeastern Iraq and Syria, the Persian Gulf, south of Saudi Arabia, Yemen, and Oman, and occur more frequently in summer.
SWI, especially the Khuzestan province, is known for frequent dust storms. In 2011, the World Health Organization (WHO) ranked Ahvaz (center of Khuzestan province) as the world's most air-polluted city in terms of PM10 (Dastoorpoor et al 2019). The proximity of SWI to southern Iraq and Saudi Arabia deserts can be a reason for the frequent occurrence of dust events of varying intensity throughout the year (Maleki et al 2016, Goudarzi et al 2019). Farther deserts such as those in Syria and North Africa can also contribute to dust events over SWI (Khalidy et al 2019). Broomandi (2018) also found that dust particles could arrive at the city of Ahvaz from the northwestern region of Iraq, central parts of Iraq and eastern Syria. Central Iraq may also be the main dust source of Ahvaz based on the study of Noroozi and Shoaei (2018). Additionally, Azizi et al (2012) conclude that the regions around the border between Iraq and Syria are the main dust sources for Western Iran. The United Nations Environment Program (UNEP) has reported several factors that may exacerbate these events, including the occurrence of droughts in SWI and neighboring countries such as Iraq, the reduction of surface and subsurface soil moisture, removal of vegetation cover, and the development of sedimentary and fine-grained areas (Environment in Iraq: UNEP Progress Report 2003). Furthermore, human factors such as construction of large dams on rivers leading to the Mesopotamian basin (Iraq) may also contribute to the dust events entering western Iran, some of them having crossed the Zagros Mountains in recent years to impact central Iran (Crosbie et al 2014). Zoljoodi et al (2013) found some relationship between precipitation changes in dust sources of Iraq and Syria and extreme dust events in the west of Iran but they did not found a significant relationship between temperature and vegetation change of those dust sources and dust events in the west of Iran. Furthermore, Nabavi et al (2016) demonstrated that, during October–May of 2007–2008, most parts of dusty areas in Western Asia were under a very profound reduction of precipitation.
While the relationship between drought and dust events has been studied in other regions such as the United States Southwest (e.g. Achakulwisut et al (2018)), we are not aware of any comprehensive published study that explores the relationship between drought and dust storms in SWI (figure 3(a)). In this study, we will show where most of the SWI dust events come from, quantify relationships between major drought events in Iraq and dust events in SWI, and introduce a satellite-observed variable that can potentially be used for prediction of dust events.
2. Datasets, model, and methods
2.1. AOD data
Different aerosol optical depth (AOD) data products were obtained from NASA's Moderate Resolution Imaging Spectroradiometer (MODIS) on Aqua and Terra platforms. MODIS AOD has shown a good relationship with ground measurements in the study region (Hossein Mardi et al 2018, Khalidy et al 2019, Shi et al 2019). The MODIS level 3 AOD product, which are used in this study, include MOD08 AOD Land Ocean, MOD08 AOD 550 Dark Target Deep Blue Combined, MOD08 Deep Blue AOD 550 Land, MOD08 Deep Blue Angstrom Exponent Land, MYD08 AOD Land Ocean, MYD08 AOD 550 Dark Target Deep Blue Combined, MYD08 Deep Blue AOD 550 Land, MYD08 Deep Blue Angstrom Exponent Land all at monthly scale. Furthermore, for extreme dust event analysis, daily MODIS AOD were used. Additionally, the Multi-angle Imaging SpectroRadiometer (MISR) daily AOD product was investigated in this study and compared with MODIS AOD. The product is named 'MIL3DAE' and its spatial distribution is 0.5° × 0.5°.
2.2. HYSPLIT model
An important step of this study is to determine the main sources of dust impacting SWI. The Hybrid Single-Particle Lagrangian Integrated Trajectory (HYSPLIT) model was used for this purpose. HYSPLIT is a popular model for trajectory analysis (Su et al 2015) that often uses weather data from the Global Data Assimilation System (GDAS). One of the first applications of this model was for modeling dust storms in order to estimate PM10 in the Middle East (Draxler et al 2001).
2.3. GDAS model
The Global Data Assimilation System (GDAS) is a global atmospheric model based on meteorological data and numerical weather predictions (Su et al 2015). GDAS data at 1° resolution were obtained from (ftp://arlftp.arlhq.noaa.gov/pub/archives/gdas1). GDAS provides several meteorological variables like air temperature, wind speed, air pressure, humidity, and other products required to run the HYSPLIT model.
2.4. SPEI
The Standardized Precipitation Evapotranspiration Index (SPEI) (Vicente-Serrano et al 2010) is used for drought assessment in this study. SPEI is a modified version of the Standardized Precipitation Index (SPI) (McKee et al 1993) and considers both potential evapotranspiration and precipitation. Unlike SPI that is also widely used for drought studies (Golian et al 2019, Javadian et al 2019), SPEI captures the main impact of increased temperatures on water demand. SPEI is based on a monthly climatic water balance (precipitation minus potential evapotranspiration), which is adjusted using a three-parameter log–logistic distribution. The values are accumulated at different time scales, following a similar approach used in the SPI, and converted to standard deviations with respect to average values (Vicente-Serrano et al 2012). Here we used SPEI6, as a six month SPEI, obtained from (http://sac.csic.es/spei/map/maps.html) which uses CRU TS3.2 and Penman–Monteith to calculate 'precipitation minus evapotranspiration' prior to standardization.
2.5. AIRS
Near surface air temperature (T) and relative humidity (RH) are obtained from the Atmospheric Infrared Sounder (AIRS; Aumann et al (2003)) sounding suite, which is on Aqua and has been operational since 2002. Several studies have used AIRS for weather forecasting and global climate research (Ishimoto et al 2016, Zhang et al 2018). By calculating vapor pressure deficit (VPD) using T and RH from AIRS, Behrangi et al (2016) showed that AIRS can also provide valuable information for drought early detection. In this study, we use AIRS VPD, T, and RH obtained from Jet Propulsion Laboratory (JPL) AIRS project servers. The data is monthly and its spatial resolution is 0.5°.
3. Results
3.1. Mean annual AOD time series over SWI
In order to illustrate the fluctuation of dust events in the region, a monthly time series of eight different MODIS products, averaged over SWI, are plotted for 2003–2018 (figure 1). The results show that 2008 and 2009 were the most polluted years in SWI, which is consistent with the study of Sari Sarraf et al (2015), based on the yearly variation of annual means of dust events in Ahvaz weather station during the period of analysis. The results are also consistent with Arkian and Nicholson (2017) study, based on MISR AOD during the overlapped time period, in terms of AOD fluctuations. The angstrom exponent measurement from both Terra and Aqua satellites suggests that the pollution over SWI is relatively more coarse in size (i.e. Angstrom exponent less than 1) over the study period (figures 1(d) and (h)). The Angstrom exponent is a useful indicator for detecting aerosol particle size, with values greater than 2 indicating small particles associated with combustion byproducts, and values less than 1 indicating large particles like dust (Schuster et al 2006).
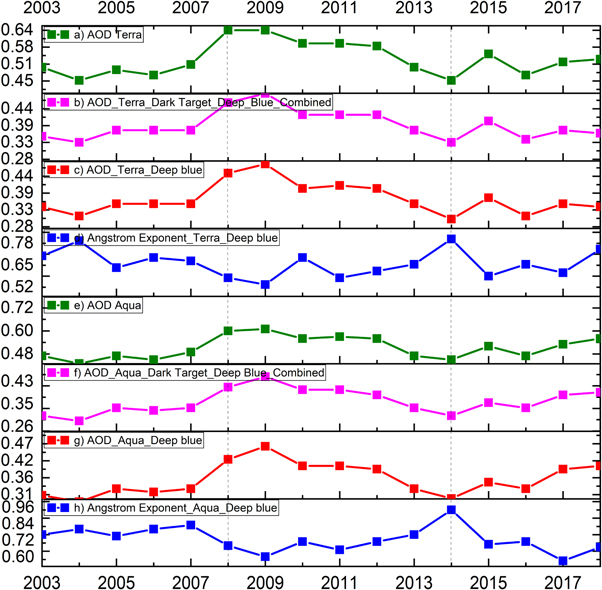
Figure 1. Mean values over SWI for (a) MOD08 AOD over land and ocean, (b) MOD08 AOD 550 combined dark target and deep blue, (c) MOD08 AOD deep blue 550 over land, (d) MOD08 deep blue angstrom exponent over land, (e) MYD08 AOD over land and ocean, (f) MYD08 AOD 550 combined dark target and deep blue, (g) MYD08 AOD deep blue 550 over land, and (h) MYD08 deep blue angstrom exponent over land.
Download figure:
Standard image High-resolution imageThe time series of the combined AOD of dark target deep blue, and AOD of deep blue are generally consistent in interannual trends for both Aqua and Terra satellites. However, AOD values in Aqua are higher than Terra in recent years (2016–2018). The result demonstrates that Terra often has higher AOD and lower angstrom exponent values than Aqua except in recent years (from 2016 to 2018). It might be related to the general calibration issue of Terra AOD that causes striping over land as discussed in Wei et al (2019).
For exploring the consistency of MODIS AOD product with other satellite AOD products, the annual AOD of MISR in SWI is shown in figure 2. Comparing MODIS AOD products in figure 1 and MISR AOD product in figure 2 demonstrates that their AOD are relatively consistent, adding more confidence in using MODIS product in the subsequent analysis.

Figure 2. Mean annual AOD over SWI by MISR AOD product.
Download figure:
Standard image High-resolution imageMoreover, figure S4 (available online at stacks.iop.org/ERL/14/124029/mmedia) demonstrates a good relationship between Ahvaz weather station visibility and its monthly AOD in year 2009.
3.2. Trajectory analysis of dust storms in SWI
Based on the AOD analysis, 2009 was the dustiest year in this area. An airmass backward trajectory analysis was performed for the city of Ahvaz (center of Khuzestan province). For each month of the year, frequency analysis was performed using 48 h backward trajectories using 6 h time steps. Figure 3(b) shows that dust events mainly traced back to the northwest of the Khuzestan province (i.e. Iraq) in all months. For instance, in July 2009, about 80% of SWI dust originated from the central and southern part of Iraq. The trajectory analysis suggests that in a few cases (<10%), dust events over Khuzestan originated over Saudi Arabia and Syria, which was much less frequent compared to dust coming from Iraq. Therefore, the top three dust sources for Ahvaz are central Iraq, southern Iraq, and southern Iran. These results are similar to Khalidy et al (2019), who reported that central Iraq, northern Syria, western Iraq, and the Hoorolazim Wetland accounted for 71%, 19%, 6%, and 4% of dust events over Ahvaz in 2016. The Hoorolazim Wetland is a complex of Marshes that straddle the Iraq–Iran border (figure 3(a)).

Figure 3. (a) Region of study including the red box representing Iraq and the black box representing SWI (mainly Khuzestan province), (b) HYSPLIT backward trajectory frequencies for each month of 2009 for Ahvaz, showing the number of start points of dust per grid square per number of trajectories.
Download figure:
Standard image High-resolution imageFigure 3(b) also shows that the impact of Iraq dust sources on Ahvaz decreases in cold months to the point that sometimes Africa and Europe can have a relatively considerable effect on SWI dust events. Wind rose data from an Ahvaz weather station for a representative year (2016) demonstrate that westerly winds are dominant (figure S1).
Furthermore, Iraq receives much of its precipitation in cold months (figure S2), mitigating dust sources over Iraq due to higher soil moisture. In contrast, in summer months when there is much less precipitation, soil is drier over Iraq and can be a substantial source of dust (figure S2).
An analogous HYSPLIT analysis was also conducted for Baghdad (capital of Iraq). It showed that the main sources of dust over Iraq originate in Iraq and only little comes from Saudi Arabia (figure S3).
Motivated by the HYSPLIT results, two boxes were selected for further analysis (figure 3(a)): (1) Black box representing SWI (mainly in Khuzestan province), and (2) Red box for Iraq.
3.3. Extreme dust event frequency analysis over SWI
Although mean values can give a general sense of pollution, they may not provide sufficient information about pollution variability. For example, it is possible to have lower annual or monthly mean AOD, but at the same time more severe daily AODs. Therefore, extreme dust events were assessed by investigating the daily AOD from MODIS Aqua. We defined that a day with AOD greater than '[mean monthly AOD] + [3*Standard deviation]' is an extreme dust event. The total number of these events in each year from 2003 to 2018 is provided in figure S5. The results follow the mean annual results (i.e. 2009, 2010 and 2008 have the top three most dust extreme events, respectively). It can be seen that the number of extreme dust events in JJA increases dramatically (and exceeds that in MAM) for years with higher extreme dust events.
3.4. Monthly AOD over SWI
For understanding the monthly differences in AOD over SWI, we compared the average monthly values for three time periods: 2003–2008, 2009–2014, and 2015–2018 (figure 4(a)). Selection of the time periods are based on breaking the 16 years into three periods to represent beginning, middle and end of the whole period. The monthly values show that in all periods, May–July exhibited the highest AOD over SWI. This is expected because these months are the hottest and driest months in this region, depleting moisture in the soil and making the environment prone to dust events. In contrast, lower AOD is observed in winter when the region often receives most of its precipitation (figure S2) and the soil is relatively moist.
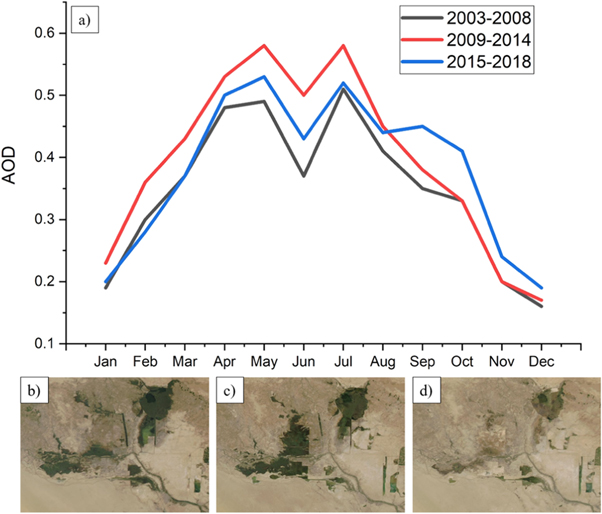
Figure 4. (a) Mean of Monthly combined AOD (from Aqua) over SWI during 2003–2008, 2009–2014, and 2015–2018. Images of wetlands located near the border of Iraq and SWI for (b) September 2006, (c) September 2014, and (d) September 2015 obtained from MODIS.
Download figure:
Standard image High-resolution imageFurthermore, figure 4(a) shows that AODs in fall (especially September–October) are higher in the recent period (2015–2018) compared to earlier periods. This could be partly related to the fact that water bodies in the west side of Khuzestan and east side of Iraq have dramatically shrunk in recent years due to desiccation, especially in late summer and early fall (figures 4(b)–(d)). These wetlands, such as the previously mentioned Hoorolazim Wetland (figure 3(a)), almost went dry in the fall seasons of 2015 through 2018 and consequently became a dust source for September and October dust storms in the region.
The spatial distribution of AOD in each month was assessed (figure S6). The key results were that (i) AOD in SWI exceeded other regions of Iran, (ii) the fluctuation of AOD in central and southern Iraq was similar to SWI, and (iii) Saudi Arabia dust sources affected AOD over Persian Gulf in cold months. Furthermore, dust events over Iraq are fairly isolated (i.e. produced locally) as can also be inferred from figure S3.
3.5. Drought analysis
The observed relationship between drying wetlands in Iraq and increasing dust storms in SWI supports the idea that drought promotes dust storms. The relationship between drought and dust events was further studied using SPEI6, separately calculated over Iraq (red box in figure 1(a)) and SWI (black box in figure 1(a)). Comparing SPEI and TRMM precipitation data demonstrates that SPEI with one year lag time and precipitation are well-correlated (figure S7). The results show that SPEI6 over SWI is often more severe than Iraq in recent years (figure 5(a)). We also investigated the relationship between annual AOD over SWI and annual SPEI6 over both SWI and Iraq. It was found that annual AOD over SWI exhibits a higher correlation with annual SPEI6 over Iraq (r = −0.77) than annual SPEI6 over SWI (r = −0.62) (figures 5(b) and 4(c)), even though SWI has more severe drought conditions. This makes sense given that most of the dust events over SWI are traced back to Iraq.
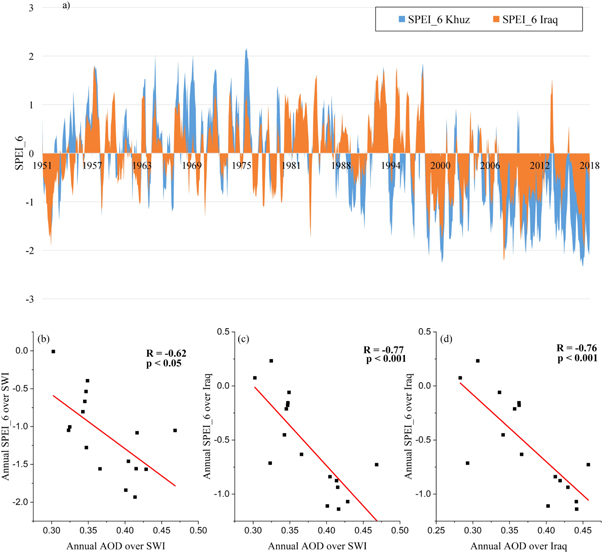
Figure 5. (a) Monthly SPEI6 time series for SWI and Iraq. Scatter plot between Annual SPEI6 and Annual AOD over (b) SWI and SWI, (c) Iraq and SWI and (d) Iraq and Iraq. (the red lines represent linear regression between Annual AOD and SPEI6).
Download figure:
Standard image High-resolution image3.6. AIRS satellite analysis
SPEI is a popular drought index, but large uncertainties may exist in quantification of precipitation and potential evapotranspiration. An alternative approach is to investigate VPD that can be calculated directly from T and RH observed by AIRS. It has been shown that VPD can provide useful information for early detection of drought (Behrangi et al 2015, 2016). Therefore, it is important to investigate at what lead time AIRS observations of VPD over Iraq can provide the highest correlation with dust event incidence over SWI. Figure 6 shows lag-correlations between monthly AIRS observation (VPD, T, and RH) over Iraq and monthly AOD over SWI for 2007–2018. It indicates that a one month lead time provides the maximum correlation between AOD and either VPD (r = 0.76), T (r = 0.81), or RH (r = −0.76). In other words, higher VPD in Iraq for the current month would suggest a higher probability of dust events in SWI for the subsequent month.

Figure 6. Correlation between AIRS products (vapor pressure deficit, air temperature, and relative humidity) over Iraq and Aqua AOD over SWI across different monthly lag times.
Download figure:
Standard image High-resolution image
Encouraged by the relatively good relationship between AIRS observations over Iraq and AOD over SWI, the potential of using AIRS VPD observations to predict dust over SWI, with one month lead time, was further investigated. Using 12 years (2007–2018) of VPD data, odd years were used for training and even years were used for evaluation of the prediction. The linear regression between VPD (with one month lag time) and AOD was applied to even years (AOD_SWI = 0.0571 × VPD_Iraq + 0.2132). The correlation coefficient between predicted AOD and observed AOD was 0.67, which is encouraging given the fact that AIRS data are accessible in near real-time (i.e. within 1–2 d of sensor overpass). Severe dust storms in SWI are expected when VPD is high in Iraq in the previous month. In fact, increasing VPD can make soils vulnerable to traversing the long distance from Iraq to SWI. The one month lag time might be due to the soil characteristics that need more time for lifting from the ground.
4. Conclusions
Cities located in the southwest of Iran are among the dustiest cities in the world. There is a large debate about whether the sources of the dust storms are internal (i.e. deserts located in SWI and dried wetlands) or external (i.e. Iraq, Saudi Arabia, Syria and Turkey). In this study, we investigated this question using a trajectory model and then explored potential reasons that may lead to dust events.
The HYSPLIT trajectory model was used to identify main dust sources affecting SWI. The results suggest that external sources are more important and the main sources are located in central and southern Iraq. These two sources are more active in summer and less active in winter when there is enough precipitation and soil moisture to reduce dust activities.
Analysis of mean annual AOD data showed that years 2008 and 2009 were the most polluted years in SWI out of the 16 years (2003–2018) of study. Interestingly, the results do not show a long-term significant trend in AOD over SWI (2003–2018). The angstrom exponent dataset suggested that the aerosol burden was mainly comprised of dust. Extreme dust event analysis showed that years with higher annual mean AOD generally corresponded with a higher number of extreme dust events. Interestingly, in both 2008 and 2009, most of the extreme dust events occurred in summer rather than spring when the number of extreme events are the highest based on climatology.
Knowing that major sources of dust over SWI are in Iraq, we investigated the relationship between drought in Iraq and dust in SWI. The SPEI index showed that there is a considerable correlation (r = −0.77) between drought in Iraq and dust events in SWI, which is even higher than the correlation between drought and AOD in SWI (r = 0.62). In other words, drought over Iraq displayed a larger effect than drought over SWI on the number of dust events in SWI.
We also investigated the relationship between monthly-lagged AIRS VPD, T, and RH over Iraq and AOD in SWI. The maximum correlation was obtained at one month lag-time, suggesting that AIRS observations have the potential to predict dust events a month in advance. By splitting 12 years (2007–2018) of VPD data into odd and even years, it was found that VPD over Iraq has skill (r = 0.67) in predicting AOD over SWI with one month lead time.
This study showed that the impacts of drought in an upwind region on dust storms in a downwind location are significant and that VPD is a forecasting tool for dust events that warrants further investigation for its applicability in other arid and semi-arid regions. Having long-term particulate matter data from a network of ground-based stations can improve the study in terms of satellite data validation. Moreover, in the future, the Multi-Angle Imager for Aerosols (MAIA) mission of NASA can help the study in terms of radiometric and polarimetric measurements needed to characterize the sizes, compositions and quantities of particulate matter in air pollution (Liu and Diner 2016).
Acknowledgments
Partial financial support was made available from a NASA AIST (NNH16ZDA001N-AIST) award.
Data availability statement
Data sharing is not applicable to this article as no new data were created or analyzed in this study.