

Abstract
Winter is often understudied in ecosystem sciences and viewed as a burden for human systems and infrastructure. However, the importance of winter in regulating ecological processes and shaping human communities has emerged as a topic of great interest, particularly in areas that experience seasonal snow cover. Traditional seasonal definitions may not fully represent below freezing winters and snow accumulation that have historically characterized these areas. Here we: (1) propose the concept of 'frigid winter' to address longstanding problems with traditional delineations of winter; and (2) define frigid winter as a period of sustained temperatures below freezing and snow accumulation that together regulate ecological processes and their services. We explore this definition and the changes occurring within it using 100 years of meteorological data from northeastern North America. Trend analysis demonstrates that frigid winters have shortened by ∼3 weeks over the last century, that cold, snowy conditions have become more intermittent, and that the choice of winter delineation (astronomical, meteorological, hibernal, or frigid) influences the apparent rate at which winter conditions disappear.
Export citation and abstract BibTeX RIS

Original content from this work may be used under the terms of the Creative Commons Attribution 3.0 licence. Any further distribution of this work must maintain attribution to the author(s) and the title of the work, journal citation and DOI.
1. Introduction
Traditional seasonal definitions divide the year into four periods: winter, spring, summer, and fall; with start, end, and duration based on an astronomical or meteorological delineation. An astronomical winter in the northern hemisphere begins ∼22 December, ends ∼21 March, and lasts ∼89 d. This delineation is based on the axial tilt of the Earth in relation to the Sun. The meteorological winter contains the three coldest months of the year, or December, January, and February (DJF) in the northern hemisphere (Huschke 1959). It aligns with the civil calendar and is convenient for calculating and comparing statistics over space and time (Trenberth 1983). Most regional and national climate assessments evaluate winter climate change by examining trends during the meteorological winter of DJF (Vincent et al 2015, USGCRP 2017), though other disciplines often apply a broader definition in their research. Biologists and ecologists often define winter using local to regional conditions of temperature, snow cover, and biological phenomena, such as animal hibernation or leaf-off conditions (Kielland et al 2006, Contosta et al 2011, Ladwig et al 2016). This delineation lacks a formal name and is referred to hereafter as the hibernal period of biological dormancy.
Both the astronomical and the meteorological definitions of winter have long been recognized as problematic. As far back as the 1930s they were viewed as out of sync with local weather. Hartshorne (1938) noted that the Sun–Earth geometry defining astronomical seasons can be misaligned with conditions on the ground, such that the vernal equinox arrives when flowers have been in bloom for weeks in some areas even as snow persists in others. Jefferson (1938) pointed out that the meteorological winter is a purely relative term that cannot be applied equally to all places. Meteorological and astronomical definitions may be as misaligned with ecological systems as they are with human ones. Above certain latitudes and altitudes, snow may remain on the ground and temperatures may be below freezing during months that are traditionally considered autumn or spring. These cold, snowy conditions drive the timing of biological processes such as bud-break and leaf-out (Fu et al 2014, Piao et al 2015) as well as biogeochemical processes that regulate ecosystem energy, nutrient, carbon, and water balances (Contosta et al 2017).
Numerous studies have developed more spatiotemporally dynamic delineations of winter to address problems with traditional seasonal definitions (Trenberth, 1983, Pielke et al 1987, Cheng and Kalkstein 1997, Dong et al 2010, Zander et al 2013, Cassou and Cattiaux 2016, Kutta and Hubbart, 2016), but nearly all of them rely on the concept of winter as the coldest season. This coldest season concept has no quantitative meaning, 'yet water freezes everywhere at 32 °F,' (Jefferson 1938) suggesting that winter in seasonally snow covered areas is constrained by a temperature threshold that fosters conditions such as 'snow covered fields, ice on lakes and streams, continuously frozen soil in fields and dirt roads, and city sidewalks and streets that must be cleared of snow,' (Hartshorne 1938). These early arguments for a definition of 'frigid' winter foreshadow the proliferation of research aimed at understanding the climatic, ecological, economic, and epidemiological importance of cold, snowy winters and the consequences of losing them (Groisman et al 1994, Lindgren and Gustafson 2001, Barnett et al 2005, Campbell et al 2005, Déry and Brown 2007, Brooks et al 2011, Zhang et al 2012, Dawson and Scott 2013, Weed et al 2013, Rittenhouse and Risman 2015, Hagenstad et al 2018).
Researchers' choice of winter definition can also have consequences for climate change communication, stakeholder engagement, and adaptation planning. Two economic drivers in the seasonally snow covered region of northeastern North America, downhill skiing and winter timber harvesting, depend on air temperatures and snow conditions to define their periods of operation (Rittenhouse and Risman 2015, Wobus et al 2017), not the calendar year or astronomical position of the Earth. The snowmobiling season, which counts on snow conditions and pre-established contracts with private landowners, typically begins in December and ends in March or April. Winter hunting seasons for species like snowshoe hare extend from October to March, depending on the location. Researchers who restrict winter climate change investigations to astronomical or meteorological definitions likely miss these and other key windows of interest for people who live between 40 and 60 °N—a global, latitudinal band characterized by seasonal snow cover (Brown 2000).
Here we address these issues and attempt to answer the call of geographers from the early 20th century for a definition of a 'frigid' season (Hartshorne 1938, Jefferson 1938) that would better illustrate winter in temperate, seasonally snow covered areas, where the notion of 'winter' evokes a specific suite of conditions tied to the freezing point of water. We define this frigid winter as a period of sustained temperatures below freezing and snow accumulation that together regulate ecological and biogeochemical processes and the services they provide to human systems. To explore this definition, we examined 100 years of meteorological data across northeastern North America. We analyzed changes in frigid winter timing, duration, and condition using indicators of cold temperatures and snow covered conditions. We then examined how the choice of definition—astronomical, meteorological, hibernal, or frigid (see box 1)—influences the apparent rate at which winter conditions disappear.
Box 1. Definitions of winter evaluated in this research.
| DJF: | Meteorological winter |
| The three coldest months of the year, December, January, and February. | |
| ∼90 d duration | |
| AST: | Astronomical winter |
| Winter solstice to vernal equinox. | |
| ∼89 d duration | |
| DOR: | Hibernal period of biological dormancy |
| Defined in this project as the months of November through May, typically leaf-off season in north temperate, forested regions. | |
| ∼212 d duration | |
| FGD: | Frigid winter |
| Sustained temperatures below freezing and snow accumulation. Tied to the freezing point of water, operationally defined here using thresholds of freezing temperatures or snow covered conditions. | |
| Length varies by location |
2. Methods
2.1. Study area and data sources
We used 100 years of climate data to determine changes in winter timing, duration, and condition across northeastern North America (figure 1(a)). Station selection and data pre-processing followed the protocol outlined by Contosta et al (2019), wherein stations from the National Climate Data Archive of Environment Canada (NCDAEC) (Mekis and Vincent 2011, Vincent et al 2012) and the United States Historical Climatology Network (USHCN) (Easterling et al 1999, Williams et al 2006) with ≥100 years of precipitation and/or temperature data were included in the analysis. Both the NCDAEC and the USHCN serve high-quality datasets that they have tested and adjusted for homogeneities and biases arising from issues such as urban warming, station moves, differences in measurement protocols over time, and other non-climatic influences. Data were daily minimum and maximum temperature, daily snowfall, and daily snow depth. Snow depth records typically began ∼1950 for both the Canadian and US stations, and measurements made after 1950 also contained many gaps since 'missing' snow depth data can occur when observers fail to record snow depth as zero when snow is not on the ground (Kunkel et al 2009). To account for the lack of consistent snow depth records before 1950 as well as missing snow depth data from 1950 to present, snow depth was estimated as snow water equivalent (SWE) for the entire time series using a degree day snowmelt model (Kokkonen et al 2006, Buttle 2009, Crossman et al 2016) as implemented in Contosta et al (2019). Goodness-of-fit (r2) between measured snow depth and modeled SWE varied between 0.05 and 0.80, with an average of 0.50. Since measured and modeled snow depth were not 1:1 analogs (measured were in solid snow, modeled were in SWE), we used presence-absence metrics of snow cover when calculating winter timing and condition. The model accurately simulated the presence of a snowpack (modeled SWE > 0 mm depth) 98% of the time.

Figure 1. (a) Rates of change (days per decade) in winter duration, as defined by daily air temperature, for 37 stations across the study domain. Red dots indicate significant decreases in frigid winter duration, and gray dots represent no significant change. The size of the dot illustrates the magnitude of change; (b) 'wedge plots' showing onset and end of frigid winter, as defined by daily air temperature, from 1917 to 2016. Lighter-colored lines in the background are time series for each site showing the day of year of frigid winter start and end, while darker-colored, straight lines in the foreground indicate trends. Red lines show trends toward later onset (autumn) and earlier end (spring), while gray lines indicate a lack of significant change over time. Sites are grouped into three geographic areas, western, central, and eastern, to facilitate data visualization and interpretation.
Download figure:
Standard image High-resolution image2.2. Timing and duration of frigid winter
We defined the timing of frigid winter in two ways: using temperature-based criteria and snow cover-based criteria. Start dates based on air temperature were determined as the first days of the winter year when there were at least four subsequent days within a seven day period when maximum temperatures were below 0 °C. Likewise, the end of frigid winter, as based on air temperatures, was defined as the last day of the winter year when there were at least four preceding days within a seven day period when minimum temperatures went below 0 °C. The start and end dates for continuous snow cover were based on a similar algorithm and were characterized as the first and last instances within a winter year featuring at least four snow covered days within a seven-day week. The duration of frigid winter was thus calculated as the number of days between the start and end of the period of sustained cold or snow cover. These criteria are like the index-based approach used by climatologists to define 'cold spells' and 'warm spells' (Karl et al 1999, Alexander et al 2006) but are more explicitly tied to the 0 °C threshold at which water freezes or thaws. To assess the sensitivity of the length of frigid winter to these criteria, we repeated the analysis using thresholds of one through seven days within a seven-day period where the minimum temperatures were below 0 °C to trigger the onset of winter and above 0 °C to signal the end of the frigid period. The results are presented in the supplementary information (SI), available online at stacks.iop.org/ERL/15/034020/mmedia, and while the length of frigid winter varied depending on the exact criteria selected, the overall trends towards shorter winters, particularly earlier onset of spring, were consistent among analyses.
We used Mann Kendall analysis (Mann 1945) (to detect the significance of the trend) and Sen slope estimation (Sen 1968) (to evaluate the magnitude of change) to examine changes in the timing and duration of frigid winter. We visually grouped sites into three geographic subregions, western, central, and eastern, to examine broad spatial differences or coherence among trends (figure 1(a)). Sites in the western subregion were west of 87 °W, sites in the central subregion were located between 78 °W and 87 °W, and sites in the eastern sub-region were east of 78 °W. After performing separate statistical analyses for each of the 37 stations in the study, we calculated median, minimum, and maximum Sen slopes where trends were significant based on a Mann Kendall test (α = 0.05) within each of these geographic subregions.
2.3. Condition of frigid winter
The condition of each winter was determined using indicators that could illustrate changing winter temperatures and snow cover. Frost days depicted when daily minimum temperatures were <0 °C (Brown et al 2010, Donat et al 2013). Snow covered days were days when snow depth >0 mm (Hayhoe et al 2007, Burakowski et al 2008). To be consistent with the approach in meteorology and climatology, as well as in state, regional, and national climate assessments, we also considered average winter minimum temperature as an indicator of winter condition.
Using these indicators, we assessed changes in the continuity of cold temperatures below freezing and snow cover within frigid winter in two ways. First, at each station, within each year, we determined the maximum number of sequential frost days or snow covered days for the entire hibernal season of biological dormancy. We then split the data set into three, thirty-year climate normals as specified by the World Meteorological Organization (WMO 2007): 1921–1950, 1951–1980, and 1981–2010. Using these three time periods, we examined changes in the distribution of maximum continuous frost days and snow covered days with kernel density plots (using the geom_density function in the ggplot package in R; Wickham 2016). Second, we calculated the proportion of sites where minimum temperature was <0 °C (frost days) and when snow cover was >0 mm (snow covered days) for each individual day in the 100 year record. To visually assess patterns through time, we grouped the data by decade and fit LOESS curves to each group (using the loess function in base R; R Core Team 2019).
2.4. Winter definitions and apparent rates of change
We examined how choice of definition influences the apparent rate at which winter conditions are changing by calculating the frequency of occurrences for each indicator (frost days, snow covered days) for each site by year by definition combination, using the four definitions of winter (box 1) to constrain the number of days included in the annual total. We took a similar approach for assessing changes in minimum winter temperatures, except that we averaged minimum temperatures across each site by year by definition combination instead of counting frequency of occurrences. We then used Mann Kendall and Sen slope estimation to evaluate change over time in average minimum temperatures, frequency of frost days, and frequency of snow covered days.
3. Results
Figure 1 shows the start, end, and duration of frigid winter from 1917 to 2016 for 37 stations in three geographic areas (western, central, and eastern) across the study region, where start and end dates were determined based on either air temperature or snow cover thresholds. Median frigid winter duration over the entire region was 146 d (range: 85–190 d) at the start of the record in the 1910s. This has attenuated to a median period of 126 d (range: 9–194 d) during the 2010s, losing approximately 20 d of cold and snow over the past century (figure 1(a)). Trend analysis shows that from 1917 to 2016, the period of sustained cold temperatures below freezing has started a median of +1.3 d (range: +1.1 to +1.7 d) per decade later. It has ended a median of −1.2 d (range: −0.8 to −2.3 d) per decade earlier and has become a median of −2.1 d (range: −1.1 to −2.9 d) per decade shorter (table 1, figure 1(b)). Changes in the start, end, and duration of snow covered period were similar. The snow covered season has begun +1.4 d (range: +0.9 to +1.5 d) per decade later and has ended −1.1 d (range: −1.0 to −2.6 d) per decade earlier. The later start and earlier end to the snow covered season means its duration has declined by −1.9 d (range: −1.4 to −4.5 d) per decade over our 100 year study period (table 1, figure S1). While some sites in the study domain did not exhibit significant decreases in frigid winter duration, as defined by either temperature or snowpack, we did not detect any significant increases in frigid winter length (table S1; figures 1, S1).
Table 1. Change over time (days per decade) in the start, end, and duration of frigid winter as defined by air temperature or snow cover criteria. Values are median (minimum, maximum) of Sen slopes statistics calculated for sites where trends were significant (α = 0.05).
| Criteria | Start | End | Duration |
|---|---|---|---|
| Temperature | +1.3 (+1.1, +1.7) | −1.2 (−0.8, −2.3) | −2.1 (−1.1, −2.9) |
| Snow cover | +1.4 (+0.9, +1.5) | −1.1 (−1.0, −2.6) | −1.9 (−1.4, − 4.5) |
In addition to an overall shortening of the cold, snowy season, conditions within winter have also become more intermittent. Across the region, sustained cold and continuous snow cover declined from 1917 to 2016. Figure 2 displays kernel density plots of the distributions of cold and snow covered days for three climate normals over the period of record: 1921–1950, 1951–1980, and 1981–2010. Here we defined 'cold' as occurring when daily minimum temperature was <0 °C (a frost day in the meteorological literature; Donat et al 2013) and snow cover as present if snow depth was >0 mm. The overall leftward shift in distributions along the x-axis (figures 2(a) and (b)) illustrate a loss of continuous cold and snow cover duration for the most recent climate normal as compared to the preceding two, though this varied regionally. In the eastern region, median duration of continuous cold went from 59 d during the 1921–1950 climate normal to 45 d in the 30 year period from 1981 to 2010. Likewise, the median duration of continuous snow cover in the east declined by 28 d from the start (82 d in the 1921–1950 period) to the end of the record (54 d in the 1981–2010 climate normal). By contrast, median values for both continuous cold and snow cover slightly increased in the central region, gaining a median of 3–4 d of persistent cold and snow cover during the period from 1981 to 2010 as compared to 1921–1950. Other studies have also reported overall cooling, lengthening snow seasons, or mixed trends in both temperature and snow cover for Great Lakes areas where many of the central sites were located, particularly since 1970 (Brown, 2000, Kunkel et al 2009, Andresen et al 2012, Mascioli et al 2017).
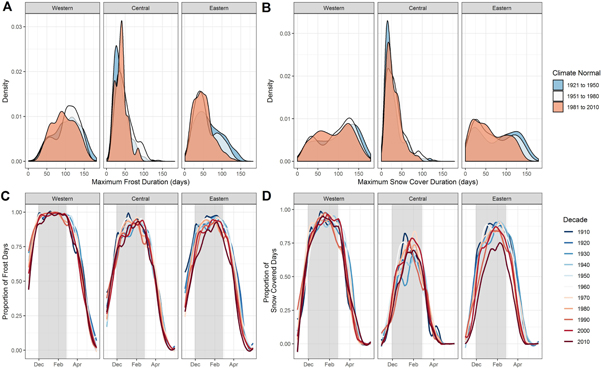
Figure 2. Discontinuity in winter coldness and snow cover as depicted by kernel density plots of the distribution of cold duration panel (a) and snow cover duration panel (b) for thirty-year climate normals within the study period, as well as the proportion of the 37 sites analyzed in this study that met winter condition coldness (c) and snow cover (d) criteria for each day of the hibernal season of biological dormancy (1 November–31 May) during the 100 year record (1917–2016). In all panels, sites are grouped by geographic areas of the study region. Lines are LOESS curves for each decade, and color-coding indicates decades to identify changes in winter conditions from earlier to later in the study period.
Download figure:
Standard image High-resolution imageFigures 2(c) and (d) display the loss of continuous frigid winter conditions using a different analysis. We calculated the proportion of stations, grouped into three geographic areas, that met winter condition criteria for each day of the dormant (DOR) season, and then fit LOESS regressions over decadal periods to these proportions. Within DOR, the proportion of stations with cold days (figure 2(c)) or snow covered days (figure 2(d)) has declined over time, suggesting that these conditions have become more intermittent in both the 'shoulder seasons' as well as during the coldest months that traditionally comprise the meteorological (DJF) definition of winter (shaded portion of graphs). However, patterns of discontinuity in winter conditions varied across the study domain. The central region had both the most intermittent winter and experienced the greatest change from the beginning of the record to the end. While 73% of sites within this region were snow covered on 1 January during the 1910s (as estimated by LOESS regression), only 53% of sites within this geographic area were snow covered on 1 January during the 2010s. By contrast, the western area generally remained cold and snow covered, even the middle of winter. During the 1910s on 1 January, 99% of sites met the coldness criteria and 92% of sites were snow covered. In the 2010s on 1 January, the proportion of sites meeting the coldness criteria had not changed, and 90% of sites were still snow covered.
Comparing our frigid winter definition with more traditional seasonal delineations also illustrates how the choice of seasonal definition influences the apparent rate at which winter conditions have changed (figure 3). Using violin plots of the distribution of trends, we show that changes in average minimum temperatures were relatively consistent among definitions (figure 3(a)). Most sites showed either an increase in daily minimum temperatures or no significant change, with a handful of sites also exhibiting declines. This overall trend of rising minimum temperatures across seasonal definitions fits with previous reports of warming winters both in the US and Canada (Vincent et al 2015, USGCRP 2017) and shows a general pattern of warming. However, quantifying changes in daily average temperatures, particularly using the DJF definition typical of regional and national climate assessments, may obscure actual losses of below-freezing temperatures and snow covered conditions. Violin plots of the distribution of rates of change in frost days and snow covered days illustrate this point. Trends in numbers of frost days and snow covered days showed substantial differences by winter definition, with the fastest rates of change observed during FGD and DOR and the slowest rates of change observed in AST and DJF (figures 3(b) and (c)). These higher rates of change in frost days (figure 3(b)) and snow covered days (figure 3(c)) during DOR and FGD as compared to DJF and AST suggest a loss of these conditions during the 'shoulder seasons.' Negative trends in the frequency of frost days or snow covered days within all four seasonal delineations also shows the loss of continuous cold and snow cover, as in figure 2.

Figure 3. Violin plots showing the distribution of rates of change in: (a) average minimum temperature; (b) number of frost days (daily minimum temperature < 0 °C); and (c) number of snow covered days for each of four definitions of winter (box 1): hibernal period of biological dormancy (DOR, 1 November 1–31 May), frigid (FGD), astronomical (AST), and meteorological (DJF). Red-colored points indicate positive trends, blue-colored dots show negative trends, and gray-colored dots indicate no significant change over time.
Download figure:
Standard image High-resolution image
4. Discussion
Our finding that winter duration is declining is comparable to previous reports that demonstrated an attenuation of the winter season when winter was defined as the coldest period of the year (Allen and Sheridan 2016, Kutta and Hubbart 2016). It also fits with prior studies documenting reductions in the length of the snow covered period, both for the northeastern US (Burakowski et al 2008) and across the entire northern hemisphere (Choi et al 2010), although there is some regional variability in the strength of this result (Peng et al 2013, Chen et al 2015). The overall shortening of winter that we observed was largely due to an earlier spring onset; 22 of 37 sites exhibited significantly earlier loss of continuous cold conditions as compared with only 6 of 37 sites where the onset of cold conditions occurred later. Other studies have likewise reported that earlier springs drove trends in reduced winter duration (Dye 2002, Allen and Sheridan 2016, Kutta and Hubbart 2016). In addition, proxies for the beginning of spring, particularly phenological data describing budbreak, leaf emergence, and leaf out, have been widely used to document earlier springs (Richardson et al 2006, Schwartz et al 2013, Piao et al 2015), providing further evidence for an advancement of spring onset by −0.8 to −0.9 d per decade in the northeastern US from 1901 to 2012 (Monahan et al 2016). Our findings of later onset of winter, earlier onset of spring, and the overall shortening of the winter period resonate with the results of previous investigations of shifting vegetation phenology. However, our study is unique in emphasizing that winter length may change as dynamically as autumn senescence and spring green-up—regardless of the date on the calendar—due to the disappearance of below freezing, snow covered conditions.
Our results also highlight that cold, snow covered days have also become more intermittent. While other studies have not analyzed the continuity of winter conditions as we define them, prior efforts to quantify the duration of cold spells using the Cold Spell Duration Indicator (CDSI; Brown et al 2010), or Index (Donat et al 2013), provides supporting evidence that sustained cold in winter is declining. Brown et al (2010) found a significant decrease in frequency of cold spells since 1893 at 19 sites in the northeastern US; similarly, Donat et al (2013) noted a significant four-day decline in the duration of cold spells 'over large areas' in a global analysis that included data post-1950. A related metric, the number of thaws greater than four days in duration, increased from 1930 to 2000 across eastern North America (Bourque et al 2005). Previous studies have also cited a loss of continuous snow cover; Burakowski et al (2008) found declines in numbers of snow covered days across the northeastern US, both from December through March as well as during the historically coldest and snowiest months of January and February. Taken together, the findings of this and previous efforts suggest that the continuous below freezing, snow covered conditions that have typified winter are less likely to occur when historically expected. Kreyling and Henry (2011) called this phenomenon 'vanishing winters,' emphasizing the likely loss of persistent cold and snow cover for lower-latitude locations. Our results go a step further and suggest that we are losing persistent cold and snow even in locations at relatively high latitudes in the temperate region (north of 45° in locations; the boreal zone transition begins around 50°). Our results also agree with studies that report temperature excursions, more frequent and longer mid-winter thaws, and loss of continuous cold and snow in the core (coldest part or DJF) of the winter season across northeastern North America (Liu et al 2006, Williams et al 2015). This pattern of extreme high temperatures, longer and more frequent mid-winter thaws and snow-free periods, and changes in cold spell duration and intensity is expected to continue and amplify with climate change, with consequences for both ecosystems and society (Williams et al 2015, Dupigny-Giroux, et al 2018).
Finally, our study demonstrates how the choice of winter definition (AST, DJF, FGD, or DOR) influences the apparent rate of winter climate change. This is especially the case when documenting changes in the occurrence of below-freezing, snow covered conditions that are not typically considered in regional or national climate assessments. The faster rates of change we observed in DOR and FGD for these metrics as compared to AST or DJF suggest that cold, snow covered days have disappeared more quickly during the shoulder seasons as compared with the three historically coldest, darkest months of the year. Choi et al (2010) likewise reported faster declines in snow covered days outside of a period they termed the 'Core Snow Season,' supporting our finding that rates of snowpack disappearance are faster outside of the DJF period that typically defines winter. Although there are no standard definitions of 'dormant season' or 'frigid winter' in the literature, a handful of other studies have recognized that climate change has impacted regional seasonality in a way that is not captured using static seasonal definitions such as the meteorological definition (Allen and Sheridan 2016, Kutta and Hubbart 2016). No matter what the benefits or limitations in choosing one definition over another to describe changes in winter conditions, it is worth noting that frost days and snow covered days are disappearing within all four delineations. Even within the core of winter, during DJF and AST, trends toward fewer frost and snow covered days further illustrate the loss of continuous cold and snow cover as depicted in figure 2.
We argue that failure to explicitly consider the loss of below-freezing temperatures and resulting snow cover, as we have done here, may obscure the impacts of changing winter conditions on ecosystems and society. Numerous studies in seasonally snow covered ecosystems around the world have considered how changing winter conditions impact ecological processes and services. Winter is increasingly recognized as an understudied but critical period for supporting biogeochemical cycling of nutrients and carbon (Campbell et al 2005, Brooks et al 2011), regulating climate through the albedo of snow (Groisman et al 1994, Déry and Brown 2007), maintaining fresh water supplies through the storage capacity of the snowpack (Barnett et al 2005), providing access to forest products such as timber (Rittenhouse and Risman 2015), enabling subsistence practices such as hunting and fishing (Norton-Smith et al 2016), preventing the spread of pests and pathogens (Lindgren and Gustafson 2001, Weed et al 2013), and affording outdoor recreation opportunities through multi-billion dollar snow sports industries (Dawson and Scott 2013, Hagenstad et al 2018). All these processes and services hinge on the sustainment of below-freezing temperatures and snow cover. Frigid winter is also intertwined with cultural traditions, art and literature, and our human sense of place, and thus the loss of frigid winter has the potential to impact how home landscapes are experienced by millions of people across the globe.
5. Conclusion
Across the temperate, seasonally snow covered regions of the planet between 40 and 60 °N (Brown 2000), winter is a time when temperatures are largely below freezing, and precipitation falls as snow, not rain. We demonstrate that the winter season as defined by these below-freezing, snow covered conditions, has become shorter by −2.1 d per decade in this region, or a loss of three weeks across the past century. Within frigid winter, conditions have also become more intermittent, with fewer frost days and snow covered days that are critical to supporting ecosystem functions and services. Studies that consider only meteorological winter occurring from December through February and monitor climatic trends during this three-month period as changes in average temperature may not adequately characterize the magnitude of the seasonal changes facing temperate ecosystems globally. Areas between 40 and 60 °N are not just becoming warmer during DJF; they are losing the cold and snow in October, November, March, and April. Perhaps even more importantly, seasonally snow covered areas are also losing one of the hardest physical thresholds in nature—0 °C—that delineates the phase change between frozen and liquid water. Nearly 100 years ago geographers called for a definition of a 'frigid' winter that would illustrate this threshold and all that it encompasses (Hartshorne 1938, Jefferson 1938). The frigid winter definition we have proposed here answers that call and reframes our understanding of winter in a manner appropriate for this era of rapid climate change.
Acknowledgments
This project, 'Winter Climate Change in the Northern Forest: Scientific Synthesis and Practical Solutions,' was funded by the Northeastern States Research Cooperative (NSRC), with additional support to the Hubbard Brook Research Foundation from the Canaday Family Charitable Trust, the Lintilhac Foundation, and the Davis Conservation Foundation for stakeholder engagement and outreach. Amy Kireta at the University of Maine assisted in data compilation. Jesse Bennett of the University of New Hampshire and Ivan Fernandez of University of Maine provided insightful feedback on earlier versions of this manuscript. More than 30 scientists across the northeastern US and eastern Canada participated in this effort through the Winter Biogeochemistry Workgroup of the Northeastern Ecosystem Research Cooperative (NERC). Forty-five stakeholders and scientists participated in roundtable dialogues held in Vermont, New Hampshire, and Maine to inform this project.
Data availability statement
The data that supports the findings of this study are openly available at https://github.com/Contosta/Frigid-Winter, DOI: https://doi.org/10.5281/zenodo.3610617.