

Abstract
Decadal climate prediction, where climate models are initialized with the contemporaneous state of the Earth system and run for a decade into the future, represents a new source of near-term climate information to better inform decisions and policies across key climate-sensitive sectors. This paper illustrates the potential usefulness of such predictions for building a climate service for agricultural needs. In particular, we assess the forecast quality of multi-model climate predictions in estimating two user-relevant drought indices, Standardized Precipitation Evapotranspiration Index (SPEI) and Standardized Precipitation Index (SPI), at multi-annual timescales during European summer. We obtain high skill for predicting five-year average (forecast years 1–5) SPEI across Southern Europe, while for the same forecast period SPI exhibits high and significant skill over Scandinavia and its surrounding regions. In addition, an assessment of the added value of initialized decadal climate information with respect to standard uninitialized climate projections is presented. The model initialization improves the forecast skill over Central Europe, the Balkan region and Southern Scandinavia. Most of the increased skill found with initialization seems to be due to the climate forecast systems ability to improve the extended summer precipitation and potential evapotranspiration forecast, as well as their ability to adequately represent the observed effects of these climate variables on the drought indices.
Export citation and abstract BibTeX RIS

Original content from this work may be used under the terms of the Creative Commons Attribution 3.0 licence. Any further distribution of this work must maintain attribution to the author(s) and the title of the work, journal citation and DOI.
1. Introduction
Europe has experienced a series of extreme summer droughts since the beginning of the 21st century (Spinoni et al 2019). For instance, the year 2018 was characterized by one of the worst droughts recorded in Europe, particularly over the Northern part of the continent. This event has also been identified as the sixth in a series of extreme summer drought that began in 2003 with heat waves across the entire European continent (Fink et al 2004). The series continued in 2006 over the Baltic states (Tammets 2007), 2007 in Aegean countries (Michaelides and Pashiardis 2008), 2011 over western parts of Europe (Kendon et al 2013) and in 2015 over most parts of the Mediterranean region as well as over Central and Eastern Europe (Ionita et al 2017).
The agriculture sector has been hit particularly hard by these recurrent drought conditions: crop failure, low productivity and pasture losses have all contributed to severe economic losses during those years (Ding et al 2011). Because the impact of severe drought is expected to increase over the upcoming decades due to anthropogenic climate change (Füssel et al 2017, Spinoni et al 2018), there is a need for effective planning and adaptive actions to reduce the impact and the amount of related losses at all timescales relevant to decision-makers. Consequently, there has been a growing demand amongst stakeholders in the agricultural sector to gather, assess and tailor climate sources that can provide practical and actionable information (Bruno Soares et al 2018), in particular at the multi-annual timescale.
Until recently, the only source of near-term (from one year to a decade in the future) climate information available to users were climate projections (Taylor et al 2013, Spinoni et al 2015). These projections provide, under a plausible emission scenario of greenhouse gases, possible evolutions of the Earth's climate system for the coming decades. The evolution of the climate system represented in such simulations is solely driven by prescribed changes in the atmospheric composition and other external forcings. Recently, initialized decadal climate predictions have become available as a second source of near-term climate information. These decadal predictions are initialized with observation-based data and then run for a decade under the influence of contemporaneous changing external forcings, similarly to climate projections. The evolution of the climate system in this case is impacted by both internally generated and slowly varying natural variability and externally forced components (Meehl et al 2009, Doblas-Reyes et al 2013a, Meehl et al 2014, Smith et al 2019). A clear benefit of this new source of information is the potential to provide reliable and robust climate outlooks on a multi-annual timescale compared to long-term climate projections or climatological forecasts (Caron et al 2015, Hewitt et al 2017).
Although there are exceptions (Kruschke et al 2014, 2015, Camp and Caron 2017, Caron et al 2018), most of the studies that evaluated initialized decadal predictions tend to assess the predictive skill and the robustness of essential climate variables such as near-surface temperature and precipitation both at the global (e.g. Corti et al 2012, van Oldenborgh et al 2012, Doblas-Reyes 2013b, Smith et al 2018) and local scale (e.g. Matei et al 2012, Mehrotra et al 2014, Mohino et al 2016). Over Europe, a number of studies have found skill in predicting mean summer temperature (Müller et al 2012, Mieruch et al 2014), summer precipitation (Guemas et al 2015, Dunstone et al 2018, Yeager et al 2018) as well as extremes of both daily temperature and precipitation (Eade et al 2012, Hanlon et al 2013, 2015) using different initialized forecast systems. These studies found a significant skill at predicting the essential climate variables on a multi-annual timescale and generally agree that a significant portion of that skill is linked to the long-term warming trend associated with the increase in anthropogenic greenhouse gases, although the relative influence of natural variability and external forcings on the forecast skill varies with regions.
While essential climate variables are useful in indirectly accounting for the evolution of the drought conditions (Wilhite 2000, Taylor et al 2013), drought assessment studies have traditionally relied on a variety of indices, which themselves rely on essential climate variables, as proxies for a more realistic representation of the drought conditions (Palmer 1965). Skilful predictions of such indices could be highly valuable for decision-makers by, for example, providing risk managers with additional tools to assess the possible evolution of drought conditions. Up until now, little attention has been given to the evaluation of drought conditions using drought indices in decadal predictions and, particularly, on the added value of initialized predictions over uninitialized climate simulations. An exception to this is a recent study by Paxian et al (2019) who analysed the predictive skill of a forecast system at forecasting various 12 month integrated drought indices at the global scale. However, to the best of our knowledge, no study has yet assessed the regional skill of decadal prediction systems at forecasting the seasonal evolution in drought conditions using proxy drought indices at the multi-annual timescale.
In this context, this work aims at assessing the predictive skill of initialized decadal predictions at forecasting summer drought conditions over Europe on a multi-annual timescale using the SPEI and SPI indices integrated over a 6 month period as well as their individual components in order to assess to what extent these components contribute to the overall skill. We also investigate the improvement in the skill due to the initialization of the climate models. These climate models are introduced in section 2 along with the description of the bias-adjustment technique, the steps to compute the drought indicators and the forecast quality measure used for this assessment. Section 3 presents the predictive skill of the initialized decadal prediction and the added value it holds over uninitialized simulations. We conclude with some final remarks in section 4.
2. Methodology
2.1. Data
This study uses a comprehensive set of decadal hindcasts from six different decadal forecast systems that were produced as part of the Coupled Model Intercomparison Project Phase 5 (CMIP5; Taylor et al 2012) and the European Union's Seventh Framework Programme for Research (FP7)—SPECS project (Matei et al 2012, Caron et al 2018), to build a large multi-model ensemble forecast. A list of decadal forecast systems, the number of realizations, and the spatial resolution for each individual model is presented in table 1.
Table 1. Models used for multi-model analysis.
| Ensemble members | |||||
|---|---|---|---|---|---|
| Model | Forecast centre | Reference | INIT | NoINIT | Resolution |
| CanCM4 | Canadian Centre for Climate Modelling and Analysis, Environment and Climate Change Canada | Fyfe et al (2011), Merryfield et al (2013) | 10 | 10 | 2.8° |
| EC-Earth v2 | Barcelona Supercomputing Centre, Spain | Hazeleger et al (2010, 2013), Du et al (2012) | 5 | 10 | 1.1° |
| GFDL-CM2p1 | Geophysical Fluid Dynamics Centre, USA | Delworth et al (2006), Yang et al (2013) | 10 | 10 | 2° × 2.5° |
| HadCM3 | Met Office Hadley Centre, UK | Smith et al (2013) | 10 | 10 | 2.5° × 3.75° |
| MIROC5 | University of Tokyo, National Institute for Environmental Studies, and Japan Agency for Marine-Earth Science and Technology, Japan | Watanabe et al (2010) | 6 | 3 | 1.4° |
| MPI-ESM-LR | Max Planck Institute for Meteorology, Germany | Pohlmann et al (2013) | 3 | 3 | 1.9° |
For each forecast system, we use two different sets of experiments. The first set, referred to as 'INIT', corresponds to 10 year initialized hindcasts that were run by explicitly prescribing the contemporaneous state of the climate system at the start of the simulation. These hindcasts were initialized every year from 1960 to 2005 either on 1 November or the following 1 January depending on the system. However, to simplify the construction of large multi-model ensemble, we discard the first two months when the forecast system is initialized in November. The second set, referred to as NoINIT', is a corresponding ensemble that is not initialized and which is used as a reference to investigate the impact of initialization. The non-initialized data comes from the historical simulations up to 2005 and the RCP4.5 scenario thereon. Both ensembles include changes in natural and anthropogenic radiative forcings, derived from observations until 2005 and from the CMIP5 RCP4.5 scenario thereafter. A total of 44 members are available for INIT and 46 members for NoINIT simulation. However, in order to make a fair assessment of the impact of initialization, we restrict the large multi-model ensembles such that they have an equal number of members for each model (the number of members for each model is chosen as the minimum of INIT or NoINIT). Therefore, only 41 members, i.e. the first 10,5,10,10,3,3 ensemble members from the CanCM4, the EC-Earth v2, the GFDL-CM2p1, the HadCM3, the MIROC5 and the MPI-ESM-LR forecast system respectively, are used to construct the multi-model ensemble forecast.
To evaluate these hindcasts, we use GHCN-CAMS Version 2 (Fan and van den Dool 2008) as observational reference for near-surface temperature and GPCC Version 7 (Schneider et al 2018) for precipitation. GHCN-CAMS Version 2 is a gridded dataset, where the temperature data are taken from GHCN version 2 (Peterson and Vose 1997) and CAMS (Janowiak 1999). This dataset is available on a global 2.5° × 2.5° grid from 1948 to near present. GPCC Version 7 provides monthly totals of precipitation from 1901 to near present on a global 0.5° × 0.5° grid. These two datasets are selected due to their temporal and geographical coverage and their spatial resolution.
In order to allow for the comparison between simulations and observations, the values of the climate variables are interpolated using a conservative approach, from their original grid onto a 2.5° latitude by 3.75° longitude grid, which is identified as the coarsest grid among the model and reference dataset considered here.
2.2. Data preprocessing
Predicted climate variables such as temperature and precipitation that are used in this assessment suffer from systematic errors. This causes the forecast system's climatology to be different to that of the observed (Doblas-Reyes et al 2013b). In this study, the lead-time dependent biases in temperature and precipitation are adjusted using a simple mean bias-adjustment technique (as recommended by ICPO 2011) in leave-one-out cross-validation mode to emulate the real-time operational forecast conditions where the observed state of the future climate system is unavailable (Torralba et al 2017).
After the bias adjustment, the multi-model ensemble mean is computed assigning equal weights to the mean of each individual forecast system.
2.3. Computation of agro-climatic indices
We assess the skill of climate models at forecasting changes in European summer drought conditions over the forecast years 1–5 using two drought indices: Standardized Precipitation Index (SPI; Mckee et al 1993) and Standardized Precipitation Evapotranspiration Index (SPEI; Vicente-Serrano et al 2010). These indices are chosen primarily due to their widespread acceptance by the agricultural user community as a representative of drought conditions at the European level in recent years (Spinoni et al 2015). SPI is estimated based on monthly precipitation (P) and accounts for drought events induced by the lack of rainfall, whereas the SPEI uses monthly climatic water balance (defined as the difference between monthly precipitation and potential evapotranspiration (PET)) and as such also incorporates the effect of temperature changes on the evolution of drought events. We target our study on the summer months of July to September specifically because drought conditions during this period can severely impact crop production over Europe (Turco et al 2017, Zampieri et al 2017, Ceglar et al 2018).
The computation of the drought indices is performed in two steps: accumulation and standardization. First, for each index, the monthly mean values of the climate variables (precipitation for SPI, and the difference between precipitation and PET for SPEI) are summed over six months (including the target month), which is commonly referred to as the accumulation period. In this assessment, the six-month accumulated precipitation and PET values are referred to as P6 and PET6 respectively. For instance, the P6 value for the month of July is obtained as the sum of estimated February to July precipitation values for a specific year. As we aim to analyse the skill of the forecast systems at the multi-annual timescale, the accumulated forecast and its corresponding observed values are averaged over five years for each summer month. For example, the multi-annual average of accumulated precipitation (forecast years 1–5) for the month of July of the forecast initialized on January 1961 is the average of the 1961–1965 July accumulated values, and for the forecast initialized on January 1962, the average is obtained with the 1962–1966 July accumulated values, and so on. We choose to use a five-year average as it has been widely accepted to potentially remove a large fraction of the interannual variability present in the decadal climate information (García-Serrano and Doblas-Reyes 2012, Goddard et al 2013). In addition, it also holds high potential to support the users in making strategic decisions and manage their risks (for e.g. associated with agricultural production, market prices and disaster response) in the near future (Bruno Soares et al 2018).
The multi-annual averaged data is then fitted to a suitable parametric probability distribution and transformed into a standardized series (with mean = 0 and standard deviation = 1) (Mckee et al 1993, Stagge et al 2015), where the standardized value is referred to as SPI6 and SPEI6. We use two-parameter gamma distribution to transform the multi-annual averages of accumulated precipitation to standardized units for obtaining SPI6, and a three-parameter shifted log-logistic distribution is used to fit the climate balance values for SPEI6. The choice of the parametric probability distribution are verified and the assumption was shown to be valid over large parts of Europe (for e.g. Stagge et al 2015, Vicente-Serrano and Beguería 2016). For this assessment, despite the availability of several approaches (see, Beguería et al 2014) to estimate PET, we choose the classical temperature-based Thornthwaite method (Thornthwaite 1948), owing to its simplicity and limited data requirements. The parameterization used for estimating land-surface evapotranspiration using this approach is based solely on monthly mean temperatures and latitude coordinates, the latter variable being used to calculate the maximum amount of sunshine duration. A detailed description of each step is presented in the supplementary material is available online at stacks.iop.org/ERL/14/124014/mmedia.
2.4. Forecast quality assessment
In this study, we use the standard Pearson correlation coefficient to assess the skill of the ensemble mean at forecasting the SPEI6 and SPI6 at the multi-annual timescale. The correlation coefficient measures the linear relationship between the forecasted and observed index time series. Two different verification measures are employed to assess the skill improvement due to initialization of the decadal forecast system: correlation difference and residual correlation. The former measure is the absolute difference in correlation values of the INIT and NoINIT hindcasts against observation. It is the most commonly used skill measure to assess the contribution of the internally generated climate variability component to the multi-annual predictive skill (Siegert et al 2017). However, it has been pointed out by some studies (Siegert et al 2017, Smith et al 2019) that using correlation difference for two highly correlated hindcasts underestimates the impact of initialization. Therefore, in order to determine whether initialization adds any additional information compared to the uninitialized forecast in the areas where both INIT and NoINIT return high correlation values, we apply the residual correlation methodology recently suggested by Smith et al (2019). In this approach, the residuals of INIT and observed index time series are correlated after linearly regressing out the NoINIT ensemble mean.
We consider a correlation or a correlation difference significant only if it reaches the 95% confidence level. For correlations, this is computed by performing a one-tailed t-test, after a Fisher Z-transformation whereas the statistical significance of correlation differences is estimated using a modified Fisher transformation as described in Siegert et al (2017), to account for the dependence of sharing the same observations in computing INIT and NoINIT correlation coefficients. In both cases, we also take into account the autocorrelation of the hindcast and the observational time series by computing an effective sample size, which represents the number of independent data points in the time series (Von Storch and Zwiers 2001). In highly autocorrelated time series (such as those used here), the effective sample size is noticeably lower than the total sample size. This last step is necessary in order to avoid systematically overestimating the significance of the correlation (Von Storch and Zwiers 2001, Guemas et al 2014).
3. Results
3.1. Predictive skill of drought indices
This section presents the forecast quality assessment of multi-annual averages of the drought indices for the forecast years 1–5 over Europe and illustrates the improvement in skill due to initialization by comparing INIT to NoINIT. The multi-model ensemble-mean correlation, which is the forecast skill metric used, of the forecasted SPEI6 with INIT against the observed SPEI6 time series for July, August and September is shown in figures 1(a)–(c). Initialized decadal simulations yield positive skill over most of Southern Europe. The rest of the European region generally returns non-significant correlation for any of the three months, except over Central Europe.
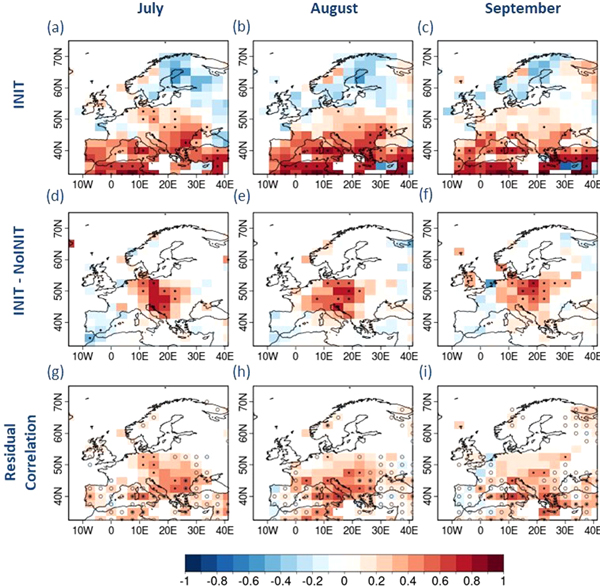
Figure 1. Multi-model ensemble-mean correlation coefficients of the forecasted SPEI6 against the observed SPEI6 for the summer months (July–September) averaged over forecast years 1–5. The first row corresponds to the correlation of the initialized decadal simulations (INIT) while the second row shows the difference in correlation between initialized and uninitialized climate simulations (INIT-NoINIT). The third row corresponds to the correlation of residual between INIT hindcasts and observational reference SPEI6 time series obtained by linearly regressing out the NoINIT ensemble mean. The open circle represents the region with correlation difference between −0.2 and 0.2. For the second and third row, the impact of initialization is only shown for the regions exhibiting positive correlation values with INIT. Dotted grid boxes represent values statistically significant at 95% confidence level for SPEI6.
Download figure:
Standard image High-resolution imageFigures 1(d)–(f) shows the difference in correlation between initialized and uninitialized simulations for the regions where initialized forecasts return positive skill. It shows significant improvement (dotted red coloured areas) over most of Central Europe and the Balkan region for all three summer months. Figures 1(g)–(i) presents the residual correlation wherein the residuals of initialized and observed SPEI6 time series are correlated after linearly regressing out the ensemble mean of NoINIT. With this technique, we notice that the benefit derived from initialization is also found over large parts of Southern Europe: the skill over Italy, Turkey and the Balkan region are found to have improved for all the summer months, improvement which was not detected with a simple correlation difference (grids cells with open circles in figures 1(g)–(i)).
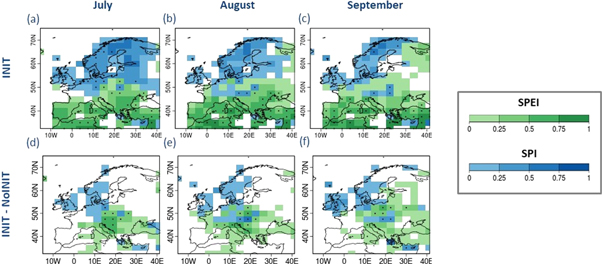
Figures 2(a)–(c) presents the ensemble-mean correlation between INIT and observed SPI6 time series for the three summer months. It shows positive skill over the Scandinavian region and over Central Europe, especially in July. Figures 2(d)–(f) shows the impact of initialization of the decadal forecast system in predicting SPI6. The skill over the Balkan region and Italy stand out as having significant improvement due to initialization in this case. The significant improvement, which is not trivial and occurs where some of the largest cereal producers in Europe are located, is clearly visible over these regions for July and August, if somewhat less so in September. We also present the residual correlation of the observed and initialized hindcasts SPI6 time series (figures 2(g)–(i)). The improvement in predictive skill of SPI6 due to initialization is found to be more limited in this case, with most of the improvement being relatively modest and concentrated over Central Europe and southern Scandinavia.
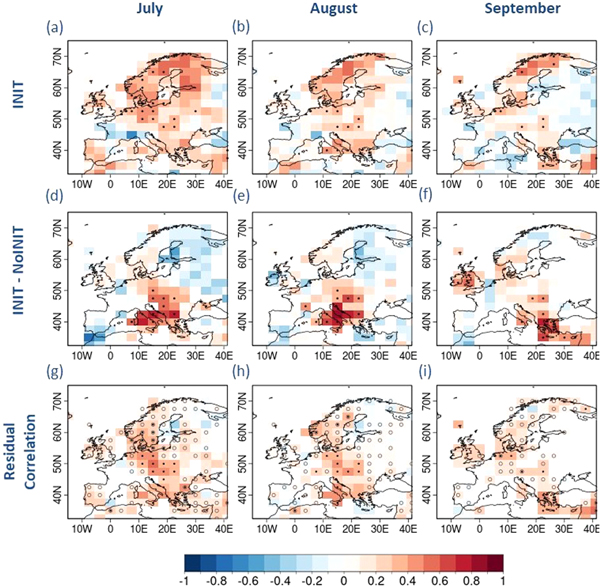
Figure 2. Same as figure 1 but for the Standardized Precipitation Index (SPI6).
Download figure:
Standard image High-resolution imageHowever, it is important to note that the precipitation based indices such as SPI6 are formulated based on two primary assumptions: (1) the variability of the observed precipitation is higher than that of other climate variables such as temperature and potential evapotranspiration, (2) the other variables show no significant trend over the region considered (Vicente-Serrano et al 2010, 2012). We found the accumulated precipitation to exhibit higher variability in comparison to accumulated temperature and PET6 (figure S1). On the other hand, the observed trend in temperature and PET6 are non-negligible in comparison to the precipitation (figure S2). This indicates that the assumptions are only partially valid and therefore a more detailed assessment on how strongly the drought evolution is related to a deficit in the rainfall amounts is required before using SPI6, irrespective of the positive skill detected over several parts of Europe.
3.2. Assessment of individual components of the drought indices
Assessing the contribution of multi-annual averages of 6 month accumulated potential evapotranspiration (PET6) and precipitation (P6) values to the skill obtained by SPEI6 and SPI6 will help in understanding the reason behind the predictive skill over the areas of interest. As a first step, an evaluation of the predictive skill of the accumulated climate variables (P6 and PET6) is performed. Then, the relation between the accumulated climate variables and the drought indices (SPEI6 and SPI6) is illustrated, both in the observation and modelled climate. These assessments are solely presented for the month of July for the sake of illustration. The main conclusions remain valid for the months of August and September (see, figures S3–S6).
Figure 3(a) displays the ensemble mean correlation of accumulated PET6 averaged over the forecast years 1–5 between INIT and the observational reference time series for the month of July. For a specific year, PET6 of July is obtained as the sum of estimated February to July PET values. Initialized decadal simulations show statistically significant positive skill over most of the domain. The high skill in PET6 is found to be inherited from the skill in predicting near-surface temperature over Europe (not shown), as the temperature-based Thornthwaite approach is used to compute the monthly potential evapotranspiration in this assessment. Initializing the decadal forecast system is found to have only marginally increased the PET6 predictive skill (figure 3(b)), which suggests that most of the skill in PET6 is indirectly due to the long-term global warming trend. However, as previously stated, correlation differences between two highly correlated hindcasts (such as the accumulated summer PET6 values obtained from both INIT and NoINIT simulation) underestimates the impact of initialization. So, we present the residual correlation in figure 3(c). Statistically significant positive residual correlations of accumulated PET6 for the month of July can be found over several parts of Europe, thus highlighting the positive impact of initialization on the predictive skill of PET6 over that region despite the absence of significant differences in correlation.
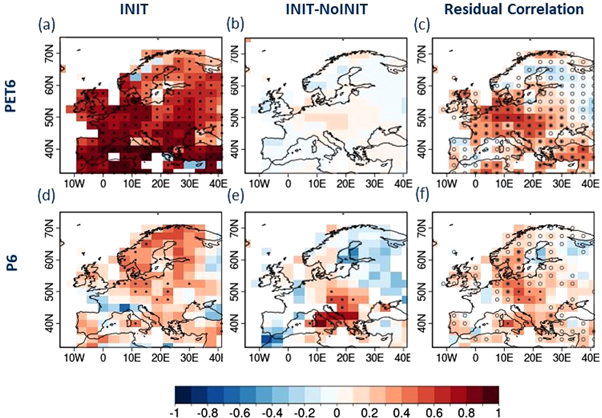
Figure 3. Multi-model ensemble-mean correlation coefficients of the accumulated PET6 (top) and P6 (bottom) forecasts against the corresponding observational reference time series for the month of July averaged over forecast years 1–5. The first column corresponds to the correlation of the initialized decadal simulations (INIT) while the second column show the difference in correlation between initialized and uninitialized climate simulations (INIT-NoINIT). The third column corresponds to the correlation of residual between INIT hindcasts and observational reference time series obtained by linearly regressing out the NoINIT ensemble mean. The open circle represents the region with correlation difference between −0.2 and 0.2. Dotted grid boxes represent values statistically significant at 95% confidence level for PET and precipitation.
Download figure:
Standard image High-resolution imageFigure 3(d) presents the ensemble mean correlation of forecasted P6 time series against the observational reference for the month of July averaged over the forecast years 1–5. The skill in predicting P6 is much lower in comparison to PET6 over most parts of the domain. Positive skill is found almost exclusively over Scandinavia and Northern Central Europe. Figure 3(e) shows the differences in the correlation between INIT and NoINIT simulations. There are positive and significant correlation differences over Italy and the Balkan region. In contrast to PET6, the residual correlation of P6 shows more limited improvement due to initialization (grids with open circles in figure 3(f)) over Central Europe and Southern Scandinavia.
To enhance our understanding of the effect of the individual accumulated climate variables (PET6 and P6) on SPEI6, the correlation of the observed and forecasted SPEI6 with the corresponding climate variables are presented. The observed response of SPEI6 to PET6 and P6 for the month of July is shown in figures 4(a) and (d) respectively. Over the lower latitudes, the correlations are found to be of similar magnitudes for PET6 and P6, while at higher latitudes, the influence of P6 generally seems to dominate, which implies that PET6, and incidentally temperature, has less of an impact on drought condition at higher latitudes.
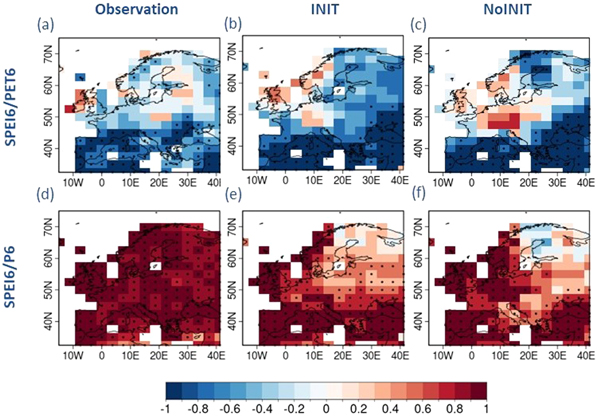
Figure 4. Correlation of observed SPEI6 versus six-month accumulated PET (a) and precipitation (d) for the month of July. (b), (e) and (c), (f) as (a), (d) but for the initialized and uninitialized ensemble mean hindcasts respectively. Dotted grid boxes represent values statistically significant at 95% confidence level.
Download figure:
Standard image High-resolution imageTo assess whether this relationship is captured by the decadal forecast system, a similar calculation is repeated using the initialized and uninitialized hindcasts (figures 4(b), (e) and (c), (f), respectively). It is found that the relative influence of PET6 (compare figures 4(a), (b)) and P6 (compare figures 4(d), (e)) on SPEI6 seems to be reasonably well captured by the initialized simulation over the lower latitudes while at higher latitudes, the influence of PET6 (P6) on SPEI6 index seems to be more (less) pronounced. Similar responses were found using NoINIT (figures 4(c) and (f)), with a noticeable difference over Central Europe, where we detect a spurious positive correlation between SPEI6 and PET6 in NoInit.
3.3. Contribution of PET6 and P6 to the total skill of drought indices
By comparing the forecast quality of the accumulated climate variables and the influence of these variables on SPEI6, the reason behind the overall SPEI6 skill can be better understood. From this comparison, we found that two factors have significantly contributed to the positive skill in forecasting SPEI6 (month of July, i.e. figure 1(a)), particularly at the lower latitudes.
- The high predictive skill exhibited by the forecast systems in predicting P6 and PET6 (figure 3).
- The system's ability to represent adequately the relative influence of the accumulated climate variables on SPEI6 (compare figures 4(a) and (d) with figures 4(b) and (e)).
On the other hand, despite positive skill at predicting PET6 (figure 3(a)) and P6 (figure 3(d)) over higher latitudes, particularly over Scandinavia, the inability of the model to adequately represent the relative influence of these accumulated climate variables on SPEI6 have potentially lead to low skill in predicting SPEI6 in those regions. For instance, at higher latitudes, the observed SPEI6 seems to be dominated by the variability in accumulated precipitation compared to PET6, whereas with the initialized decadal prediction, an overestimation of the influence of PET6 on SPEI6 has masked the impact of observed accumulated precipitation in those regions (compare figures 4(a), (d) with (b), (e)). This shows the importance of correctly identifying the relative influence of both PET6 and P6 on the drought index based on the water balance.
The improvement in the predictive skill of SPEI6 due to initialization (the month of July in figure 1(b)) over Central Europe is linked to improved predictive skill of PET6 and P6 (figures 3(c), (e) and (f)), and a better representation of the respective influence of PET6 and P6 on SPEI6 by INIT in comparison to NoINIT (figure 4). As for SPEI6, by comparing the skill of SPI6 against precipitation for the month of July (figures 2(a), (d), (g) and 3(d), (e), (f)) with initialized decadal simulations, the contribution of the precipitation prediction skill to the total SPI6 skill and their improvement over NoINIT can be clearly linked to the forecast systems ability to predict six-month accumulated precipitation values since SPI6 is entirely dependent on this single variable. These assessments were repeated for the months of August (figures S3 and S5) and September (figures S4 and S6), and the primary outcomes remained unchanged.
4. Discussion and conclusions
This work explores the ability of initialized decadal forecast systems at predicting drought conditions over Europe, an important first step in determining whether these products can provide useful, and ultimately actionable, information to stakeholders in the agricultural sector, a sector that has been identified as one of the most vulnerable to climate-related risks (Bruno Soares et al 2018). In particular, we have assessed the forecast quality of a multi-model ensemble of initialized decadal hindcasts constructed with systems produced within the context of CMIP5 and of the FP7 SPECS project to predict two agro-climatic indices (SPEI6 and SPI6) for the summer months of July–September. In parallel, we compared the initialized experiments with the uninitialized historical simulations in order to address the relative roles of initialization and external forcing in providing multi-annual predictive skill.
The results show significant skill in predicting five-year averages (forecast years 1–5) over several parts of the domain. Interestingly, higher skill is found for SPEI6 over Southern and Central Europe while SPI6 exhibits higher skill over the Scandinavian region and Northern Europe more generally. Investigation of the individual components of these indices revealed that the predictive skill of the considered indices primarily relies on two factors: (1) the forecast systems ability to predict the climate variables that are used to compute both the indices; (2) the ability of the climate forecast systems to capture the observed influence of each component on the corresponding drought indices.
The different level of skill of the two drought indices over different regions (figures 1 and 2) can be exploited to create a tailored product for decision-makers. A combined map based on the maximum correlation coefficients of SPEI6 or SPI6 (figure 5), as an illustration, could be valuable for decision-makers and inform them about the drought index that returns the largest skill over a given area. However, we highlight that the studied drought indices are developed for different purposes and aim at capturing varied features of drought events (Mishra and Singh 2010). For instance, the usage of precipitation based SPI6 index are only appropriate in specific regions, where the evolution of drought primarily relies on the temporal variability in precipitation (Mckee et al 1993) and therefore, care should be taken while using SPI6 as a stand-alone indicator for assessing drought conditions, despite the maximum positive correlation values found over several parts of Europe.
Figure 5. Maximum positive correlation values among the considered drought indices with initialized decadal prediction (first column) during the summer months (July–September) over the European region. Green and blue colour indicate the maximum correlation obtained with the SPEI6 and SPI6 respectively. The second column presents the (positive) correlation difference between the best performing drought index in the initialized forecasts and the best performing drought index in the uninitialized forecasts (left and right column, respectively). Negative correlations appear in white. For the third column, the colour is that of the Init ensemble.
Download figure:
Standard image High-resolution image
By assessing the differences of skill obtained with initialized and uninitialized hindcasts, initialization was found to improve the skill over Central Europe for SPEI6, whereas SPI6 exhibited improved skill over the Balkan region. However, this approach has shown to systematically underestimate the impact of initialization over the regions, where both initialized and uninitialized forecast are able to capture the common signals that arise due to external forcings (i.e. grids with low correlation difference in figures 1(d)–(f), 2(d)–(f)). To account for this, a residual correlation' approach (Smith et al 2019) was used. With residual correlation, we illustrate a marginal improvement in skill over the Balkan region for SPEI6 and over Central Europe and Southern Scandinavia for SPI6. This highlights further benefits of initialization over the regions where simple correlation difference failed to showcase any improvement in skill.
This study is the first to assess the multi-year predictive skill of seasonally varying drought conditions over Europe. The encouraging results presented here suggest further analyses. For instance, several studies that have assessed the impact of choosing a particular parametric probability distribution for computing the drought indices (Stagge et al 2015, Vicente-Serrano and Beguería 2016) and the influence of different methods to estimate PET (Beguería et al 2014) have pointed out that different choices leads to varied estimates of drought frequency and severity in some regions over Europe. Therefore, exploring other advanced techniques of PET estimation and standardization procedure could potentially improve our results. In addition, evaluating SPEI and SPI at different user-relevant spatio-temporal scales (Vicente-Serrano et al 2012), investigating different multi-model approaches (Delsole et al 2013, Mishra et al 2018) and applying downscaling strategies (Reyers et al 2015, Benestad et al 2019) to provide reliable information at a more local scale are all different avenues which we are currently considering exploring in future analyses.
Acknowledgments
We would like to acknowledge financial support from the European Union's Horizon 2020 Research and Innovation programme (EUCP; Grant No. 776613 and MED-GOLD; Grant No. 776467) and from the Ministerio de Economía y Competitividad (MINECO) as part of the CLINSA (Grant No. CGL2017-85791-R) and HIATUS (Grant No. CGL2015-70353-R) projects. BSM acknowledges additional financial support from the Marie Sklodowska-Curie fellowship (Grant No. 713673) and from a fellowship of 'la Caixa' Foundation (ID 100010434). The fellowship code is LCF/BQ/IN17/11620038. Most of the analysis was performed using s2dverification (Manubens et al 2018), a R-language-based software package for skill assessment. We thank the two anonymous reviewers for their invaluable comments on the manuscript. Finally, BSM also acknowledges the useful discussions and suggestions from Andrea Toreti, Marco Turco, Andrej Ceglar and Matteo Zampieri, and as well as thanks Veronica Torralba, Raul Marcos, Pierre-Antoine Bretonnière and Margarida Samso Cabre for providing technical support during various stages of this work.
Data Availability
The data that support the findings of this study are openly available at https://esgf-index1.ceda.ac.uk/projects/esgf-ceda/.