

Abstract
Terrestrial and oceanic carbon sinks together sequester >50% of the anthropogenic emissions, and the major uncertainty in the global carbon budget is related to the terrestrial carbon cycle. Hence, it is important to understand the major drivers of the land carbon uptake to make informed decisions on climate change mitigation policies. In this paper, we assess the major drivers of the land carbon uptake—CO2 fertilization, nitrogen deposition, climate change, and land use/land cover changes (LULCC)—from existing literature for the historical period and future scenarios, focusing on the results from fifth Coupled Models Intercomparison Project (CMIP5). The existing literature shows that the LULCC fluxes have led to a decline in the terrestrial carbon stocks during the historical period, despite positive contributions from CO2 fertilization and nitrogen deposition. However, several studies find increases in the land carbon sink in recent decades and suggest that CO2 fertilization is the primary driver (up to 85%) of this increase followed by nitrogen deposition (∼10%–20%). For the 21st century, terrestrial carbon stocks are projected to increase in the majority of CMIP5 simulations under the representative concentration pathway 2.6 (RCP2.6), RCP4.5, and RCP8.5 scenarios, mainly due to CO2 fertilization. These projections indicate that the effects of nitrogen deposition in future scenarios are small (∼2%–10%), and climate warming would lead to a loss of land carbon. The vast majority of the studies consider the effects of only one or two of the drivers, impairing comprehensive assessments of the relative contributions of the drivers. Further, the broad range in magnitudes and scenario/model dependence of the sensitivity factors pose challenges in unambiguous projections of land carbon uptake. Improved representation of processes such as LULCC, fires, nutrient limitation and permafrost thawing in the models are necessary to constrain the present-day carbon cycle and for more accurate future projections.
Export citation and abstract BibTeX RIS

Original content from this work may be used under the terms of the Creative Commons Attribution 3.0 licence. Any further distribution of this work must maintain attribution to the author(s) and the title of the work, journal citation and DOI.
1. Introduction
Fossil fuel combustion in the industrial era has perturbed the global carbon (C) cycle by releasing a significant amount of CO2 to the atmosphere (IPCC 2013). Terrestrial and oceanic carbon uptake offset the anthropogenic emissions of CO2 by absorbing more than half of these emissions. The land biosphere gains carbon during photosynthesis (as measured by gross primary production (GPP) on large scales), and it releases carbon through respiration (both autotrophic and heterotrophic respiration−Rh). The land can be a sink or source of carbon to the atmosphere depending on the balance between the uptake and the net respiratory flux of carbon to the atmosphere.
The terrestrial biosphere is a sink for carbon in recent decades due to mainly the increases in net primary production (NPP = GPP − Rh), driven by the increases in atmospheric CO2 (Friedlingstein et al 2010, Le Quéré et al 2015, 2018, Sitch et al 2015, O'Sullivan et al 2019). Modeling studies also project changes in the land carbon uptake in future scenarios in response to the changes in climate forcings (e.g. Lawrence et al 2012, Brovkin et al 2013, Davies-Barnard et al 2014, Jones et al 2013, Tharammal et al 2019). As the land carbon cycle presents the largest uncertainty in constraining the global carbon budget (IPCC 2013, Jones et al 2013, Friedlingstein et al 2014, Brovkin and Goll 2015, Sitch et al 2015, Wieder et al 2015) it is crucial to assess the drivers of changes in the land carbon sinks in the recent past (historical period), recent decades, and in the projections of future climate.
Several studies (e.g. Canadell et al 2007, Bala et al 2012, Piao et al 2013, Shevliakova et al 2013, Devaraju et al 2016, Zhu et al 2016, Tharammal et al 2019) have identified CO2 fertilization, nitrogen (N)-deposition, climate change, and land use/land cover changes (LULCC) as the major factors that affect the terrestrial primary production and land carbon uptake (figure 1). CO2 fertilization increases photosynthesis (figure 1) and NPP due to the direct effect of increases in atmospheric CO2 (Farquhar et al 1980, Kimball et al 1993, Thornton et al 2007, Kimball 2010). Availability of nutrients (mainly N and phosphorus (P)) could limit the primary production, even at higher CO2 levels. Modeling studies have found that N is a key limiting factor for most of the temperate and boreal ecosystems (Sokolov et al 2008, Zaehle et al 2010b, Bala et al 2012, Fisher et al 2012, Goll et al 2012). Reactive forms of nitrogen (Nr)—the reduced NHx and oxidized form NOy are created mainly by human activities (e.g. Haber-Bosch process and fossil fuel combustion), and increased N-deposition stimulates vegetation productivity. Therefore, the future land carbon uptake is expected to partly depend on the changes in the N-deposition rates driven by anthropogenic activities.
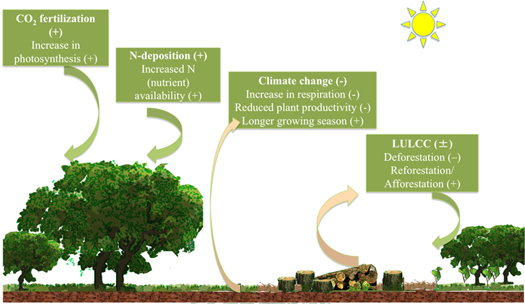
Figure 1. Schematic of the major four drivers (CO2 fertilization, nitrogen (N)-deposition, climate change, and land use and land cover changes—LULCC) of land carbon uptake. Downward arrows represent the carbon flux into the ecosystem. Upward arrows represent the carbon flux from the land to the atmosphere. Positive (+) and negative (–) signs denote the effect of the factor on the land carbon uptake.
Download figure:
Standard image High-resolution imageIncreased CO2 in the atmosphere leads to climate change, which affects the temperature, precipitation, length of the growing season, and heterotrophic respiration. Increases in precipitation and length of the growing period can lead to increased NPP (figure 1), whereas, reduced precipitation and increased temperature (in the tropics) could limit NPP. A warmer climate increases heterotrophic respiration and reduces the net ecosystem production (NEP = NPP − Rh), and hence, weakens the land sink. The ∼5% increase in the air-borne fraction of CO2 emissions in the last 50 years is attributed to the reduction in the land and oceanic carbon sinks, in response to climate change (Le Quéré et al 2009).
LULCC fluxes include changes in the land carbon fluxes due to deforestation, afforestation, wildfires, wood harvesting, grazing and shifting cultivation. The effects of LULCC include both biogeophysical (changes in surface albedo, evapotranspiration, surface roughness) and biogeochemical processes (Feddema 2005, Bala et al 2007, Boysen et al 2014), which can affect both regional and global climate. Cumulative LULCC contributed ∼25% to the total carbon emissions during the period 1870–2015 (Le Quéré et al 2018). However, the annual contribution of LULCC to total emissions has reduced to ∼10% during recent decades (Houghton 2012, Le Quéré et al 2015, Houghton and Nassikas 2017).
Atmospheric CO2 concentration has increased by more than 40% since the pre-industrial period (∼280 to ∼410 ppm; Meinshausen et al 2011, Ciais et al 2013) and the global mean temperature has increased by about 1 °C (IPCC 2013), while N-deposition rates increased from ∼30 TgN yr−1 in 1850 to ∼80 TgN yr−1 in the 2000s (Lamarque et al 2013, Kanakidou et al 2016). During the industrial era, forests were converted to croplands and pastures to accommodate the increase in population and hence, agriculture.
Climate models constitute an important tool to estimate the contribution of the aforementioned four drivers to the land carbon uptake. The fifth phase of the Coupled Model Intercomparison Project (CMIP5, Taylor et al 2012) includes a range of simulations conducted for the historical period and future climate scenarios with Earth System Models (ESMs) that incorporate a full representation of global carbon cycle when compared to earlier CMIP phases. The projections for the 21st century from the CMIP5 models are based on four different socio-economic scenarios, termed as Representative Concentration Pathways (RCPs) (Moss et al 2010), which differ by the extent of climate mitigation policies. The majority of CMIP5 models agree with the observationally constrained estimates that the land was a source of carbon to the atmosphere during the historical period (Jones et al 2013). For the 21st century, results from CMIP5 show a large spread in land carbon fluxes and stocks (Jones et al 2013, Friedlingstein et al 2014).
Although many published model-based studies assess the changes in regional and global land carbon uptake during the historical period and in the projections of future climate, only few studies have analyzed the role of the drivers of these changes. In this paper, using mainly the results from CMIP5 coupled models that include a land carbon cycle component, we synthesize the results from published literature and provide a comprehensive review of the major drivers of changes in the land carbon uptake during the historical and three future RCP scenarios—RCP2.6 (high mitigation scenario, the radiative forcing in the scenario by 2100 is 2.6 W m−2; Van Vuuren et al 2007), RCP4.5 (medium mitigation, radiative forcing in the scenario is 4.5 W m−2; Thomson et al 2011), and RCP8.5 (high emission scenario, radiative forcing in the scenario is 8.5 W m−2; Riahi et al 2007). The RCP2.6 and RCP8.5 scenarios are associated with extensive deforestation, increases in the N-deposition, and increases in CO2, while the RCP4.5 scenario includes afforestation and a reduction in N-deposition rates by 2100. A detailed overview of the climate forcings in the historical and the RCP scenarios is given in section 2.2.
2. Methods
2.1. Selection of literature
The studies included in this review are selected based on the relevancy of the topic, period of time and climate scenarios assessed, geographical scale (mostly global), and importantly whether they analyze one or more of the four major drivers. We selected recent (mostly from 2010 to present) peer-reviewed publications on the land carbon sink and drivers of land carbon uptake based mainly on the authors' experience in the subject. The web-based list of CMIP5 publications (https://cmip-publications.llnl.gov/) is utilized to select some of the literature. Further, literature searches with the keywords and combinations of 'recent trends in land carbon uptake, TRENDY historical land carbon, CMIP5 RCP land carbon drivers, CO2 fertilization, nitrogen deposition, LULCC, LUC, deforestation, climate warming, drivers of terrestrial land carbon' were conducted with web-based search engines such as Google Scholar and Mendeley with cross-referencing from other journal websites.
The studies discussed here are dominantly based on the CMIP5 experiments and sensitivity experiments performed using dynamic vegetation models (DGVMs). We discuss the results from fully coupled CMIP5 historical simulations from the year 1850 to 2005 and simulations using RCP scenarios for the 21st century projections. Further, we include land model studies that analyze the changes in the land carbon sink in recent decades (in the past ∼30 years). The reason to choose the three RCP scenarios (RCP2.6, RCP4.5, and RCP8.5) is the availability of literature on scenario-based projections of carbon cycle changes. Table S1, available online at stacks.iop.org/ERL/14/093005/mmedia, provides a list of studies (with brief descriptions of the models used and the features/limitations of the studies) that analyzed the drivers of land carbon uptake in the historical and future scenarios. We select the studies that have analyzed the contributions of one or more of the four drivers (CO2 fertilization, N-deposition, climate change, and LULCC) to the net carbon uptake for the historical period and the RCP scenarios (e.g. Piao et al 2009, 2012, Brovkin et al 2013, Devaraju et al 2016, Huntzinger et al 2017, Piao et al 2018, Tharammal et al 2019; see table S1).
Only two of the models among the CMIP5 models—NCAR CESM and NorESM—include the C–N dynamics, and both these models share the same land model-Community Land Model-CLM4 (Oleson et al 2010). Published studies that estimate the relative contributions of the major factors to the changes in land carbon uptake in the future scenarios are limited. Brovkin et al (2013), as a part of the Land-Use and Climate, Identification of Robust Impacts project (LUCID, Boysen et al 2014) assessed the effects of LULCC on the total ecosystem carbon (TEC) in the RCP2.6 and RCP8.5 scenarios using five CMIP5 models. We select four of these five LUCID models (CanESM2, MIROC ESM, HADGEM2, and IPSL-CM5A-LR) to infer the contributions of CO2 fertilization and climate warming for these models by using the individual model's land carbon uptake sensitivity to CO2 (β in PgC ppm−1) and climate warming (γ in PgC K−1) taken from Arora et al (2013). We assume that the sensitivity factors for the RCP scenarios are comparable to those estimated from the quadrupled CO2 experiments by Arora et al (2013) (conducted by increasing the CO2 concentration by 1% yr−1 from the pre-industrial concentration of 285 ppm until concentration has quadrupled by 140 years). These four models lack N-limitation in their land carbon cycle model. The net change in the TEC in the RCP2.6 and RCP8.5 scenarios for the LUCID models are estimated from Jones et al (2013).
Apart from the fully coupled CMIP5 simulations, the results from TRENDY ('Trends and drivers of the regional scale sources and sinks of carbon dioxide', Sitch et al 2015; an ensemble of nine DGVMs forced by a common/observed climate forcing data) provide the factor-wise contribution to the historical land carbon uptake (years 1901–2010). TRENDY simulations have been used to assess contributions of CO2, climate, and LULCC on the net biome production (NBP) and land carbon uptake during the present-day and recent past (Piao et al 2013, Schimel et al 2015a, Sitch et al 2015, Li et al 2017, Le Quéré et al 2018). Similarly, Multi-scale Synthesis and Model Intercomparison Project (MsTMIP, Huntzinger et al 2013, 2017) assesses the major drivers of changes of the land C uptake during 1959–2010, using twelve land biosphere models (five of which include coupled C–N cycle). MsTMIP models are forced by the same climate records, N-deposition, and land use data (Huntzinger et al 2013). Further, recent studies on the assessments of historical and present-day land carbon budget (Le Quéré et al 2018), NPP, and leaf area index (LAI) values using satellite-based observations, land models, and bookkeeping methods (e.g. Zhang et al 2016, Zhu et al 2016, Mahowald et al 2016) are discussed in the paper. In general, for each period, we review the changes in global land carbon uptake from the modeling studies and observations, followed by discussions of the major drivers of these changes.
Besides, we review the sensitivity of the land carbon uptake to CO2, climate warming, and N-deposition using available model results in the published peer-reviewed literature. As a part of phase 3 of the Coupled Model Intercomparison Project (CMIP3), the Coupled Carbon Cycle Climate-Model Intercomparison Project (C4MIP, Friedlingstein et al 2006) provided a comparison of sensitivity factors for CO2 fertilization and climate change from eleven coupled climate-carbon cycle models. C4MIP models were forced by historical emissions and the IPCC Special Report on Emissions Scenarios (SRES) A2 scenario for the years 1850–2100. Another set of C4MIP studies accompanies CMIP5, and the sensitivity factors estimated from this project are analyzed by Jones et al (2013) and Arora et al (2013), which are briefly discussed in this review. Further, Bala et al (2012) provide a comprehensive analysis of the sensitivity factors.
This review focuses on the following variables for the land carbon cycle: NPP, LAI, NEP (NEP = NPP − Rh), NBP (NBP = NEP − fire-land use), and TEC. Increases in NPP or LAI ('greening') do not necessarily imply increases in the land carbon stock as the latter is also affected by changes in other variables such as Rh and LULCC. Our discussion will focus on global changes, and regional values will be discussed whenever available, and relevant to the context. We use a sign convention where the fluxes into the ecosystem are positive (land sink), and a –ve sign for the fluxes denotes land source. As the studies assessed in this review estimate the changes in land carbon fluxes and storage through different variables such as NBP, TEC, and NEP, we primarily discuss the contributions of major drivers in terms of the percent contribution of the factors to changes in the respective variables. As the sign of the changes could be positive or negative, following Zhu et al (2016) and Huntzinger et al (2017), we calculate the percent contribution of the individual factors from the literature as:
Percent contribution of individual factor = 100 × [absolute contribution of the individual factor/sum of absolute contributions of the factors].
2.2. An overview of the major drivers
For the historical period, apart from the increase in atmospheric CO2, climate warming, and increased nitrogen deposition rates (see Introduction), the estimated loss of primary land is ∼75 million km2 (125 million km2 in 1850 to 50 million km2 by 2005, see Hurtt et al 2011). The large deforestation for agriculture and wood harvest took place in high latitudes, specifically in central and eastern N. America, Europe, and SE Asia (Hurtt et al 2011). The global mean surface temperature increased by ∼0.6 °C–0.8 °C during the historical period (IPCC 2013) because of the net result of all the forcings including non-CO2 greenhouse gases (GHG), aerosols and ozone.
The CMIP5 historical and RCP simulations are 'concentration driven' or forced by prescribed CO2 concentrations, rather than emissions-driven. Other forcing factors include aerosols, non-CO2 GHG, LULCC, and N-deposition for the models with C–N biogeochemistry. The duration of the future transient RCP simulations is from 2005 to 2100. Atmospheric CO2 concentration is projected to increase by 41 ppmv, 159 ppmv, and 556 ppmv respectively in the RCP2.6, RCP4.5, and RCP8.5 scenarios, from 379 ppm in the year 2005 (Taylor et al 2012). The rate of N-deposition increases in the RCP2.6 and RCP8.5 scenarios (by 18% and 25% in 2100 respectively in the input datasets to CESM model; Tharammal et al 2019), whereas, it decreases in the RCP4.5 scenario (by 15% in the CESM model; Tharammal et al 2019), relative to the deposition rates in 2005 (Lamarque et al 2013).
The RCP8.5 and RCP2.6 scenarios project reductions in global forest cover in the developing countries (in Africa, SE Asia and South America) due to the increase in agriculture driven by projected increase in population (Hurtt et al 2011). However, the RCP4.5 scenario assumes land-use management as a strategy to curb the global carbon emissions and the scenario projects afforestation globally (Hurtt et al 2011). The RCP8.5 and RCP2.6 scenarios project increases in cropland due to increases in agriculture and increased cultivation of biofuel crops, whereas, the RCP4.5 scenario has reduced cropland because of afforestation and better management of food production and distribution in the 21st century. Pastureland increases in the RCP8.5 scenario due to intensive grazing, whereas, the RCP4.5 and RCP2.6 scenarios project reductions. All three future scenarios project increased wood harvesting in 2100 (Hurtt et al 2011). The land use changes projected in these three future scenarios are smaller and are more stabilized compared to the historical period. Further, unlike the historical period, the LULCC in the future scenarios are mostly located in the tropics and subtropics (Hurtt et al 2011). As a result of all these forcings, the CMIP5 models project increases in global mean surface temperatures in the ranges of 0.3 °C–1.7 °C for the RCP2.6 scenario, 1.1 °C–2.6 °C for the RCP4.5 scenario, and 2.6 °C–4.8 °C for the RCP8.5 scenario (IPCC 2013).
3. Results
3.1. Contribution of major drivers to the land carbon uptake
3.1.1. Historical period (1850–2005)
There is a consensus that the land was a source of carbon in the historical period, however, the quantitative estimates have large uncertainty. For instance, based on observations, Arora et al (2011) estimate the cumulative land carbon uptake for the historical period (1850–2005) that includes the LULCC effect as −11 ± 47 PgC (land is a net source of carbon; 1 PgC = 1 Peta gram C = 1015 g). For the same period, the cumulative land carbon uptake estimated by thirteen CMIP5 models (with land use changes) shows a multi-model mean of −19 PgC (from nine out of the thirteen models), however, the values range from a land source of −124 PgC to a land sink of +50 PgC in 2005 (Jones et al 2013). Similarly, for the years 1850–2005 Friedlingstein et al (2014) estimate the mean of cumulative land carbon uptake as ∼−26 ± 32 PgC from eight of the CMIP5 models.
Devaraju et al (2016) provide an assessment of the major drivers of the land carbon uptake for the 1850–2005 period using sensitivity simulations performed with the NCAR Community Earth System Model (CESM1). CESM1 simulates an increase in global NPP by 4 PgC yr−1 and a cumulative land carbon source by 2005 (reduction of global TEC by 45 PgC in 2005 with respect to 1850, Lawrence et al 2012, Devaraju et al 2016). The larger value of land source estimated by CESM1 compared to the ensemble mean of the CMIP5 models and observations (see Arora et al 2011, Friedlingstein et al 2014), is due to the N-limitation in CESM1 that weakens the CO2 fertilization effect in the model (Thornton et al 2009, Bonan and Levis 2010). CO2 fertilization (2.3 PgC yr−1, 43.22% contribution) and N-deposition (2.0 PgC yr−1, 37.10% contribution) cause most of the increase in global NPP between 2005 and 1850 in the CESM1 (Devaraju et al 2016; figure 2). Further, Devaraju et al (2016) find that the effects of CO2 fertilization (+55.39 PgC, 26.61% contribution) and N-deposition (+26.11 PgC, 12.54% contribution; figure 2) are positive to the net land sink during 1850–2005, but a larger negative contribution of LULCC (−111.57 PgC, 53.6% contribution) augmented by climate warming (−15.05 PgC, 7.23% contribution) lead to a net decline in the land carbon sink during 1850–2005. Similarly, Eglin et al (2010) using the process-based global ecosystem model ORCHIDEE find that the effect of LULCC is dominant on the reduction of global soil carbon and biomass during the period 1901–1960, compared to the positive effects of combined CO2 and climate. Further, CMIP5 models that include time-varying historical LULCC simulate a decline in the land carbon stocks from 1850 to ∼1950, primarily due to deforestation (Jones et al 2013).
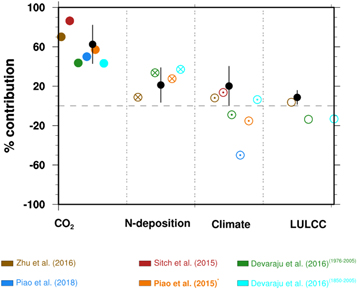
Figure 2. Percent contributions of major drivers to recent (1976–2012) NPP and LAI change from various studies. The percent contributions of four drivers to the NPP change in the historical period (1850–2005) from the CESM1 results of Devaraju et al (2016) are shown in addition to the contributions of the factors during 1976–2005 from the same study. Percentage contribution is given a negative sign if the contribution of the driver reduces the NPP or LAI. The black dots and whiskers represent the average of percent contribution of each of the factors, and their standard deviations from the mean values. All values except for Piao et al (2015) [China] are from global studies. Only global values for the recent decades are included in the calculation of the means of the percent contribution.
Download figure:
Standard image High-resolution image3.1.2. Recent decades
There is broad agreement among several studies that the land had turned into a sink in recent decades. This is based on assessments that show an increasing trend of NPP, LAI, and land carbon sink over the globe in recent decades (Nemani et al 2003, Raupach et al 2008, Friedlingstein et al 2010, Ballantyne et al 2012, Anav et al 2015, Piao et al 2015, 2018, Sitch et al 2015, Zhu et al 2016, Campbell et al 2017, Fernández-Martínez et al 2017, 2019, Keenan and Williams, 2018). The global carbon budget project (GCP, Le Quéré et al 2009) estimates a residual land carbon sink of 0.36 ± 1 PgC yr−1 for the years 1960–2005 (calculated as the sum of fossil fuel flux and LULCC flux minus the sum of ocean sink and atmospheric CO2 growth). Latest estimates of GCP using DGVMs and residual sink method find that the land carbon sink almost doubled in 2007–2016 when compared to the 1960s (from 1.4 ± 0.7 to 3 ± 0.8 PgC yr−1, Le Quéré et al 2018). Further, the estimates of the land carbon uptake for the recent decades from the CMIP5 models show an increasing land sink trend during 1960–2005 (ensemble mean of land-atmosphere flux of 0.7 ± 0.6 PgC yr−1, Anav et al 2013).
A number of modeling studies have assessed the drivers of this recent increases in the NPP and land carbon sink (see table S1). Figure 2 and table S2 show the percentage contributions of major drivers to recent (1976–2012) increases in NPP and LAI from four global studies and one regional study. The largest contribution is from CO2 fertilization and its percent contribution to increases in global NPP/LAI ranges from 43% (Devaraju et al 2016) to 86% (Sitch et al 2015), with a mean of 62.5 ± 19.5%. The percent contribution of N-deposition ranges from 8% (Zhu et al 2016) to 33% (Devaraju et al 2016), with a mean of 21.2 ± 17.5%. The percent contribution of climate change varies from 8% (Zhu et al 2016, positive effect) to 50% (Piao et al 2018, negative effect) (mean 20.2 ± 20.0%). It is unclear whether climate change contributes positively or negatively to the increases in NPP or LAI as two of the global studies (Devaraju et al 2016, Piao et al 2018) show negative contribution of climate change to the NPP trends, while two other studies (Sitch et al 2015, Zhu et al 2016) show positive contributions. Only two studies (Zhu et al 2016 and Devaraju et al 2016) have analyzed the contribution of LULCC on LAI and NPP. Zhu et al (2016) find that the percent contribution of LULCC to the increase in global LAI is ∼4%, whereas, Devaraju et al (2016) estimates the percent contribution of LULCC to the NPP change to be ∼13% (negative effect on NPP). The reasons for the discrepancies between the models in the effects of climate change and LULCC on the increases in NPP/LAI may be the differences in both the climate simulated by the models and the response of models' carbon cycle to climate change, and differences in implementation of LULCC in the models (Peng et al 2017). A regional study over China (Piao et al 2015) for the period 1982–2009 using satellite observations and TRENDY climate models (which do not account for the LULCC) finds that the CO2 fertilization is the primary driver (∼57% contribution) of change in satellite-observed LAI in the region, followed by increased N-deposition (27.6% contribution). According to this study, the contribution of climate warming is small (15.2% contribution) but negative to the greening trend because of the droughts in the region during the period.
Figure 3 shows the percentage contribution of the four factors to changes in land carbon fluxes (NBP, NEP), and land carbon stocks (TEC) during recent decades, and actual numbers including the net change from the studies are given in table S3. In general, CO2 fertilization and N-deposition lead to increases in the land carbon uptake in the recent past. The percent contribution of CO2 fertilization ranges from 33% (Devaraju et al 2016) to 85% (TRENDY study by Sitch et al 2015) with a mean of 55.1 ± 23.2%, while the percent contribution of N-deposition ranges from 10% to 24% with a mean of 15.8 ± 7.5% among the studies. Climate change and LULCC lead to a decline of land carbon stocks in the majority of the studies, and the mean of the relative contributions of these two factors respectively are 13.7 ± 11.8% and 39.1 ± 20.2%.
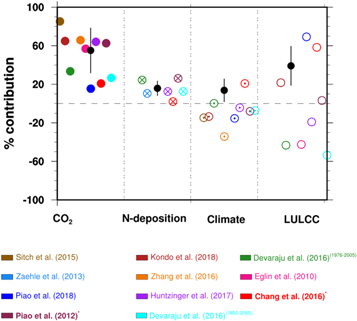
Figure 3. Percent contributions of major drivers of changes in recent-historical (1976–2012) land carbon fluxes and stocks represented by trends or net changes in net biome production (NBP), net ecosystem production (NEP) and total ecosystem carbon (TEC) from various studies. Percent contributions of four drivers to the TEC change in the historical period (1850–2005) from the CESM1 results of Devaraju et al (2016) are shown in addition to the contributions of the factors during 1976–2005 from the same study. Percentage contribution is given a negative sign if the contribution of the driver reduces the net carbon stock. The black dots and whiskers represent the average of percent contribution of each of the factors among the studies, and their standard deviations from the mean values. All the values except for Chang et al (2016) [European grasslands] and Piao et al (2012) [East Asia] are from global studies. These two studies are not included in the calculation of the means of the percent contribution.
Download figure:
Standard image High-resolution imageThe study by Huntzinger et al (2017) that assessed the major drivers of land carbon uptake during 1959–2010 as a part of the MsTMIP project shows large spread in model predictions due to differences in models' representations of ecosystem processes and structure, even though all the models are forced by same meteorology (see section 2.2). They find large differences in the net global land carbon uptake for the period 1959–2010 simulated by the models with the C–N cycle (net uptake of 31 ± 62.6 PgC) and the models without C–N cycle (net uptake of 93.3 ± 86.4 PgC). The models without coupled C–N cycle simulate a larger role for CO2 fertilization during 1959–2010 (multi-model mean of percent contribution 60.2 ± 23.1%), and other two drivers-LULCC (21.2 ± 7.9%) and climate change (18.5 ± 17.3%) lead to land carbon loss. Their study shows that CO2 fertilization still is the primary driver among the models with coupled C–N cycle (multi-model mean 43.0 ± 18.0% contribution), followed by LULCC (33.3 ± 23.4%, C loss), N-deposition (17.6 ± 12.1%, C gain), and climate change (6.1 ± 5.3%, C gain in majority of the models). Two of these models−CLM4 and CLM4-VN−however, simulate LULCC as the primary driver (56.3% and 51.1%, respectively, C loss). This is in agreement with the CESM1 result of Devaraju et al (2016), which uses CLM4 as its land model and finds that LULCC is the largest driver (43%) that leads to a reduction in the land carbon stocks during 1976–2005. However, in these three models (CLM4, CLM4-VN, and CESM1) the net land carbon uptake increases during the recent past, by combined effects of CO2 fertilization and N-deposition. Both Devaraju et al (2016) and Huntzinger et al (2017) find that climate warming leads to a small gain of carbon in the models with the coupled C–N cycle because of increased N-mineralization due to warming.
Similar to the global studies, the regional modeling studies also find increases in the land carbon sink in recent decades and show that CO2 fertilization is the dominant driver. Piao et al (2012) using the TRENDY models for the SE Asian region find that all factors except for climate change contributed positively to a land sink in the region during 1990–2009. They attribute ∼70% contribution from the combined effects of climate change and CO2 fertilization, ∼26% from the increased N-deposition, and 3% due to LULCC. Similarly, Felzer and Jiang (2018) find that the increased land carbon sink since the 1950s in the US is due to CO2 fertilization and N-deposition.
Recent studies that use DGVMs disentangle the LULCC effects into land use emissions and plant regrowth after the LULCC, and they recognize that plant regrowth and land management practices are important factors in mitigating the LULCC fluxes to the atmosphere and in increasing the land carbon sink in the past few decades. For instance, a recent study by Kondo et al (2018) using the TRENDY results finds that plant regrowth in eastern North America, southern-eastern Europe, and southeastern temperate Eurasia was an important factor for the increases in the global land sink during recent past. According to their results, the approximate global net carbon flux difference between 2000–2009 and 1960–1999 is +1.27 ± 0.34 PgC yr−1 (land as a sink), and the percentage contributions of the factors are, CO2 fertilization ∼64.86% (+1.2 ± 0.25 PgC yr−1), climate warming ∼13.51% (−0.25 ± 0.11 PgC yr−1), LULCC 2.35% (−0.04 ± 0.23 PgC yr−1), and plant regrowth 19% (+0.33 ± 0.10 PgC yr−1). Piao et al (2018) using the TRENDY models find that the reduced LULCC fluxes due to reduced deforestation in the tropics (in SE Asia and South America) and afforestation in northern hemisphere temperate regions (net LULCC contribution ∼69%) led to an increased global land sink during the slow warming period 1998–2012. They attribute only about 15% contribution to CO2 fertilization to the intensification of the land carbon sink during the period, and they find that climate warming nearly offsets this contribution.
3.1.3. Future climate scenarios
Majority of the CMIP5 models (e.g. Jones et al 2013, Friend et al 2014, Arora and Boer, 2014, Mahowald et al 2016) simulate increases in LAI, NPP, and cumulative land carbon uptake by the end of 21st century in all three future scenarios considered in the present review (RCP2.6, RCP4.5, and RCP8.5), although estimates of the land carbon uptake by 2100 show large inter-model spread (Jones et al 2013). The tropics and northern latitudes become major carbon sinks in most of the CMIP5 models by 2100. The ranges of cumulative land carbon uptake simulated by the CMIP5 models are, −45 PgC to +220 PgC for RCP2.6, +55 PgC to +460 PgC for RCP4.5, and −190 PgC to +490 PgC for RCP8.5 (Jones et al 2013). The models with coupled C–N cycle (CESM and NorESM, which share the same land model) simulate relatively less cumulative land carbon uptake in the future scenarios compared to other CMIP5 models due to N-limitation that weakens these models' response to increases in CO2. For instance, CESM1 simulates a cumulative land source in the RCP2.6 (−21 PgC between 2100 and 2005) and RCP8.5 (−27 PgC) scenarios, and a weaker land sink in the RCP4.5 scenario (+55 PgC) compared to many of the CMIP5 models (Lawrence et al 2012, Tharammal et al 2019).
Some studies have suggested that the projected increase in the land carbon stocks in CMIP5 models is primarily contributed by CO2 fertilization (Jones et al 2013, Brovkin et al 2013, Friend et al 2014), despite climate warming in the future scenarios and deforestation in the RCP2.6 and RCP8.5 scenarios. The inferred contributions of three major drivers (CO2 fertilization, climate change, and LULCC) to the mean change in global TEC in the RCP2.6 and RCP8.5 scenarios for the four CMIP5 models from the LUCID project (Brovkin et al 2013; the selection criteria and calculation of contributions for the LUCID models are explained in section 2.1) are shown in figure 4 and table S4. CO2 fertilization effect is positive for all the models in both the scenarios. The sum of the effects of three drivers and the net change for the individual models for the RCP2.6 scenario agree in sign for CanESM and MIROC ESM, both of which, simulate a net decline in the land carbon stock in the 21st century due to climate warming and LULCC. Net change in HADGEM2 for the RCP2.6 scenario (an increase in land C uptake in 21st century) disagrees in sign with the calculated sum of three drivers, and IPSL-CM5A-LR does not include the LULCC effect in the RCP2.6 scenario. The LUCID models agree on the negative contribution of LULCC to the land carbon uptake in the RCP2.6 and RCP8.5 scenarios, despite substantial spread in the values (see Brovkin et al 2013; table S4). Similarly, Quesada et al (2018) used five of the LUCID-CMIP5 models to assess the effects of LULCC in the RCP8.5 scenario, and they find that the projected increases in global greening and the land carbon stocks in the scenario are dampened in the models by approximately 22% and 24%, respectively due to LULCC.
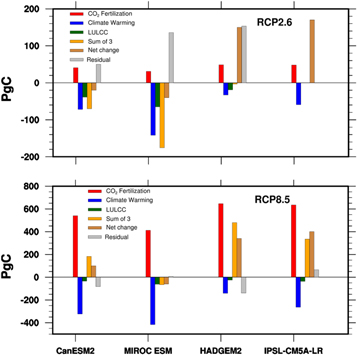
Figure 4. Contributions of major drivers to the mean change in global total ecosystem carbon (TEC; changes in the year 2100 relative to 2006) in the RCP2.6 and RCP8.5 scenarios estimated from four CMIP5 models. The values shown are absolute changes in carbon stocks. The contributions of CO2 fertilization effect and climate warming effect are estimated from the models' land C uptake sensitivity to CO2 (β in PgC ppm−1) and climate warming (γ in PgC K−1) from Arora et al (2013). Changes in atmospheric concentration of CO2 (ΔCO2) in RCP2.6 and RCP8.5 in year 2100 with respect to the present, respectively, are 42 ppm and 557 ppm. Contributions of CO2 fertilization effect = βmodel × (ΔCO2), and contributions of climate change = γmodel × (ΔT), where ΔT is the changes in global temperature in the RCP2.6 and RCP8.5 scenarios in year 2100 with respect to the present. The LULCC effect on the change in TEC and ΔT are from Brovkin et al (2013). The net change in the TEC in 2100 for the individual models is estimated from Jones et al (2013) and Brovkin et al (2013). Sum of three is the sum of the estimated contributions of three factors. Residual is the difference between the net changes in TEC from Jones et al (2013) and the estimated sum of three.
Download figure:
Standard image High-resolution imageThe sum of effects of three drivers agrees in sign with the net change in the 21st century in TEC for all the four LUCID models in the RCP8.5 scenario (figure 4 bottom panel). CO2 fertilization offsets the decline in the land carbon stocks caused by climate warming and LULCC in the models except for MIROC ESM, for which, the larger climate warming effect causes a net decline. The large spread in the net changes of TEC among the LUCID models is because of the differences in the parameterizations of the processes such as photosynthesis, carbon allocation, and different implementations of the wood harvest/grazing in the models (Brovkin et al 2013, Boysen et al 2014). The mismatch in magnitudes between the net changes of TEC in the 21st century and the sum of three factors for both the scenarios (figure 4) is likely caused by the sensitivity factors used for the calculation. The sensitivity factors for individual models used in the calculations here (from the '1% yr−1' CO2 experiments by Arora et al 2013) may differ for the RCP scenarios, due to the differences in the CO2 concentrations and LULCC in respective simulations. A detailed discussion of the sensitivity factors is given in section 3.2.
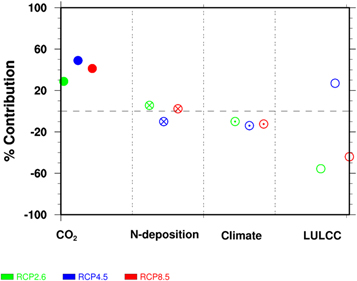
Tharammal et al (2019), using CESM1 estimated the contributions of the four major drivers of changes in land carbon uptake in the RCP2.6, RCP4.5, and RCP8.5 scenarios. The percent contributions of major drivers to the changes in TEC in these scenarios estimated from Tharammal et al (2019) are shown in figure 5 and table S5. They find that LULCC (tropical deforestation) is the primary driver of the decline in the land carbon stocks in the low-emission RCP2.6 scenario. The percent contributions of the drivers to the net TEC change in this scenario (changes in TEC in the year 2100 relative to 2005 in brackets) are LULCC 55.6% (−38.76 PgC), CO2 fertilization 28.8% (+20.08 PgC), climate change 9.9% (−6.9 PgC), and N-deposition 5.5% (3.9 PgC). In the RCP4.5 scenario, CO2 fertilization is the major driver of the increase in the global land carbon uptake [∼49% (+52.05 PgC)], followed by the positive contribution of LULCC to the land carbon sink [due to afforestation, 27% (+28.71 PgC)]. Climate change causes a reduction in land carbon uptake [∼14% contribution (−14.85 PgC)] and reduced N-deposition rates in the RCP4.5 scenario in 2100 with respect to 2005 cause a reduction in the land carbon uptake [10% contribution (−10.70 PgC)]. In the RCP8.5 scenario, CESM1 simulates a land source by 2100, mainly due to the effects of LULCC (deforestation). Weakened CO2 fertilization in CESM1 due to N-limitation is likely the cause for the differences in the net land carbon uptake between CESM1 and other CMIP5 models. The percent contribution of each of the factors in the RCP8.5 scenario is: LULCC 44% (−93.14 PgC), CO2 fertilization 41.2% (+87.21 PgC), climate change 12.4% (−26.20 PgC), and N-deposition 2.3% (4.92 PgC). The contribution of N-deposition in future scenarios is smaller when compared to the historical period (2%–10% versus ∼20%, see Devaraju et al 2016, Tharammal et al 2019).
Figure 5. Percent contributions of major drivers to the total ecosystem carbon (TEC) changes in (2090–2099) relative to (2005–2015) in the RCP2.6, RCP4.5, and RCP8.5 scenarios using the CESM1-CN model (Tharammal et al 2019). The percentage contribution is given a negative sign if the contribution of the driver leads to a reduction in TEC.
Download figure:
Standard image High-resolution image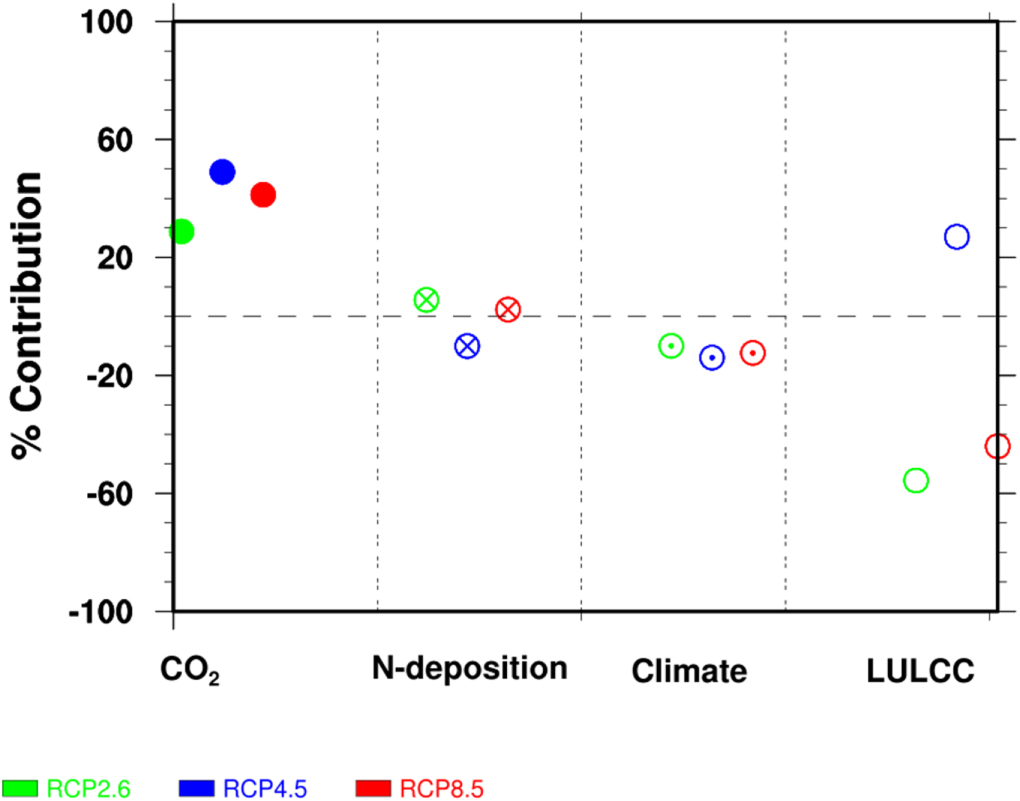
3.2. Sensitivity factors
Following Friedlingstein et al (2003), various studies on the land carbon uptake have estimated the sensitivity of the change in the land carbon stocks to (i) the increase in CO2 concentration (β) and (ii) to climate warming (γ). Bala et al (2012) define another sensitivity factor—change in the land carbon stocks due to N-deposition (δ). In this section, we review the model-simulated sensitivity factors for the historical and future climate scenarios, along with those estimated from idealized simulations.
β is calculated as the change in the land carbon stocks per unit increase in atmospheric CO2 when other drivers are kept constant, and similarly, γ is calculated as the changes in the land carbon stocks per unit change in global mean surface temperature, while, δ is calculated as the changes in land carbon stocks for a unit increase in the rate of N-deposition. Table 1 summarizes these sensitivities from various studies. Several values from the C4MIP studies and equilibrium simulations are adapted from Friedlingstein et al (2006) and Bala et al (2012). The concentration-carbon sensitivity factor β is positive in sign irrespective of the time period, climate scenarios, and different models used. However, the β values show a broad range (0.17 PgC ppm−1 in the RCP8.5 scenario in Tharammal et al (2019) to 3.38 PgC ppm−1 in the historical period from Huntzinger et al (2017), see table 1). Friedlingstein et al (2006) find that different model responses to NPP cause the inter-model differences in the β values. Another notable feature is that the β values vary with the emission scenarios and the state of the climate system (Boer and Arora 2009, 2013, Bala et al 2012, Arora et al 2013, Hajima et al 2014). The β values calculated from transient simulations are smaller compared to near-equilibrium simulations, due to the lags in ecosystem response (Bala et al 2012, 2013). A slower rate of CO2 increase in a scenario leads to larger land CO2 accumulation, and higher values of β (Hajima et al 2014). The models with coupled C–N biogeochemistry simulate smaller β values compared to models without the C–N biogeochemistry (e.g. Thornton et al 2007, Arora et al 2013, Devaraju et al 2016, Huntzinger et al 2017, Tharammal et al 2019, see table 1), as the N-limitation in these models weakens the CO2 fertilization effect. Similarly, the β values in the coupled C–N models decrease with increasing atmospheric CO2 in the RCP scenarios (see table 1, Tharammal et al 2019) due to N- limitation with the increases in CO2 fertilization (Thornton et al 2007).
Table 1. Sensitivity of global land carbon uptake to CO2 (β in PgC ppm−1), climate warming (γ in PgC K−1) and N-deposition rate (δ in PgC/(TgN yr−1)) from various studies for different time periods and climate scenarios.
| Study | Experiment/Time period | Model name | β (PgC ppm−1) | γ (PgC K−1) | δ (PgC/(TgN yr−1)) |
|---|---|---|---|---|---|
| Friedlingstein et al (2006) | SRES A2 scenario | C4MIP Multi-model mean | 1.35 ± 0.61 | −78.6 ± 45.8 | — |
| Bonan and Levis (2010) | 1973–2004 | CLM4 with CN | 0.24–0.26 | −0.2 to 0.3 | — |
| Zaehle (2010a) | SRES A2 scenario 1860–2100 | O-CN | 0.63 | −51 | — |
| Thornton et al (2007) | 1850–2000 | CLM3 | 0.4 | −0.8 | — |
| Thornton et al (2009) | SRES A2 scenario | CCSM3 | 0.5 | −25 | — |
| Bala et al (2012) | 2 × CO2 | CCSM4 | 1.3 | −53.77 | |
| Bala et al (2013) | 1000 year PI equilibrium sensitivity simulations | CLM4 | 2.2–2.7 | −152 to −182 | 2.47–3.41 |
| Arora et al (2013) | Quadrupled CO2 from the PI levels by 1% increasing /year | CMIP5 multi-model mean | 0.92 ± 0.44 | −58.4 ± 28.5 | — |
| Eby et al (2013) | Quadrupled CO2 experiments | Earth system models of intermediate complexity mean | 0.69 | −61.5 | — |
| Devaraju et al (2016) | 1850–2005 CMIP5 historical simulation | CESM1-CN | 0.50 | −20.33 | 0.59 |
| Huntzinger et al (2017) | 1901–2010 historical simulations with DGVMs | DGVMs with N-cycle | 1.5 ± 0.7 | −90.01 ± 66.6 | — |
| DGVMs without N-cycle | 3.38 ± 2.7 | −135.19 ± 72.8 | — | ||
| Tharammal et al (2019) | RCP2.6 2005–2100 | CESM1-CN | 0.52 | −11.43 | 0.36 |
| RCP4.5 2005–2100 | 0.35 | −11.35 | 1.12 | ||
| RCP8.5 2005–2100 | 0.17 | −8.36 | 0.37 | ||
| Peng et al (2014) | Quadrupled CO2 from the PI levels by 1% increasing/year | CMIP5 multi-model mean | 1.04 ± 0.42 | −39.62 ± 14.77 (6 models) | — |
| Jones et al (2018) | RCP8.5 2005–2089 | iCESM (CESM coupled with GCAM) | 0.28 | −6.6 | — |
The climate-carbon sensitivity factor (γ) is negative for the historical period and future scenarios and for other transient or equilibrium simulations (see table 1), which suggests that the land loses carbon with increasing temperature. The reason for the decline in carbon sink with the temperature is primarily the acceleration of the decaying process and the consequent increases in the heterotrophic respiration. Further, climate warming reduces NPP especially in the tropical latitudes in the historical period and the future scenarios (e.g. Devaraju et al 2016, Tharammal et al 2019). The magnitudes of γ values are dependent on the models used and the state of the system, and they vary between 0.2 PgC K−1 in Bonan and Levis (2010) and ∼180 PgC K−1 in Bala et al (2013). The magnitudes of γ values are generally smaller in the coupled C–N cycle models compared to the models without the C–N cycle as the N-mineralization due to warming and the consequent increase in productivity counteracts the carbon loss due to increased heterotrophic respiration in these models (Thornton et al 2007, Bonan and Levis 2010, Arora et al 2013, Devaraju et al 2016, Huntzinger et al 2017, Tharammal et al 2019).
The sensitivity of the land carbon uptake to the N-deposition (δ) is positive in sign (see table 1), which implies N-deposition increases the productivity and land carbon sink. However, like the other two sensitivity factors, the values show a considerable range (0.37 PgC/TgN yr−1) in the transient RCP2.6 simulation by Tharammal et al (2019) to 3.41 PgC/TgN yr−1 in an equilibrium simulation by Bala et al (2013). The interaction with other factors influences the δ values; for instance, Bala et al (2013) find that the δ values increase with CO2 fertilization, and decrease with the amount of climate warming. Similarly, Tharammal et al (2019) attribute the larger δ values simulated in the RCP4.5 scenario compared to their RCP2.6 and RCP8.5 simulations (see table 1) to the interaction of N-deposition with LULCC (afforestation in the RCP4.5 scenario).
Studies that define a sensitivity factor for the land C uptake due to net LULCC are not available in the literature, as it is difficult to uniquely quantify the LULCC, which include conversion to/from different plant functional types, harvest, grazing, and land use fluxes. Recently, Jones et al (2018) decomposed the γ and β values to non-human mediated and human mediated effects, and the latter is further divided into concentration-land cover (ε), climate-land cover (η), and land cover-carbon (μ) effects. They describe the human-induced effect of land cover change in terms of changes in cropland area. The sensitivity factor μ reflects the amount of land carbon change associated with the land conversion for agriculture; and μ is estimated as −16 PgC Mkm−2 of cropland for the RCP8.5 LULCC. Further efforts to define a sensitivity factor for LULCC will help to better understand the inter-model spread of land carbon uptake in the future projections.
4. Discussions and conclusions
4.1. Major drivers
4.1.1. Consensus
This review assesses the contributions of the major drivers of the land carbon uptake in the historical and future scenarios. During the period 1850–1950, LULCC has primarily led to the decline in the land carbon stocks (Jones et al 2013, Devaraju et al 2016). From 1960 onwards, both the modeling studies and observations indicate increases in the LAI (greening), NPP, and land carbon uptake that are primarily driven by CO2 fertilization. The effects of CO2 fertilization (∼33% to 85% contribution; Sitch et al 2015, Devaraju et al 2016, Zhang et al 2016, Zhu et al 2016, Huntzinger et al 2017) and anthropogenic N-deposition (∼10% to >20% contribution; Zaehle et al 2013, Devaraju et al 2016, Zhu et al 2016, Huntzinger et al 2017) have led to the increases in global NPP/LAI and land carbon uptake in recent decades. O'Sullivan et al (2019) finds that the nitrogen deposition and carbon-nitrogen synergy together contribute ∼28% to the historical land sink. The majority of the studies assessed in this review find a negative contribution of climate warming to NPP and global land carbon uptake during the historical period and in recent decades. The estimates of the contribution of LULCC to recent increases in the land sink differ in the literature. A number of studies (e.g. Devaraju et al 2016, Huntzinger et al 2017) suggest that the contribution of LULCC to the land sink is negative during recent decades, whereas, some studies suggest reduced LULCC (Piao et al 2018) and plant regrowth (Kondo et al 2018) have led to increased land carbon sink during recent decades. These conflicting results show the importance of representing processes such as land cover changes (Arneth et al 2017, Peng et al 2017, Prestele et al 2017) and plant regrowth in a consistent manner in the models.
Results from the majority of the CMIP5 models indicate that CO2 fertilization would lead to increases in the land carbon uptake in the future scenarios (Jones et al 2013). There is agreement among the CMIP5-based studies on the decline of the land carbon stocks in the RCP2.6 and RCP8.5 scenarios due to the direct effect of LULCC, i.e. removal of biomass through deforestation (Brovkin et al 2013, Tharammal et al 2019), however, in contrast to the majority of CMIP5 models, in CESM1, the larger effect of LULCC in the RCP2.6 and RCP8.5 scenarios offsets the CO2 fertilization effect. Similarly, Müller et al (2007) through simulations using the SRES scenarios find that land use changes, especially deforestation, cause substantial changes in the future land carbon uptake, and can offset the effects of CO2 fertilization and climate change. We infer that climate warming leads to a loss of TEC in the three future scenarios (see figures 4 and 5; Arora et al 2013, Jones et al 2013, Tharammal et al 2019). Simulations with CESM1 show that the increase in TEC the RCP4.5 scenario is primarily due to CO2 fertilization and afforestation (Tharammal et al 2019). However, a lack of sensitivity studies for the RCP4.5 scenario limits the analysis of major drivers of changes in the scenario using multiple models.
4.2. Problems and challenges
Large uncertainties and disagreements are found among the modeling studies regarding the relative contributions of the drivers, and even in the sign of changes in land carbon uptake in simulations for the same climate scenarios. Further, many studies that assessed the CMIP5 earth system models' performance in simulating the present-day global land carbon cycle (Anav et al 2013, Jones et al 2013, Todd-Brown et al 2013, Koven et al 2015, Schurgers et al 2018) find broad range in the present-day vegetation carbon stock and soil carbon stocks. Lovenduski and Bonan (2017) find that ∼80% of the uncertainties in the projected terrestrial carbon uptake in the CMIP5 models are driven by differences in model structure. In addition, different definitions and approaches used in climate models to estimate the LULCC might have added to the uncertainties (Poulter et al 2011, Peng et al 2017). The offline TRENDY model results and MsTMIP models (tables S1, S3) show that there is large intermodel spread even when forced by same climate forcings. The importance of incorporating nutrient limitation, especially the C–N dynamics to the global land models has been studied extensively and it is highly likely that N-limitation substantially reduces the CO2 fertilization effect in models with coupled C–N biogeochemistry (Sokolov et al 2008, Jain et al 2009, Thornton et al 2009, Bonan and Levis 2010, Zaehle et al 2010a, Goll et al 2012, Zaehle et al 2013, 2015, Brovkin and Goll, 2015, Wieder et al 2015). However, many of the models discussed in the present review including the CMIP5 models (Jones et al 2013) do not represent the N- and phosphorus limitation in their land carbon cycle, and hence are likely to overestimate the future land carbon uptake (Wieder et al 2015, Zaehle et al 2015). Other reasons for these inter-model differences are dependence of the simulated carbon stocks on factors such as initial carbon pool size (Brovkin et al 2013), and carbon cycle responses to climate biases in the model (Ahlström et al 2017). Biases in the climate forcing data can also lead to large uncertainties (Schimel et al 2015b, Wu et al 2017, 2018). Hence, it is crucial to reduce the uncertainties from the climate data for a better estimation of the land carbon uptake.
The main limitation of many of the studies discussed in the present review (see table S1) is that they study the role of only one or two of the major factors. Further, a large number of the studies that analyze the drivers of historical land carbon uptake use offline land models (see table S1; e.g. MsTMIP models (Huntzinger et al 2017), TRENDY model studies—Piao et al 2012, Piao et al 2015, Sitch et al 2015, Zhu et al 2016, Kondo et al 2018, Piao et al 2018), which lack atmospheric feedbacks. Uncertainties in the meteorological forcing (Ahlström et al 2017) used to force these offline models can lead to large biases in the simulated land carbon cycle. Further, the first version of the TRENDY studies (Sitch et al 2015), and some other studies we considered (Piao et al 2015, Zhang et al 2016) do not account for the land use changes during the historical period. Several regional and global studies (Piao et al 2012, Chang et al 2016, Kondo et al 2018, Piao et al 2018, see table S3) suggest that reduced land use fluxes through land management contribute positively to the net land carbon uptake in recent decades, while a few others show negative contributions of LULCC (Eglin et al 2010, Devaraju et al 2016, Huntzinger et al 2017), hence overlooking this factor might have caused under/over-estimation of recent land carbon uptake in the studies that omit LULCC.
Aggressive tuning and validation of the models to reproduce the past carbon cycle may reduce the uncertainties, however, large uncertainties in the observational data might still lead to the spread in the predictions. Lovenduski and Bonan (2017) devised a weighing scheme for the CMIP5 models based on their ability to reproduce the observed land carbon uptake and they find that this constraint led to a reduction in the uncertainty in the future projections by ∼20%. One of the major challenges for the modeling studies is constraining present-day carbon cycle simulated by the models with observations, as we lack direct measurements of the land carbon fluxes, and available observations rely primarily on the in-situ measurements or indirect satellite estimates (Ciais et al 2014, Schimel et al 2015b, Sellers et al 2018). Interestingly, emergent constraints derived from the relationships between the observable variables (e.g. interannual variability in CO2, temperature) and present-day sensitivity of the land carbon stocks to climate variables have been used recently to reduce the uncertainties in the future projections of GPP, NBP, and the sensitivity to long term climate change (Cox et al 2013, Wenzel et al 2014, 2016, Mystakidis et al 2016, Hall et al 2019, Winkler et al 2019).
Ecosystem processes that are missing in climate models can cause further uncertainties to projections of future land carbon uptake. Although all CMIP5 models predict reduced land carbon uptake with climate warming, recent modeling studies that incorporated the plant acclimation parameterizations (photosynthetic plus root respiratory) at higher temperatures show that there could be an enhancement in land carbon uptake in the future warming scenarios (Arneth et al 2012, Lombardozzi et al 2015, Mercado et al 2018). However, the extent to which these processes will affect the future carbon uptake is uncertain as these parameterizations are in the early stages of validation/implementation in climate models. Similarly, permafrost thawing, a process yet to be represented in most earth system models can cause a release of carbon from higher latitudes in a warming climate and may enhance the positive carbon-climate feedback (Burke et al 2013, Koven et al 2013). Additionally, the prescribed LULCC for future scenarios in the CMIP5 models do not allow climate-induced land cover changes (CILCC). Davies-Barnard et al (2015) using HadGEM2-ES with the DGVM TRIFFID (Top-down Representation of Interactive Foliage and Flora Including Dynamics) find that the forest expansion due to CILCC could partly offset the effects of deforestation in the RCP8.5 scenario by 2100.
Although the modeling studies that we reviewed here indicate CO2 fertilization effect is the largest contributing factor to increases in NPP and land carbon stock, the strength of the CO2 fertilization effect is debated (Ahlström et al 2013, Todd-Brown et al 2013, Wieder et al 2015, Smith et al 2016). While the CMIP5 simulations show an increase in the land carbon sink in the future, Green et al (2019) warn that the increasing trend in the uptake may not be sustained past the middle of the century due to trends in soil moisture. Similarly, a recent observational study by Giguère-Croteau et al (2019) finds that even with increased CO2 fertilization and increased water use efficiency, factors such as nutrient availability, carbon allocation strategies, and stomatal density might limit the increase in above-ground biomass, and the sink capacity of forests. These findings demand adequate assessments of the CO2 fertilization effect under varied forcings so that the land sink in the future projections is not overestimated. Large-scale Free‐Air CO2 Enrichment experiments (FACE, Norby and Zak (2011)) in nutrient/temperature/water-limited ecosystems can be used to validate the CO2 fertilization effect simulated by the models.
There is large inter-model and inter-scenario spread in the sensitivity of the land carbon uptake to an increase in CO2, climate change, and N-deposition (β, γ, and δ values) in the historical and future scenarios. These three sensitivities depend on the model's structure and climate scenario as discussed in the review by Hajima et al (2014). This uncertainty in the estimation of the sensitivity factors would lead to uncertainties in future land carbon uptake. Further, a few of the studies considered here use offline land models (Thornton et al 2007, Bonan and Levis 2010, Zaehle et al 2010a, Bala et al 2013, Huntzinger et al 2017), and therefore, the atmosphere-land interactions are absent from the computations of their γ and β values.
Although advances in remote sensing can ease the measurements of column CO2 and GPP (via solar-induced fluorescence, Frankenberg et al 2011), more observed data products for carbon cycle variables, both in-situ and from space, are required for improving the model predictions (Ciais et al 2014, Pugh et al 2016, Rogers et al 2017, Macbean et al 2018, Sellers et al 2018). Further, it would be desirable to conduct multi-model studies with factorial experiments to assess the major drivers of the land carbon uptake with high confidence. It is expected that many models in the forthcoming C4MIP project, which is a part of the sixth phase of CMIP (CMIP6) to include improved representations of ecological processes, such as coupled C–N cycle, permafrost soil carbon dynamics, and improved spatial resolution (Jones et al 2018). These models are expected to provide a better-constrained estimate of the land carbon stocks in the future.
Acknowledgments
The first author was supported by the grant DST/CCP/PR-16/2012(G) from the Department of Science and Technology, Government of India and by the project 'Advanced Hydrologic Research and Knowledge Dissemination' funded by Ministry of Earth Sciences, Government of India; Project Number MOES/PAMC/H&C/41/2013-PC-II. Dr N Devaraju is supported by European Commission FP7 LUC4C project (http://luc4c.eu, Grant No. 603542).