

Abstract
Using a newly developed model approach and combining it with remote sensing, population, and climate data, first insights are provided into how local diets, urbanisation, and climate change relates to local urban food self-sufficiency. In plain terms, by utilizing the global peri-urban (PU) food production potential approximately 1bn urban residents (30% of global urban population) can be locally nourished, whereby further urbanisation is by far the largest pressure factor on PU agriculture, followed by a change of diets, and climate change. A simple global food transport model which optimizes transport and neglects differences in local emission intensities indicates that CO2 emissions related to food transport can be reduced by a factor of 10.
Export citation and abstract BibTeX RIS

Original content from this work may be used under the terms of the Creative Commons Attribution 3.0 licence. Any further distribution of this work must maintain attribution to the author(s) and the title of the work, journal citation and DOI.
1. Introduction
During the last 100 years, cities have become extraordinarily large in size, in the consumption of resources and in the emissions of greenhouse gases (see e.g. Dodman 2009). Consequently, transforming existing cities and to design and built-up new ones considering strict sustainability criteria is pivotal to solve the climate problem (see Rosenzweig et al 2018). Unfortunately, the development of sustainability visions is often foiled not only by the high complexity of city systems, but also by the pace of projected urban growth (United Nations 2014). Particularly, the latter creates additional pressure on natural resources, like the conversion of urban greens or rural hinterlands to built-up area (e.g. Bren d'Amour et al 2017). This may, for example, create more housing, but also increase the urban heat burden. Such kind of conflicting targets are one reason why visions for sustainable cities are on the agenda of policy makers, urban planners, and environmental researchers. Apart from many activities, the overarching question is not yet solved, namely, how to make cities more sustainable (Rees and Wackernagel 1996, Bulkeley 2010).
However, transforming existing urban centers into sustainable units is still difficult, e.g. due to conflicting interests of its residents and political groups. Any applied sector-specific action can create trade-offs or co-benefits in other sectors. Therefore, cities' development options need to be carefully analyzed under clear presumptions, as otherwise clear-cut conclusions cannot be drawn. One approach in this context is to understand cities as a kind of 'eco-technical super-organisms' (Girardet 2004). The aim of this concept is to analyze material stocks and flows of cities as an indicator for urban sustainability. Unfortunately, these so-called assessments of urban metabolism are not based on a common consensus, e.g. in terms of used urban boundaries or applied methodologies. Consequently, results are rarely comparable across cities (Beloin-Saint-Pierre et al 2017). Further recent work has been devoted to the analysis of functional city features, like productivity, liveability, or sustainability and investigates urban scaling in regard to city size (Bettencourt et al 2014, Brelsford et al 2017). Although these concepts can provide valuable insights about the relevance of certain city components they are of limited use for the planning community. In particular, they often rely on an actual state, i.e. cities are being ranked according to the indicators, but do not explain future development (e.g. European Commission 2012 and the references therein).
Taking the previously mentioned difficulties into account, solutions for urban sustainability problems require the use of a systematic analytical concept that allows for a multi-criteria analysis instead of focusing on one aspect only. We address the gaps by introducing a new model approach for the analysis of trade-offs and co-benefits of urban-hinterland systems. Specifically, the advantages and disadvantages of local food production for the nourishment of urban dwellers. This idea recently became a prominent topic in urban sustainability research (Brinkley 2012, Thebo et al 2014, Olsson et al 2016, Benis and Ferrão 2017). We adopt this idea and make use of the concept of peri-urban (PU) agriculture, which has been considered for its large potential. So far no comprehensive analysis exists which examines the potential and consequences of PU food production for cities on a planetary scale. Existing studies have been applied to only a few single cities (Serra et al 2018, Zasada et al 2019) or have just focused on the production side of food and have neglected other important aspects (Thebo et al 2014).
In this paper, we describe the nourishment potential of PU agriculture addressing several dimensions by employing an advanced global model. Furthermore, we investigate food transport today and in the future, and show how optimizations would reduce the environmental 'food-print' of urban areas. Particularly, we analyze the environmental gross effects of urban food production in a twofold way. First, we examine how much local food production may nourish urban dwellers today, assuming (i) urban growth scenarios, (ii) dietary pattern changes, and (iii) an accelerated climate change. Second, we calculate how much carbon emissions can be saved by regional urban food production and optimized food transport into urban centers.
2. Materials and methods
Our work builds on a comprehensive database of urban-PU regions — the area covered by the urban built-up area and its surrounding urban–rural transition zone. It comprises global coverage on: population (the GRUMPv1 Settlement Points (GSP) CIESIN/IFPRI/CIAT 2011), land cover type from the ESA CCI Land Cover data (v1.6.1) (ESA Land Cover CCI project team 2016) and agricultural model output from FAO-IIASA's project the Global Agroecological Zones (GAEZ) (IIASA/FAO 2012). Finally, country based information on dietary patters was obtained from the FAO database FAOSTAT (FAO 2018). All the yield data and the FAO food data are aggregated into eight food groups, namely cereals, fruits, oil-crops, pulses, root and tubers, sugar-crops, vegetables and animal products as virtual calories. The complete methodological approach is shown as a flow-chart in figure 1 and the single steps are described in more detail in the following sections.

Figure 1. Presentation of the analytical flow (right) and a result obtained for the city clustering process for the region of Berlin/Germany (left). The city clustering algorithm understands urban areas as functional units, i.e. the Berlin cluster comprises urban areas lying within a predefined cluster distance although they are different administrative entities, like Teltow or Potsdam. The peri-urban area consists mostly of agricultural area. Water bodies, other urban areas beyond the cluster distances and the corresponding peri-urban areas are clearly separated (as e.g. Ludwigsfelde or Oranienburg).
Download figure:
Standard image High-resolution image2.1. Defining cities and PU regions
Urban areas are defined by connected built-up urban areas derived from land-cover information. For this purpose, orthodromic spatial clustering (Kriewald et al 2016) is applied, a refined approach based on the city-clustering algorithm (CCA) approach from Rozenfeld et al (2008). The CCA approach involves a clustering parameter l determining up to which distance urban cells (built-up area) are connected with neighboring cells, i.e. urban cells within that distance are assigned to the same city cluster. After the identification of urban clusters (UC), they are joined with point-based population information. By using ESA CCI Land Cover data (v1.6.1) (ESA Land Cover CCI project team 2016) and GRUMP settlement points (CIESIN/IFPRI/CIAT 2011, United Nations 2014) the method presents an automated, fast, and systematic way to identify UC globally. The area  of an identified UC i is subsequently surrounded by a so-called PU region, whose area
  is defined as

with ρi as population density of UC i. The population density ρi is divided by a fixed reference population ρref = 1000 residents km−2. The latter scales the PU land demand per resident to 0.1 ha. This amount is motivated by the FAO (1993) which assumes 0.07 ha of arable land per capita as an absolute minimum requirement needed for individual food self-sufficiency (Myers 1999). For the estimation of the actual PU agricultural potential, we kept the shares of current and future land use pattern constant in order to avoid an additional transformation of natural areas into farmland. Nevertheless, the average size of PU areas will increase from 225 km2 in 2010 to 378 km2 in 2050. The averaged width of the PU area will therefore increase from 5.6 km in 2010 to 8.0 km in 2050.
Considering only cities with >100 000 residents leads to an identification of 4121 city clusters in 164 countries, which were included in the analysis. These city clusters cover 2.536bn urban residents or 71% of the total urban population in 2010. For details refer to supplementary information, sections 2 and 3 (available online at stacks.iop.org/ERL/14/094007/mmedia).
2.2. Estimating the potential yield
To quantify the potential yield in any PUi the output of the GAEZ model is employed (IIASA/FAO 2012). The GAEZ model combines geo-referenced global climate, soil and terrain data with matching procedures to identify crop-specific limitations. With the help of additional simple crop models, it provides the maximum potential crop yields for different agricultural production systems defined by irrigation type. For a more detailed explanation of the GAEZ model (see Fischer et al 2012).
For our analysis, the actually arable land for each PU is identified as the first step. For eight FAO food categories (and the items therein, e.g. for cereals: wheat, rice, maize, etc), namely animal products (considering also embodied calories based on Pradhan et al 2013), cereals, fruits, oil crops, pulses, roots and tubers, sugar crops, and vegetables, the current and the potential maximum yield is calculated by a linear programming optimization method for the years 2010 and 2050. Based on these results the amount of the potential calories produced per m2 has been calculated. As nourishment styles locally are quite different, national diets were also considered.
2.3. Calculating urban growth, future calorie demand and the impacts of climate change
For the future development of cities, national urban growth scenarios are considered for each city in the respective countries (United Nations 2014). While the city size is extended (urban sprawl effect) assuming constant density as derived from the penultimate section, the PU area is calculated as above, while keeping the land-use pattern constant as for the year 2010. The future calorie demand per capita is estimated on the basis of Hic et al (2016), while the diets itself are considered as constant. For the climate impact on potential yields for any representative concentration pathway (RCP) scenario the ensemble mean of the GAEZ model output for five climate models is used.
2.4. Estimating emission savings
In order to estimate CO2 emissions from urban food transport a two-step approach was applied. First, the PU area PUi around any city cluster UCi is calculated. By doing so urban fringes are successively increased by 10 km steps and subsequently the potential agricultural production is calculated based on the actual land use (see supplementary information). This is repeated until the urban hinterland can meet the food demand of the city (minimum daily calories requirements times urban residents and year). Second, the food distance is calculated as the product of the great-circle distance and the food supply from each grid cell in the buffer to the corresponding UCi. Finally, the CO2 emissions for such an optimized transport are estimated by applying emission factors for inland (120 g CO2/tkm) and maritime (13.5 g CO2/tkm) food transport (Cristea et al 2013) and compared with numbers from the literature referring to the status quo. Air transport is not included in this study, as transport data are not reliable, nevertheless, the emission factor for air transport is the highest (approx. 680 g CO2/tkm). By using the great circle distance (shortest possible distance) between a production site and an urban cell direct routes over land and via sea transport were considered. For details refer to SI, section 5.
3. Results
3.1. The potential of PU agriculture
To quantitatively estimate local food production the non-overlapping potential of PU agriculture for urban centers is calculated. For this purpose, the shares of actual land use pattern have been used and kept constant for the future. The CCA approach (see section 2.1 for details) makes it possible to use remote sensing and land use data in order to investigate PU agriculture and its consequences. As the CCA defines cities from a functional point of view, closely neighbored cities or suburban regions are considered as one. Examples are twin cities like Cairo/Giza or Tokyo/Yokohama, which are considered as one UC. By globally applying this approach 4121 urban entities, each with more than 100 000 residents have been identified covering approximately 71% of urban residents in 2010. Analyzing the PU areas in detail, they are composed of 63% farmland, 31% natural areas and 6% of non-arable areas. For the purpose of the paper, the area for PU agriculture is estimated on the minimum of arable land needed per capita to ensure food self-sufficiency (see section 2.1). This implies that under optimal conditions (soil quality, climate, diets) cities could nourish their inhabitants. Considering the actual land use, we estimated that PU areas globally cover an area of 2.15 million km2 comprising approximately 8.5% of the global arable land available in 2010. As shown by table 1 with this amount of land 30.6% of all urban residents can be nourished considering current food production, diets, and land use in 2010 (figure 2, upper panel). Applying more advanced agricultural practices to close yield gaps would improve the situation further, as in this case 35.3% of the global urban population could be nourished self-sustaining with the help of PU agriculture (table 1, figure 2, middle panel). However, on the global scale the situation for single cities is quite diverse showing that PU agriculture is not a 'silver bullet' solution for all cities. However, the difference between figure 2 upper panel and lower panel indicates that an optimized and local production may solve nourishment problems for many cities. As cities in Eastern, Western Africa and in Central India are currently not self-sufficient in terms of local food production a strong improvement could be achieved by closing yield gaps. The reason why North-American cities, for example, are characterized by a very low potential (as an average only 20% of residents can be sustained) is rooted in the fact that cities are mostly dominated by natural vegetation in PU areas (see, figure 5, SI). Although PU agriculture could be extensified around North-American cities, it is in general not desirable to convert all natural areas into farmlands, as this would mobilize even more greenhouse gas emissions from land conversion and the subsequent agricultural production. Moreover, such a strategy would reduce biodiversity as well. The opposite situation can be observed for Indian cities for which PU regions provide up to 90% of the actual food demand, while cities on the Arabian peninsula and on the Western coast of South America have a limited potential due to its desert environment. The remaining challenging questions, namely how the impact of climate change on yields, diet change and urban growth would change the potential for PU agriculture is displayed as a composite effect in figure 2, lower panel. In this case, nearly all cities will face a decreasing nourishment potential, with a few exceptions in higher latitudes or mountain regions. The most prominent changes are visible for the Indo-Gangetic plain, along the river Nile, South-Eastern China, and for the whole African continent. In other words, if PU agriculture is suggested as a solution for the future, one has to take into account urban growth, climate change and changing lifestyles (e.g. diet styles, food waste) as otherwise, the dynamics could foil positive effects. In order to discuss the most prominent factors for 19 world regions, we would like to refer to figure 3(b). For 16 out of 19 regions urban growth will have the largest impact on future PU agriculture. The strongest impact can be observed in Western, Middle, and Eastern Africa. Only in Southern Europe and Northern Africa is climate change the most constraining factor for the PU food production potential, while dietary pattern change and the subsequent demand change is most important in Eastern Europe. For 9 regions diet changes have the second largest impact on relative urban food supply, namely in Australia, Eastern, Southern, South-Eastern Asia, Northern Europe, Northern, Central and South America. Also, in relative terms, climate change is not the dominant factor for PU agriculture by 2050. This holds for the RCP2.6 and RCP8.5 scenarios. However, an exception is Southern Europe and Northern and Western Africa, where the optimal situation will be shrinking considerably.

Figure 2. Upper panel: current nourishment potential (2010) in peri-urban regions worldwide for cities with more than 100 000 residents. Middle panel: maximum nourishment potential of PU agriculture for a maximum yield scenario and the actual food demand (2010). Lower panel: change of the potential of PU agriculture under RCP8.5 for 2050 considering diet changes and urban growth (notice the increased point size).
Download figure:
Standard image High-resolution image
Figure 3. (a) Most important factors influencing future urban food self-sufficiency: purple — urban growth, yellow — diet change (food demand) and turquoise — climate change. (b) Radar plots showing the different influence factors on future urban food demand for 19 world regions in 2050. The vertical gray numbers in the diagram indicate the amount of urban food production considering population growth, changing diet styles, and climate change in 2050. For each factor, the other two were kept constant in order to evaluate the most relevant influencing factors Left panel: relative change in comparison to the baseline (2010, gray); right panel: absolute potential for 2050 in percent.
Download figure:
Standard image High-resolution imageTable 1. The number of urban dwellers which can be nourished by peri-urban agriculture for current conditions, considering an optimized yield, and a future scenario for RCP8.5 (Representative concentration pathway with comparatively high greenhouse gas emissions, Riahi et al 2011) also considering an optimized yield. Note, the 2050 scenario includes climate, urbanisation, and diet changes. Which role the latter play is shown in detail in figure 3(b), left panel.
| Pop. [106] | % of total pop. | % of global urb. pop. | |
|---|---|---|---|
| Current | 1094 | 15.8 | 30.6 |
| Opt. current | 1261 | 18.2 | 35.3 |
| Opt. 2050 RCP8.5 | 1404 | 14.7 | 22.1 |
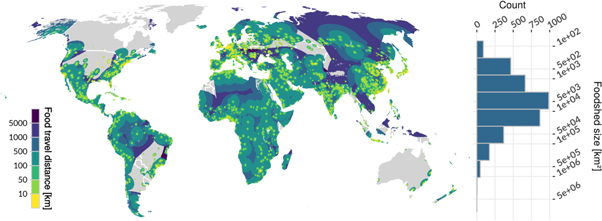
3.2. Urban foodsheds and the mitigation potential from urban food transport
So far only a limited amount of urban hinterland was used to estimate the PU food production potential. In order to estimate the effect of food transport on fossil fuel use, one has to figure out how much land is needed to nourish all citizens of an urban agglomeration. For this purpose, the so-called urban foodshed concept has been defined. Again the land use share is kept constant, but the urban hinterland is stepwise increased until it can produce sufficient food for all urban residents. Figure 4, left panel, shows urban foodsheds and the associated transport distance of food into the identified UCs. A major result is that most foodsheds are larger than 5000 km2 (figure 4, top-right panel) which relates to a circle with a diameter of approximately 80 km. Consequently, at least inter-local food transport and trade is unavoidable and in many cases, even global food transport trade would be needed to nourish cities (e.g. D'Odorico et al 2014). Nevertheless, global food transport is an issue which needs particular concern. It has been shown that global food transport is increasing considerably in recent decades (Smith et al 2005) and therefore it is still worthwhile to estimate sector effects as climate change mitigation options have to start in sectors.
Figure 4. Left panel: optimized foodsheds for UC and the corresponding travel distance which food needs to bridge the gap between field and fork; right panel: frequency distribution of foodshed size.
Download figure:
Standard image High-resolution image
Weber and Matthews (2008) estimated that 11% of total agricultural emissions could be related to food transport, while others argue that emissions from food transport are neglectable, because of food production via low-intensity farming methods and shipping it around the globe is always better than producing food locally using high-intensity agriculture (Avetisyan et al 2014, Dalin and Rodriguez-Iturbe 2016). Indeed emissions factors are much lower for maritime shipping (see SI and Fitzgerald et al 2011). Although global accounting of emission factors in food transport is somewhat uncertain, the foodshed approach allows us to estimate the mitigation potential in the food transport sector assuming that local food production could be a sustainability strategy for cities (figure 4, left bottom panel). Moreover, in this study we applied the lowest values (see SI) in order not to overestimate effects and excluded air transport, although the latter is increasing over-proportional due to the transport of more luxury food.
In this paper, we also assume an optimized transport scenario which applies the shortest distances from food production sites into the urban foodsheds. On the basis of the applied approach, our findings estimate a global emission of around 0.15 Gt CO2/yr for a distance optimized food transport scenario. Taking into account that the total emissions from agriculture (including production, storage, packaging) amounts up to 19%–29% of total emissions and that additional 5%–10% accounts for transport and other postprocessing activities on food (e.g. Vermeulen et al 2012), approximately 14–18 Gt CO2eq. emissions are assumed to be released from the agricultural sector in 2007. Considering the Weber and Matthews (2008) estimate that food transport is actually responsible for approx. 1.5–2.0 Gt of CO2eq. emissions per year our optimized estimation shows the emissions saving potential. Namely, that on a global scale an optimized food transport can reduce transport emissions by approximately a factor of 10. Although an approximate saving of roughly 1 Gt CO2eq. seems to be small one can argue that climate change, population growth and dietary pattern may further increase emissions in the future, as e.g. food demand is increasing and urban centers are unlikely to optimize PU food production. Therefore, if future food transport will rely on fossil fuel driven engines, our approach highlights that agricultural production in the near vicinity of consumers could help to reduce emissions considerably.
4. Discussion
The achieved results show that urban agriculture can create several co-benefits in terms of future urban development and climate protection. First, PU agriculture has a potential to create local circular food economies, e.g. through the reuse of human-derived nutrients as fertilizer, which could also enhance access to fertilizers in low-income countries and close the nutrient cycle (Trimmer and Guest 2018). Second, PU agriculture could play a key role in avoiding food loss and waste by shortening the distance from field to fork as the production sites are on average in vicinity of around 6 km around the city border. Furthermore, it has been shown that actual food waste (loss) associated GHG emissions could reach up to 1.9–2.5 Gt CO2eq/yr in the year 2050 (Hic et al 2016) if production mechanisms do not change.
Nevertheless, the disadvantages of the study should also not be neglected. In many regions, a sufficient freshwater supply is an essential factor for PU agriculture. Actually, we use only already existing agricultural areas in our analysis and consequently, the water demand for agricultural purposes will not alter the current water balance in the PU region. However, due to the ongoing urbanization, the urban water demand will further increase, i.e. putting more agricultural areas into a competition for water resources. Flörke et al (2018) compute an urban surface-water deficit of approx. 1–6 million cubic meters for the year 2050.
Finally, the potential of PU agriculture has declined in the past as a result of urbanisation and agronomic trends (Zumkehr and Campbell 2015). Our results indicate that this trend will further continue (see figure 3(b)). Considering the previous point one should also take urban agriculture into account. As the results presented by Clinton et al (2018) show urban agriculture could offer similar benefits as PU agriculture, but would be even more connected to the urban population. This could enfold further positive effects, namely increased energy efficiency and yields through a clear co-location of urban agriculture operations (Mohareb et al 2017). However, urban agriculture is strongly limited by the available area within the cities. As an example, it would already require one-third of the total global urban area to meet the global vegetable consumption of urban dwellers (Martellozzo et al 2014). Thus, urban agriculture cannot be able to provide a major part of required calorie demand, but especially for fresh and high-value food products, like vegetables, for shortening market chains, and local income provision it could be an option. Thus, PU and urban agriculture should not be considered as competing but as complementary approaches.
5. Conclusion
Overall, we can draw five important conclusions. First, food transport into cities creates carbon emissions which can be reduced by utilizing local land resources. In comparison to our estimates, the effect can be even larger as assumed, because in the analysis current land use shares were kept constant for the future. Thus, sustainable land use practices may create further positive effects.
Second, large numbers of urban residents can be nourished via PU agriculture, although on the global scale the situation is quite diverse. While in Southern Asia 82% and in Eastern Africa 79% can be nourished, in Southern Africa this number only amounts to 43% (table 5, SI). Moreover, detailed analyses show that, for example, in Southern and South-East Asia large amounts of the urban hinterland are already used for PU farming (e.g. 96% in India). Thus, in these regions a further extension is not a solution to ensure future food security. The only remaining options are improving productivity and closing yield gaps, which should always be the first intervention.
Third, our study shows that further urbanization puts, by far, the largest pressure on future urban food demand (table 6, SI) and consequently also on PU agriculture if one would consider such a strategy as a sustainability option. As urban growth mostly happens on the costs of the conversion of agricultural land into urban areas this is a crucial development, as it often takes place on cropland that is more productive than the average (Bren d'Amour et al 2017). If all agricultural land in the vicinity of urban centers is lost due to land conversion, even more food will need to be transported into these cities from distant agricultural areas.
Fourth, changing dietary habits are important for future food demand, particularly in developing regions, such as in Northern, Western, Eastern Africa, or South-East Asia. In the developed world they play a minor role.
Fifth, climate change will have an effect on PU food production, but with local specificities. In terms of world regions, the effect is most prominent in Northern and Western Africa, and Western Asia (table 6, SI). Looking more locally, climate change will affect the potential for PU agriculture also in the whole Mediterranean, the Indo-Gangetic Plain, and Southern China (figure 3(a)).
Summing up, with our study we provided a new model approach to quantitatively estimate the global potential of PU agriculture and combined it with other relevant effects like urbanisation, climate change, or dietary pattern changes. Such integrated approaches are of urgent need as they can provide local facets of global problems. Producing food locally, particularly for cities, is indeed a kind of adaptation as it ensures local food security, can close local nutrient cycles and reduces the dependence on the world market. Further optimization in terms of yield and land management can create additional positive effects in this context. Conversely, specific emission factors in local agricultural production can also compensate for emission savings from transport. This issue will be an aspect of further work. Concluding these detailed trade-off analysis show that any kind of pressure factor has an effect on local food security and will increase the dependency on international food trade, an effect which should be avoided due to sustainability reasons.
Acknowledgments
We thank S Becker, D Rybski, T Sterzel for helpful comments on the manuscript and G Fischer for his support on the GAEZ data. Furthermore, we appreciatively acknowledge the valuable and constructive comments from the anonymous reviewers. This work was supported by the German Federal Ministry for the Environment, Nature Conservation, Building, and Nuclear Safety (International Climate Protection Initiative).