

Abstract
During 2012, flash drought developed and subsequently expanded across large areas of the Central United States (US) with severe impacts to overall water resources and warm-season agricultural production. Recent efforts have yielded a methodology to detect and quantify flash drought occurrence and rate of intensification from climatological datasets via the standardized evaporative stress ratio (SESR). This study utilizes the North American Regional Reanalysis and applied the SESR methodology to quantify the spatial and temporal development and expansion of flash drought conditions during 2012. Critical results include the identification of the flash drought epicenter and subsequent spread of flash drought conditions radially outward with varying rates of intensification. Further, a comparison of the SESR analyses with surface-atmosphere coupling metrics demonstrated that a hostile environment developed across the region, which limited the formation of deep atmospheric convection, exacerbated evaporative stress, and perpetuated flash drought development and enhanced its radial spread across the Central US.
Export citation and abstract BibTeX RIS

Original content from this work may be used under the terms of the Creative Commons Attribution 3.0 licence. Any further distribution of this work must maintain attribution to the author(s) and the title of the work, journal citation and DOI.
1. Introduction
The United States (US) drought of 2012 was an extreme event of historic proportions. At its peak, it covered most of the contiguous US and represented the fourth largest drought by aerial extent since 1895 (Knapp et al 2015). Within the Great Plains region of the Central US, precipitation deficits during the most critical portion of the growing season exceeded those of the most extreme drought years during the Dust Bowl (Schubert et al 2004), and were the greatest noted in the modern-day historical record dating to 1895 (Hoerling et al 2014). Severe impacts were observed on regional ecosystems (Mallya et al 2013, Knapp et al 2015, Sippel et al 2016, Wolf et al 2016, Zhou et al 2017) and agricultural productivity (Boyer et al 2013); in the heavily irrigated region of central Nebraska, the drought led to increased water usage and subsequent groundwater declines that took years to recover (Young et al 2018). In total, economic losses from the drought were estimated to be in excess of $30 billion across the entire nation (NCEI 2017). Impacts from the 2012 drought ultimately effected energy systems, created water shortages and navigational disruptions, and reduced employment in rural areas (Grigg 2014).
Drought in the Central US has been attributed to numerous local to global factors including surface-atmosphere feedbacks, persistent synoptic patterns, and large-scale teleconnections (Basara et al 2013). As such, the overall evolution of the 2012 drought was inherently complex. It was embedded within an extended period of continuous drought in the US that spanned late 2010 through mid 2015, a period that also included notable extreme drought events in the Southern Great Plains (Hoerling et al 2013, Seager et al 2013) and California (Griffin and Anchukaitis 2014, Seager et al 2015). In addition, La Nina conditions during the winter of 2011–2012, resulted in broad regions of the US experiencing drier-than-normal conditions (Rippey 2015). The resulting implications for the regional atmospheric circulation, which included a displaced stormtrack, limited moisture return, and broad subsidence, led to large negative standardized anomalies in precipitation, runoff, and soil moisture and positive anomalies in temperature (Hoerling et al 2013). Persistent negative soil moisture anomalies were also observed (Otkin et al 2016), which were further strongly coupled to atmospheric processes during this period (Basara and Christian 2018).
The nature of the 2012 Central US drought's evolution is of particular interest, specifically its rapid geographic expansion and marked intensification from non-drought to extreme/exceptional drought conditions during the growing season (AghaKouchak 2014, McEvoy et al 2016, Otkin et al 2016). As noted by Otkin et al (2016) and displayed in figure 1, the vast majority of the Central US domain (the region east of the Rocky Mountains and west of the Great Lakes) was drought-free or abnormally dry, D0, as late as mid-May 2012 as defined by the US Drought Monitor (Svoboda et al 2002). However, drought quickly enveloped the region, with large portions of the Central US deteriorating into D3 (Extreme) or D4 (Exceptional) drought by July. During this period of rapid intensification, drought intensities increased in magnitude by four or even five US Drought Monitor categories in fewer than two months.

Figure 1. Drought categories across the Central US for 08 May 2012 (i.e. prior to flash drought onset) and 09 October 2012 (i.e. after flash drought development) as indicated by the US Drought Monitor (Svoboda et al 2002).
Download figure:
Standard image High-resolution imageSuch rapid intensification is consistent with the definition of flash drought by Otkin et al (2018). Flash droughts occur during periods when extreme precipitation deficits combined with increased surface temperature, wind speed, downwelling shortwave radiation, and/or vapor pressure deficits persist for several weeks. This leads to the rapid depletion of soil moisture, increased evaporative stress, and the rapid intensification of drought conditions and associated impacts. Christian et al (2019) developed a methodology to identify flash drought using a standardized form of the ratio between evapotranspiration and potential evapotranspiration: the standardized evaporative stress ratio (SESR). This ratio is based on previous satellite-based studies focused on evaporative stress (Anderson et al 2007a, 2007b, Otkin et al 2013) and is inversely proportional to the amount of evaporative stress on the environment. The use of SESR is advantageous for flash drought identification as it incorporates numerous variables (Otkin et al 2014, Ford et al 2015, Hobbins et al 2016, McEvoy et al 2016, Otkin et al 2016, Otkin et al 2019.
Because flash drought is a relatively new area of study and yet has critical impacts, the objectives of this study were to (1) quantify the rapid evolution and expansion of the 2012 historic drought in the Central US, using the SESR, and (2) identify critical feedbacks via land-atmosphere interactions that accentuated the 2012 drought's intensification, perpetuation, and propagation.
2. Data and methods
The North American Regional Reanalysis (NARR) was used to investigate the evolution of the 2012 flash drought across the Central US, in particular to examine land-atmosphere interactions that develop and propagate of flash drought conditions. The NARR has a spatial resolution of 32 km with 29 vertical levels (Mesinger et al 2006). Computed quantities include the SESR, as well as the convective triggering potential (CTP) and low level humidity index (HI) methodology originally developed by Findell and Eltahir (2003a). The domain for analysis was bounded by a north and south latitude of 49°N and 33.5°N, respectively, and a west and east longitude of −104°W and 87°W, respectively.
Using the flash drought definition of Otkin et al (2018) and the methodology developed by Christian et al (2019), NARR grid points across the Central US in 2012 were analyzed for flash drought occurrence via standardized ESR (SESR) and changes in SESR. ESR is defined as:

where ET is evapotranspiration and PET potential evapotranspiration. Specifically within the Noah land surface model in the NARR dataset, total surface ET is computed from soil evaporation, transpiration from the vegetation canopy, evaporation of dew/frost or canopy-intercepted precipitation, and snow sublimation (Mesinger et al 2006) while PET is calculated using the modified Penman scheme from Mahrt and Ek (1984). SESR and the change in SESR are defined as:
where  (referred to as SESR) and
  (referred to as ΔSESR) are the z-scores of ESR and the change in SESR, respectively, for a specific pentad (p) at a specific grid point (i, j). As described in Christian et al (2019), four restrictive criteria were employed to identify flash drought occurrence at a given location. These include two criteria that emphasized the rapid intensification toward drought and two criteria focused on vegetative impacts, summarized as:
- A negative trend of SESR for a minimum length of five pentads,
- A final SESR value below the 20th percentile,
- Pentad-to-pentad changes in SESR (ΔSESR) below the 40th percentile,
- Change in SESR over the entirety of the flash drought below the 25th percentile.
This methodology applied to the NARR dataset has been shown to compare well with the satellite-based evaporative stress index (ESI), drought depiction from the USDM, and previously identified flash drought cases (Christian et al 2019). For locations identified as having experienced flash drought, the date whereby flash drought began was partitioned by month. In addition, the spatial coverage of flash drought across the region was calculated from the aggregate of grid points that experienced flash drought.
Convection is a critical contributor to total precipitation during the growing season across the Central US (Haberlie and Ashley 2019). As such, processes that suppress convective initiation and propagation are critical to drought and flash drought development. Further, the Central US is a region known for strong land-atmosphere interactions (Koster et al 2004, Guo and Dirmeyer 2013, Koster et al 2016) which can yield feedback processes that enhance drought development (Hoerling et al 2013, Roundy et al 2013, Basara and Christian 2018, Wakefield et al 2019). Gerken et al (2018) utilized the CTP and HI framework in the analysis of 2017 flash drought conditions in the Northern Plains of the US and noted that incorporating land-atmosphere interactions has broad utility to understanding flash drought development. As such, to examine feedback processes and convective suppression related to flash drought development and expansion in 2012, the CTP and HI framework was utilized; the framework is described in Findell and Eltahir (2003a, 2003b) whereby CTP is determined by:
- (1)Locating the moist adiabat which intersects the temperature profile 100 hPa above ground level (AGL).
- (2)Integrating the area between this moist adiabat and the temperature profile from 100 hPa AGL to 300 hPa AGL.
Further, HI is found by summing the dewpoint depressions at 50 and 150 hPa AGL as follows:

The framework quantifies pre-existing instability within the lower portions of the atmosphere, pre-existing moisture in the atmosphere before development of the convective boundary layer, and indirectly the overall atmospheric moisture content in the lower troposphere. Following the methods of Wakefield et al (2019), daily standardized anomalies of CTP and HI were computed for the NARR dataset (1979 through 2017). These standardized anomalies (hereafter, CTPz and HIz) allow for comparison of CTP and HI in both time and space where significant variations in mean CTP and HI values occur. When averaged over longer time periods, these values yield persistence of moisture within the boundary layer as well as covariability with variables that impact evaporative stress (Wakefield et al 2019).
3. Results
3.1. Flash drought expansion
The flash drought in 2012 began during April, with an epicenter located over north-central Kansas (figure 2) immediately adjacent to an area of long-term drought (which lingered from 2011) across southwest Kansas (figure 1). During May 2012, rapid drought development expanded north into Nebraska, South Dakota, and North Dakota, eastward across Missouri and Illinois, and southeastward into Oklahoma and Arkansas. Conversely, localized above-normal precipitation (positive values of the one-month standardized precipitation index; SPI; McKee et al 1993, 1995) for the month of May across the northern Great Plains and Midwest acted to inhibit flash drought development in southeast Nebraska and Iowa (figure 3). Overall, the areal coverage identified to have experienced flash drought across the central United States in May 2012 spanned approximately 299 000 km (figure 2).
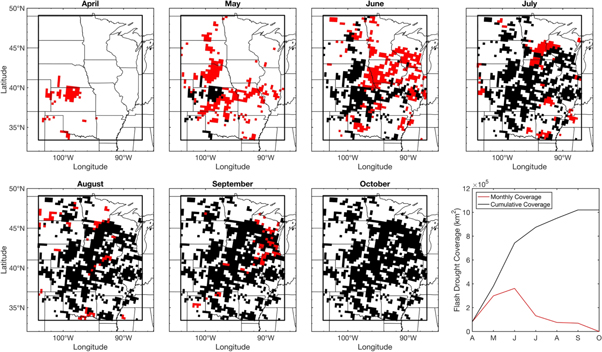
Figure 2. Expansion of flash drought across the Central United States during the growing season (April through October) using SESR derived from NARR. Red pixels indicate locations where flash drought began in a specified month. Black pixels indicate locations where flash drought began in a previous month. The last panel shows the cumulative and monthly spatial coverage of flash drought across the domain.
Download figure:
Standard image High-resolution image
Figure 3. 1 month SPI from NARR across the Central United States for the growing season (April through October).
Download figure:
Standard image High-resolution imageDuring June 2012, flash drought expanded in multiple areas across the central Great Plains and Midwest. The first of these areas included southeast Kansas and southwest Oklahoma, located along the periphery of a region that had already experienced flash drought during May. In addition, a broad region extending across southeast Nebraska, Iowa, Illinois, and the southern portion of Wisconsin experienced flash drought during the month of June. In total, these locations contributed approximately 361 000 km2 of new land area that experienced rapid onset of drought, the highest among all months of the 2012 growing season.
The remainder of the 2012 growing season saw modest additional flash drought expansion in the Central US. In July 2012, the primary regions exhibiting new flash drought included northern Iowa, southern Minnesota, western Wisconsin, central Missouri, and southern Arkansas, while during August 2012, portions of Oklahoma, Iowa, Minnesota, and North Dakota also experienced flash drought. Flash drought development during September was isolated to the Midwest across northwestern Illinois and several locations in Wisconsin, as isolated areas or 'gaps' within the spatial coverage of flash drought development were finally filled.
The total land area across the Central US study domain that experienced flash drought at any point during the 2012 growing season was approximately 1008 640 km2, constituting over 40% of the total land area in the domain. From a historical perspective, based on the Christian et al (2019) methodology applied to the entire 1979–2016 NARR period, the 2012 flash drought ranks as the 2nd highest in total spatial coverage within the study domain during the growing season. While some locations in the analysis and domain did not reach the flash drought criteria as defined by Christian et al (2019), these locations did experience drought onset.
Representative locations within the domain were chosen to illustrate the temporal evolution of flash drought using SESR during different expansion periods within the 2012 growing season (figure 4; locations shown in figure 5). Near the epicenter of the 2012 flash drought event, the overall change in SESR was exceptionally dramatic with values declining 3.5 standard deviations in only 30 d. Specifically, SESR decreased by 2.4 standard deviations during the last 15 d of the rapid drought intensification, which was the largest negative change in SESR for that grid point at that given time of year in the climatological record of NARR (figure 4(a)). For regions to the southeast (north-central Oklahoma) and east (north-central Missouri) of the flash drought epicenter in north-central Kansas, rapid drought development began approximately one week later (figures 4(b) and (c)). Conversely, evaporative stress increased rapidly in central Nebraska in late May 2012, approximately four weeks after rapid onset drought began in Oklahoma and Kansas (figure 4(d)).

Figure 4. SESR (red line) from the NARR dataset for six locations across the Great Plains and Midwest. The shaded tan region on each panel represents the temporal period for flash drought from the flash drought identification methodology.
Download figure:
Standard image High-resolution image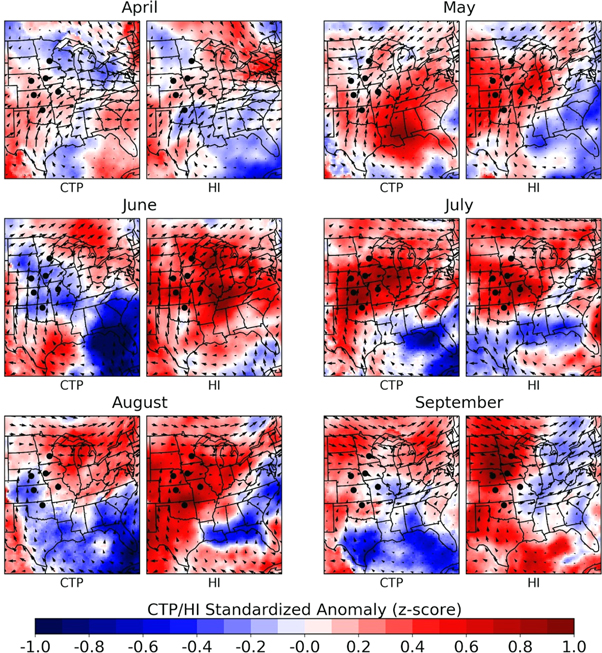
Figure 5. Monthly averaged CTP and HI standardized anomalies (CTPz and HIz) for April through September of 2012. Red pixels are above normal while blue are below normal. Arrows represent the mean monthly 850 mb wind speed and direction. Black dots indicate the location of each flash drought case from figure 4.
Download figure:
Standard image High-resolution image
In west-central Iowa, SESR began to decline in early May 2012, but was moderated by precipitation in May and June (figures 3 and 4(e)). In fact, June 2012 precipitation in the region was at or slightly above normal (figure 3). However, this precipitation was not sufficient to prevent rapid intensification toward drought due to exceptionally hot and cloud-free conditions. As such, SESR sharply declined from late June to mid-July 2012 during a subsequent period of negative precipitation anomalies.
As noted in figure 2, an extensive region of additional flash drought development occurred in late July 2012 for southeastern Minnesota and west-central Wisconsin. This can be seen in figure 4(f), where rapid drought intensification lasted for approximately 40 days and ended in late August 2012. Examination of the SPI reveals that the region received above-normal totals through the early portion of the season which initially staved off drought development (figure 3). However, with the onset of negative precipitation anomalies, flash drought rapidly developed soon thereafter.
3.2. Surface-atmosphere interactions and feedbacks
Positive HI values represent a drier-than-normal lower atmosphere and reduced relative humidity in the boundary layer during the day while CTP is measured within a layer that slightly overlaps that of HI but is generally at higher altitude. As such, positive values of CTP further indicate a drier atmospheric column aloft. Turbulence in the boundary layer during the day mixes this drier air aloft toward the surface which reduces the relative humidity and enhances evaporative stress. Thus, a combination of positive CTP and HI z-scores (hereafter referred to as CTPz and HIz to distinguish this framework from that presented by Findell and Eltahir 2003a, 2003b) represents an abnormally dry air mass conducive for enhanced evaporative stress in the surface layer and hostile to precipitation generation within the boundary layer and lower troposphere.
Persistent, positive HIz was established throughout the Great Plains and Corn Belt beginning in April 2012, while CTPz was more variable (figure 5). Positive CTPz over one region may be measured as negative downstream, where the air mass originally in contact with the drought affected land surface upstream may become elevated over the downstream land surface and can serve as a strong inversion or elevated mixed layer in the region of the atmospheric profile where CTP is computed (Wakefield et al 2019). This is especially likely when coupled with positive HIz. An elevated mixed layer can then suppress convective precipitation, aiding in the reduction of rainfall. The first Central US locations to experience flash drought (figure 2), and in particular the flash drought epicenter in Kansas, were characterized by positive CTPz and HIz during April and May 2012. Remnant, long-term drought in western Texas and eastern New Mexico remained present through the winter months of 2011–2012 and into the spring of 2012. As such, much of the region upstream, over, and downstream of the flash drought epicenter was characterized by mean positive CTPz and HIz for both April and May 2012, indicating that the entire lower atmospheric column was anomalously dry.
The presence of mean positive CTPz and HIz conditions was due, in part, to the circulation around a lower-tropospheric ridge centered over the Gulf of Mexico (GOM) which led to continuous advection of drought modified air masses from Texas and New Mexico into Oklahoma, Missouri and Kansas and even further downstream into Nebraska, Iowa and Minnesota. As a result, expansion of drought was observed along lower tropospheric streamlines during May 2012, particularly from Kansas through Illinois where drought modified air mass was transported over adjacent regions where drought intensified. In June 2012, the northward shift of the GOM ridge center led to a stronger southerly component to lower tropospheric winds and enhanced advection of positive HIz into Nebraska, Iowa and Minnesota. The CTPz values were negative across much of the same region during this same period, but when coupled with positive HIz suggests that the lower atmosphere was dry and strongly capped making conditions unfavorable for surface-based convection. In addition, local HIz maxima were observed in regions where flash drought had already occurred, particularly north-central Kansas. As such, the southwest/northeast axis of flash drought expansion during June 2012 was aligned with lower-tropospheric southwesterly winds that incorporated a substantial fetch over areas with positive HIz.
The advection of the hostile air mass into Minnesota occurred during May and June. CTPz and HIz were both positive throughout much of the period, such that local evaporative demand remained elevated within the surface layer and reinforced by boundary-layer feedbacks. Further, the trajectory of lower-tropospheric winds (e.g. 850 mb) during August 2012 over eastern Kansas, Missouri and Oklahoma allowed for persistence of drought conditions, while northern locations were influenced predominantly by westerly/northwesterly winds during August and September 2012. Such conditions (figure 5) prevented drought recovery through continued advection of dry, hostile air masses from drought affected regions upstream. Locations with the earliest onset of flash drought had persistent, positive HIz with greater magnitudes in July and August 2012 than those with later flash drought onset. The range of CTP and HI z-scores was also larger following flash drought onset.
4. Discussion and conclusions
Not all drought is the same, as fundamentally, various physical processes can inhibit precipitation thus leading to drought at multiple spatial and temporal scales. Overall, the 2012 Central US drought can be considered an historic and extreme event. The rapid intensification and expansion of drought in the Central US occurred at shorter timescales than other locations impacted by the same broad, long-term drought (e.g. Southwest US). This rapid development was consistent with the characteristics of a flash drought, one that began with an epicenter in the central Great Plains followed by quasi-radial expansion throughout the larger Central US domain. While the 2012 drought as a whole has been well established as an historic event, the flash drought component observed in the Central US was also historic, with over 1250 000 km2 meeting the criteria for flash drought. This would rank near the top of total flash drought coverage in a year across the Central US domain during the satellite record.
Two main results were revealed from the analysis of flash drought development and extent. First, the Central US domain had near-normal or above-normal SESR values just before the rapid development of drought. Thus, antecedent surface conditions did not serve to inhibit the development of flash drought. Second, the time series and spatial analysis of SESR demonstrated that flash drought did not develop uniformly across the region. Rather, the majority of flash drought in the Central US occurred along areas adjacent to prior flash drought development earlier in the study period. Therefore, the Central US flash drought should not be considered a single, linear event, but rather as an evolving phenomenon that propagated and spread through space and time.
Additionally, the timing of flash drought onset was closely tied to the advection of a hostile air mass from regions already impacted by drought. CTPz and HIz provide information concerning the atmospheric component of land-atmosphere feedbacks and, in the case of the 2012 drought, they demonstrated anomalies of moisture in the lower atmosphere along with the subsequent persistence and movement of the dry air mass. Thus, land-atmosphere feedbacks through the boundary-layer contributed to anomalously dry air (elevated HIz) over drought impacted areas in the Central US. As such, while large-scale dynamics yielded overall environmental conditions conducive for drought development, the downstream advection of hostile air from adjacent, drought impacted areas (1) increased the atmospheric demand, (2) elevated the evaporative stress, all while (3) further suppressing deep convection critical to overall precipitation and water availability of the region. In the end, the timing of increased evaporative stress and positive CTPz and HIz values not only drove flash drought development on a local scale, but accentuated the propagation of flash drought to adjacent areas, eventually spreading across the majority of the Central US.
The 2012 drought in the Central US was a function of many critical land-atmosphere components. While this study focused on rapid drought intensification through time and space, along with the impacts of local and non-local feedbacks associated with land-atmosphere interactions, it is important to note that large-scale drivers of drought were also extremely important (Hoerling et al 2013, Rippey 2015, Otkin et al 2016). In fact, it was the combination and interaction of various physical processes at multiple timescales that led to the cascading evolution of flash drought, sustained drought, and drought impacts during the 2012 growing season.
It is also critical to note that the methodology developed by Christian et al (2019) provides an innovative framework for examining flash drought given its incorporation of multiple environmental conditions within a standardized approach. As such, it should be utilized in drought monitoring as well as future studies that examine additional past drought events in the Central US (e.g. 1988, 2006, etc) along with historical drought development across the globe to better quantify the role and mechanisms of flash drought and land-atmosphere feedbacks in cascading events.
Acknowledgments
This work was supported, in part, by the NOAA Climate Program Office's Sectoral Applications Research Program (SARP) grant NA130AR4310122, the Agriculture and Food Research Initiative Competitive Grant No. 2013-69002 from the USDA National Institute of Food and Agriculture, the USDA National Institute of Food and Agricultural (NIFA) Grant No. 2016-68002-24967, the USDA-ARS Southern Great Plains Climate Hub Cooperative Agreement 58-3070-8-012, and the NASA SMD Earth Science Division through the Earth Science Application: Water Resources Program. The data from the NARR used in this study is available at https://esrl.noaa.gov/psd/data/gridded/data.narr.html. The authors would also like to acknowledge the anonymous reviewers who provided critical feedback that improved this manuscript.