


Abstract
Drought is increasing in frequency and severity, exacerbating food and water security risks in an era of continued global warming and human population growth. Here, we analyzed a severe summer drought affecting the US Northern Plains region in 2017. We examined the spatial pattern and seasonal progression of vegetation productivity and water use in the region using satellite-based estimates of field-scale (30 m) cropland evapotranspiration (ET), county level annual crop production statistics, and GOME-2 satellite observations of solar-induced chlorophyll fluorescence (SIF). The cropland ET record shows strong potential to track seasonal cropland water demands spatially, with strong correspondence to regional climate variables in the Northern Plains. The GOME-2 SIF record shows significant but limited correlations with finer scale climate variability due to the coarse sensor footprint, but captured an anomalous regional productivity decline coincident with drought related decreases in crop production and ET. The drought contributed to an overall 25% reduction in cropland ET, 6% decrease in crop production, and 11% reduction in SIF productivity over the region from April to September in 2017 relative to the longer (2008–2017) satellite record. More severely impacted agricultural areas indicated by the US Drought Monitor exceptional drought (D4) category represented 11% of the region and showed much larger anomalous ET (20%–81%) and productivity (11%–73%) declines. The regional pattern of drought impacts indicated more severe productivity and ET reductions in the north central and southern counties with extensive agriculture, and less impact in the western counties of the Northern Plains. This study provides a multiscale assessment of drought related impacts on regional productivity and ET over a crop intensive region, emphasizing the use of global satellite observations capable of informing regional to global scale water and food security assessments.
Export citation and abstract BibTeX RIS

Original content from this work may be used under the terms of the Creative Commons Attribution 3.0 licence. Any further distribution of this work must maintain attribution to the author(s) and the title of the work, journal citation and DOI.
1. Introduction
Global warming is enhancing the frequency and severity extreme climatic events including drought (Hao et al 2013, AghaKouchak et al 2014, Trugman et al 2018), which is one of the most complex and costliest natural disasters affecting humans and the environment (Luo and Wood 2007, Mishra and Singh 2010, Wang et al 2014). Large-scale droughts have been reported to weaken the terrestrial carbon sink and intensify competition between food demand and biofuel production (Zhao and Running 2010). Drought often shows direct and immediate impacts on agricultural land due to the strong dependence of various stages of crop growth on water resources (Narasimhan and Srinivasan 2005, Martínez-Fernández et al 2016, Peng et al 2018), severely influencing crop production and food security (Lobell et al 2011, Trnka et al 2012, Madadgar et al 2017). For example, the negative effects of drought resulted in 0.1%–1.2% reductions in annual corn and soybean yields in dryland counties in the United States from 2001 to 2013, while irrigated counties showed slightly smaller (0.1%–0.5%) reductions in annual crop yields (Kuwayama et al 2018). Less frequent, but more extreme drought events have had a much larger impact on agricultural productivity and economic losses, even in regions with a relatively well developed water management infrastructure. For example, a recent severe drought was reported to have cost the California agricultural industry $1.5 billion in 2014 (Howitt et al 2014).
Flash drought usually occurs with decreased soil moisture associated with anomalously high temperatures and increases in evapotranspiration (ET) (Mo and Lettenmaier 2015, Otkin et al 2018). It is difficult to predict and has a substantial impact on agricultural lands due to the extreme heat or precipitation deficit associated with its occurrence (Gerken et al 2018, Otkin et al 2018). In 2017, the US Drought Monitor (USDM, Svoboda et al 2002) documented a particularly severe flash drought over the Northern Plains region of the continental US (CONUS), with about 83% of the total land area experiencing abnormally dry conditions, which severely impacted the agricultural industry. Agriculture is the leading industry in the Northern Plains, contributing about $4.39B, $7.56B, $6.05B and $1.72B to the economy in 2016 for the states of MT, ND, SD and WY, respectively. Thus, agriculture is a very important economic force in the Northern Plains. However, relatively few studies have explored the impact of the recent drought on croplands in the Northern Plains, while detailed climate impact assessments and capabilities for regional monitoring are constrained by a relatively sparse regional weather station network (Horel and Dong 2010). Alternatively, consistent multi-scale satellite observational records may provide a new perspective on the regional impact of the 2017 drought on croplands across the Northern Plains. These records include field scale cropland ET and regional scale solar-induced chlorophyll fluorescence (SIF) observations that are sensitive to land use and climate variability, and provide continuous observations over multiple years and the entire region. When used on context with other available information, these observations may provide an effective assessment of drought related impacts on cropland water use and productivity.
In this study, we evaluated the impact of the 2017 Northern Plains flash drought on regional cropland ET and productivity (figure 1). A satellite-based 30 m 8 d CONUS cropland ET record (He et al 2019) was used with coarser (0.5°) monthly SIF observations from the GOME-2 satellite (Joiner et al 2016) to characterize the patterns and seasonal changes in cropland water use and productivity. The satellite observations were used with reported county-level crop production and available climate data to characterize drought related impacts relative to the recent historical record (2008–2017). The following sections provide a description of the Northern Plains and summary of the data and methods used in this study (section 2), a presentation of the major results from this investigation (section 3), and a concluding discussion of the study implications for regional drought monitoring and agricultural water management (section 4).
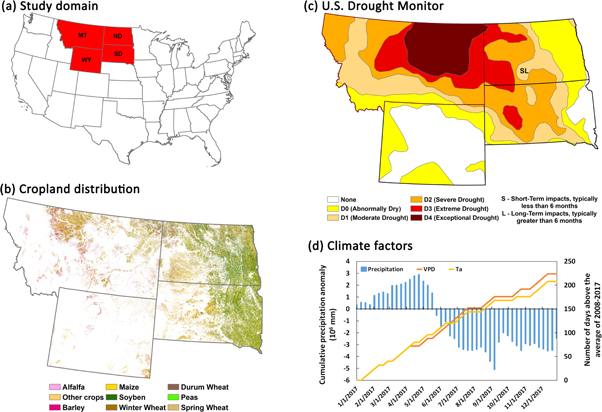
Figure 1. (a) Location of the Northern Plains in the Continental USA; (b) cropland distributions across the Northern Plains in 2017 based on Cropland Data Layer (CDL) from US Department of Agriculture (USDA) National Agriculture Statistics Service (NASS); (c) US Drought Monitor released on 5 September 2017; (d) Cumulative precipitation anomaly in 2017 over the Northern Plains relative to the ten-year time period (2008–2017) and cumulative number of days that vapor pressure deficit (VPD) and temperature (Ta) above the multiyear record.
Download figure:
Standard image High-resolution image2. Materials
2.1. Study domain and the USDM
The domain for this study includes the CONUS northern-tier states of the Northern Plains (figure 1(a)), including Montana (MT), Wyoming (WY), North Dakota (ND) and South Dakota (SD). The region encompasses the epicenter of the 2017 Northern Plains summer flash drought according to the USDM (figure 1(c)). Croplands accounted for about 28%–32% of the total land area of the Northern Plains from 2008 to 2017, with the largest area planted in 2017 (5.24 × 10⁷ hectares) and the smallest area in 2011 (4.59 × 10⁷ hectares). The major crops in this region include alfalfa, barley, wheat (spring, winter, durum), maize, and soybeans, which were mainly distributed in northern and eastern MT, eastern ND and SD in 2017 (figure 1(b)).
The USDM (Svoboda et al 2002) has been used as a benchmark for the identification of drought (Ford et al 2015, Schroeder et al 2016), providing a weekly map assessment showing the occurrence, spatial extent and relative severity of drought over the CONUS domain. The USDM is determined from expert assessments using climatological, hydrological and satellite-based information, including the Palmer Drought Severity Index, Standardized Precipitation Index, satellite-based assessments of vegetation health, and various indicators of soil moisture. According to the USDM, the study domain experienced a severe summer flash drought in 2017. The largest influencing areas of drought (D0: abnormally dry) were observed on 5 September 2017 (figure 1(c)), which affected about 83% of the total land area in the Northern Plains. About 23% of the domain was influenced by extreme drought (D3), which induced major crop losses and widespread water shortages (Gerken et al 2018).
2.2. Data and methods
2.2.1. ET data summary
Satellite-based ET modeling can provide an effective means for regional monitoring of ET water losses to inform operational water management, agricultural water use conditions (Anderson et al 2012) and regional drought assessments (Maes and Steppe 2012, Wardlow et al 2017). A consistent and continuous 30 m 8 d cropland ET record was recently developed using a satellite-based ET modeling framework that enables the delineation of field scale cropland water use across CONUS croplands, and is functionally consistent with coarser scale ET assessments available from global operational satellites (He et al 2019). The CONUS ET record provides the means for evaluating recent drought related impacts on cropland water use that account for the influence varying crop type conditions.
The 30 m and 8 d CONUS cropland ET record from He et al (2019) was extracted for the study domain (figure 1(a)). The ET record extends from 2008 to 2017, and was used to define the climatological conditions for evaluating potentially anomalous cropland water use variations during the 2017 drought relative to the long-term record. The cropland ET product used in this study employs a version of the MOD16 algorithm (Mu et al 2011) calibrated for C3 and C4 crop types and driven by finer scale regional inputs, including 30 m 8 d satellite vegetation cover (e.g. enhanced vegetation index), dynamic land cover from the USDA NASS Cropland Data Layer (CDL), and 4 km daily meteorological data from University of Idaho Gridded Surface Meteorological Dataset (Gridmet; Abatzoglou 2013). The ET product has also been found to provide favorable accuracy for the major CONUS crop types (He et al 2019). Unlike the global MOD16A2 record, the CONUS cropland ET record used in this study preserves field scale cropland ET heterogeneity, crop type differences and inter-annual variability across different agricultural fields under varying climate conditions. The 8 d ET anomaly is estimated in this study as the difference between ET estimates in 2017 and the mean 8 d ET climatology established from the 2008–2017 record. The cumulative ET anomalies are calculated as the sum of the 8 d ET anomalies for a given period for the entire study domain. The ET anomalies are extracted for each county in the study domain during the 2017 summer months (June–August) and used for analyzing the spatial and seasonal pattern of drought impacts on cropland water use.
2.2.2. Satellite SIF
Solar-induced chlorophyll florescence (SIF) is emitted directly by vegetation as a byproduct of photosynthesis, and provides a close observational proxy of vegetation status and productivity (Meroni et al 2009, Sun et al 2017). Global satellite observations of SIF from the ESA GOME-2 (Global Ozone Mapping Experiment 2) sensor have been used as a unique benchmark for agricultural productivity and climate impacts on crop yields (Guanter et al 2014, Guan et al 2016). The GOME-2 SIF record was able to track the spring onset and autumn termination of photosynthesis indicated by upscaled vegetation gross primary productivity estimates over croplands (Joiner et al 2014). The GOME-2 SIF record has also shown drought-related productivity declines, providing an important source of information for regional drought impact assessments (Sun et al 2015, Yoshida et al 2015). Recently, ground-based SIF measurements were found to correspond closely with plant transpiration (Lu et al 2018), owing to similar canopy stomatal controls on both photosynthetic CO2 exchange and transpiration (Miao et al 2018, Yang et al 2018).
The monthly 0.5° v27 SIF product (Joiner et al 2016) from the GOME-2 instrument on the ESA MetOp-A satellite (https://avdc.gsfc.nasa.gov/) was extracted for the study domain and 2008–2017 record. The GOME-2 SIF record was used in this study as a regional indicator of changes in vegetation productivity, but is too coarse to distinguish cropland from other surrounding vegetation communities. The SIF anomalies in 2017 were calculated as differences from a monthly SIF climatology derived from the longer GOME-2 operational record from 2008 to 2017 for each GOME-2 grid cell in the domain. County-level extractions of the GOME-2 SIF anomalies were also compared with similar aggregated cropland ET and NASS county crop production data over the domain.
2.2.3. Other supporting geospatial data
The USDA NASS annual 30 m CDL product was used to characterize spatial and annual variations in crop type and planted area across the study region over the 2008–2017 record (figure 1(b)). Annual county-level crop production data was also obtained from the NASS record to investigate the drought impact on annual cropland productivity across the region in 2017.
The Gridmet meteorological database (Abatzoglou 2013) is derived from temporally rich data from the North American Land Data Assimilation System Phase 2 (NLDAS-2; Mitchell et al 2004), and spatially rich data from the Parameter-elevation Regressions on Independent Slopes Model (PRISM; Daly et al 2008). Gridmet was used in this study to analyze variations in key regional climate variables over the 2008–2017 record. For analyzing regional climate patterns, the Gridmet daily precipitation was aggregated to coarser 8 d, monthly and annual time steps, while air temperature (Ta) and atmospheric vapor pressure deficit (VPD) were averaged over the same time steps for each grid cell, and then summed or averaged for the entire study region. Precipitation, Ta and VPD anomalies in 2017 were calculated on a grid cell basis as the difference from the climatological mean values established from the long-term (2008–2017) record. The anomalies were then summed or averaged over the entire Northern Plains domain. Reference ET (ETref) conditions for alfalfa were obtained using Gridmet daily meteorological inputs, following the methods of (He et al 2019). The regional cumulative ETref was then used with cumulative precipitation to calculate the climate aridity index (AI = precipitation/ETref), as an indicator of the degree of climate dryness over the study region in 2017. The resulting AI values were grouped into five general climate categories, including hyper-arid (AI < 0.05), arid (0.05 ≤ AI < 0.20), semi-arid (0.20 ≤ AI < 0.5), sub-humid (0.50 ≤ AI ≤ 0.65), and humid (AI > 0.65) conditions (UNESCO 1979).
The regional ET and productivity anomalies in this study were determined using normalized Z-scores to clarify the significance of the 2017 anomalies relative to 'normal' conditions represented by the recent historical record (2008–2017), and for more consistent comparisons among variables with different magnitudes and units. Here, the Z-score is calculated as  where
where  represents the different cropland variables examined, including ET, crop production, and SIF, while
  and
and  represent the associated means and standard deviations of these variables, respectively. In contrast, precipitation, Ta and VPD data were not normalized using the Z-score in this study; instead, the cumulative precipitation anomaly was computed as the difference from the long-term (2008–2017) mean, while the number of days and area in 2017 with above-normal Ta and VPD conditions was derived from the long-term record. Pearson's correlation coefficient (r) and the coefficient of determination (R2) are used in this study as measures of agreement using a 95% significance threshold (p ≤ 0.05).
3. Results
3.1. Climate conditions in 2017 across the northern plains
The estimated AI from April to September in 2017 indicates that the study region is predominantly semi-arid (AI = 0.24), with a significant drying trend over the 2017 growing season (r = −0.84; p < 0.05). The greatest dryness (AI = 0.20) is observed in early September, which is also depicted in the USDM (figure 1(c)).
Precipitation was very low for the region in 2017, indicated by large negative anomalies relative to the 2008–2017 record (figure 1(d)). Summer precipitation in the region for 2017 was about 26% below normal conditions and only accounted for 25% of the total annual precipitation. The rapid increase in the number of higher-than-normal Ta and VPD days also indicate generally warmer and drier conditions in 2017 compared to the recent historical record (figure 1(d)). The above results indicate a severe flash drought across the region in 2017, while this study provides an assessment of the associated impact of the drought on cropland ET and productivity.
3.2. Seasonal variation of drought impacts
The satellite-based 30 m 8 d cropland ET estimates in the growing season (April–September) of 2017 all show negative Z-scores, indicating that cropland water use was below-normal relative to the multiyear (2008–2017) average (figure 2). The VPD and Ta records show predominantly positive anomalies encompassing over 25% of the total land area in the domain (figure 2), indicating drier conditions in 2017 relative to the historical period; both parameters accounted for approximately 86% (R2) of the estimated ET seasonal anomaly in the region. A positive SIF Z-score in April reflects a relatively early growing season onset and enhanced spring productivity in 2017 (figure 2). However, the early growing season onset was followed by a large SIF decline and negative Z-scores from June to August, indicating 16%–18% below-normal summer productivity. Below-normal SIF summer productivity was followed by a return to near-neutral conditions in September coincident with the end of the effective growing season (figure 2). The growing season SIF anomaly is inversely proportional to VPD over the region (r = −0.58; p < 0.05), indicating reduced productivity under larger atmospheric moisture deficits. However, no obvious relationships were found between SIF and air temperature for the same period.

Figure 2. Temporal variations of z-scores of the 2017 growing season cropland evapotranspiration (ET), and solar-induce fluorescence (SIF); and the temporal variations of percentage of area that vapor pressure deficit (VPD) and air temperature (Ta) in 2017 above the average conditions of 2008–2017 in the Northern Plains.
Download figure:
Standard image High-resolution imageCumulative cropland ET anomalies extending from April to September were estimated over the entire Northern Plains in 2017 (figure 3(a)). The resulting ET anomalies show a strong declining regional trend indicating cumulatively lower cropland water use over the 2017 growing season, especially during the summer months. The cumulative ET anomaly was directly proportional to the cumulative precipitation anomaly (r = 0.90; p < 0.05; figure 3(b)). The negative ET anomalies are exacerbated under drier conditions and reduced in more humid environments (figure 3(b)), showing significant positive correlations with AI (r = 0.89; p < 0.05). The SIF anomalies are also directly proportional to cumulative precipitation (r = 0.67; p < 0.05), cumulative ET (r = 0.40; p < 0.05), and AI (r = 0.60; p < 0.05), indicating a strong moisture constraint on vegetation productivity in the region (figure 3(b)).
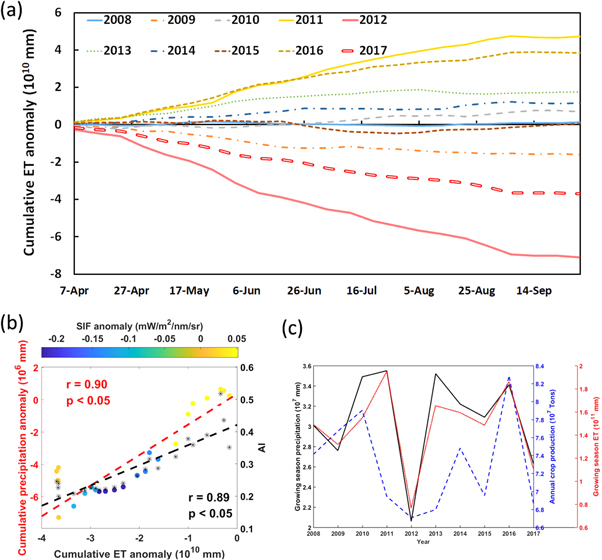
Figure 3. (a) Cumulative ET anomalies from April to September during 2008–2017 across the entire Northern Plains; (b) correlations between cumulative ET anomaly and cumulative precipitation anomaly (r = 0.90; p < 0.05), aridity index (AI; r = 0.89; p < 0.05), and GOME-2 SIF anomaly (r = 0.67; p < 0.05) during April–September in 2017 spanning the entire Northern Plains. (c) Inter-annual variations of growing season precipitation, crop production and cropland ET from 2008 to 2017 over the Northern Plains domain showing the 2017 drought in context with a more severe drought in 2012.
Download figure:
Standard image High-resolution image3.3. Spatial distribution of drought impacts on cropland
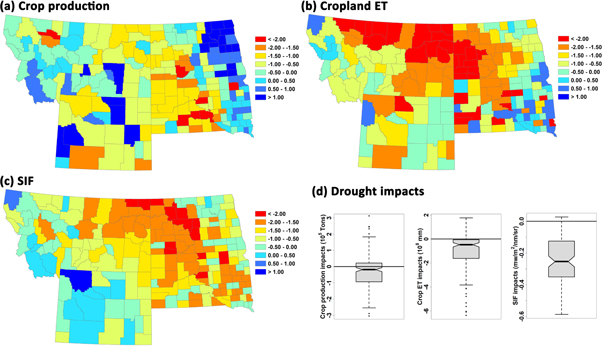
About 64% of the Northern Plains region experienced moderate drought (figure 1(c)) by early September of 2017, which coincided with cropland summer ET and SIF observations that were 21% and 19% below normal conditions indicated from the multi-year (2008–2017) record. The associated county-level summer ET, NASS annual crop production and summer SIF Z-scores (figure 4) show general consistency over the Northern Plains counties, with the largest drought related declines in ET (93%), crop production (99%) and SIF (59%) occurring in counties with extensive ranching and dryland agriculture. The NASS reported annual crop production levels for 2017 show large spatial variability across the Northern Plains relative to average conditions indicated from the long-term (2008–2017) record (figures 4(a) and (d)). Most counties (63%) show declines in annual crop production in 2017, with the most severe production decreases (11%–99%) in the north-central and southern portions of the region, where the USDM indicates severe to exceptional drought (figure 1(c)). The cropland ET (figure 4(b)) and SIF records show similar summer reductions (7%–93% and 3%–59%, respectively) in 2017 over the most drought-impacted north-central and southern counties (figure 4(c)). Annual crop production in 2017 shows slight increases in the northeastern counties of the domain (figure 4(a)), where the USDM documents abnormally dry conditions (figure 1(c)). Neutral conditions or small reductions in cropland ET during the summer of 2017 also occurred in this region (figure 4(b)). However, the 2017 summer SIF observations over the same region show spatial fluctuations both above and below normal conditions (figure 4(c)). The reported NASS crop production in 2017 (figure 4(a)) also indicates small productivity increases in the southeastern counties of the Northern Plains, where the USDM suggests no apparent drought impacts (figure 1(c)). The 2017 cropland summer ET results show both small positive and negative anomalies in this region (figure 4(b)). However, the 2017 SIF record shows generally less-than-normal summer productivity over the same counties (figure 4(c)). For all Northern Plains counties, the 2017 NASS reported annual crop production Z-scores were positively correlated with estimated cropland summer ET (r = 0.36; p < 0.05) and summer SIF (r = 0.36; p < 0.05). The above results indicate strong potential for the satellite-driven 30 m cropland ET estimates to represent cropland drought impacts. The GOME-2 SIF observations also show regional drought-induced productivity declines coincident with lower reported cropland production and ET.
Figure 4. Spatial distributions of county-level z-scores of annual crop production (a), cropland evapotranspiration (ET; (b)) and GOME-2 solar-induced florescence (SIF; (c)) from June to August in 2017 across the Northern Plains relative to the data period of 2008–2017; (d) 2017 drought impacts over the Northern Plain informed by cropland ET, and crop production for all the counties, and SIF for crop dominated counties (cropland area ≥20% of the total land area).
Download figure:
Standard image High-resolution image
4. Discussion
The 2017 drought (USDM D2-D4) over the Northern Plains affected 46% (7.51 × 10⁷ hectares) of the domain, while counties with extensive ranching and rainfed crops that experienced the most severe summer drought conditions showed 3%–93% and 11%–99% reductions in ET and productivity, respectively. Above-normal precipitation and higher temperature (figure 1(d)) from January to April in 2017 triggered an early spring growing season onset. However, subsequent warmer and drier climate conditions (figures 1(d) and 2) damaged crop growth and reduced crop production and ET due to rapidly drying soils over the region. According to the Unified North American Soil Map (Liu et al 2013, 2014), the Northern Plains is characterized by predominantly loam soils; whereby, crops grown on these soils may be more susceptible to flash drought due to a rapid reduction in water potential at lower soil moisture levels, reducing crop production and ET. The relatively severe regional reductions in ET and productivity in 2017 indicated from our study coincided with large negative impacts to regional croplands and the agricultural industry, including a 13% decrease in crop values in 2017 relative to average annual crop values from 2008 to 2017, while influencing subsequent management actions to maintain production (Wurster 2018, Wurster et al 2019). The drought impact on croplands was likely exacerbated by the extensive rainfed or only partially irrigated agriculture in the region, which is more susceptible to climate extremes.
The different climate factors examined in this study express different impacts on NASS crop production, summer cropland ET and summer SIF regionally. Annual crop production in 2017 was negatively impacted by summer VPD (r = −0.26; p < 0.05) and Ta (r = −0.16; p < 0.05) for the Northern Plains. The estimated summer decline in cropland ET in the region also corresponded with larger VPD (r = −0.58; p < 0.05) and warmer air temperatures (r = −0.32; p < 0.05), respectively. Summer precipitation across the Northern Plains significantly influenced annual county-level crop production (r = 0.18; p < 0.05) and summer cropland ET (r = 0.46; p < 0.05) in 2017. There was no obvious relationship between summer precipitation and productivity indicated from the SIF record. The limited correlations between the climate factors and GOME-2 SIF record may reflect the scale discrepancy between the coarse (0.5°) footprint SIF observations and finer spatial heterogeneity represented by the 4 km Gridmet climate and 30 m ET records.
The 2017 summer flash drought had a major impact on NP croplands but was less severe than the 2012 Great Plains drought (Hoerling et al 2013, Wolf et al 2016), which coincided with the driest year of the recent historical record (2008–2017) for the region; whereas, the 2017 event was the second most severe drought for the period of record (figure 3). Growing season precipitation was extremely low in 2012 (figure 3(c)), with more extreme aridity (growing season AI of 0.16 in 2012 versus 0.24 in 2017), and higher growing season VPD and Ta levels than in 2017 or the long-term record (2008–2017). Cropland ET also showed a much lower cumulative anomaly in 2012 (figure 3(a)), while the NASS reported annual crop production was also the lowest in 2012 relative to the other years of record in the region, followed by 2017 (figure 3(c)). The lower crop production in 2012 may also reflect annual variations in crop types and planted area in addition to drought-induced declines. However, the combined results indicated that Northern Plains croplands experienced a more severe drought in 2012 than 2017, which may obscure the impact of the 2017 event due to the more extreme 2012 outlier.
The 30 m cropland ET estimates used in this study are driven by a satellite-based ET model (MOD16 ET algorithm), which has shown favorable regional accuracy in representing field scale cropland ET heterogeneity (He et al 2019). However, there are still uncertainties in the ET estimates contributed from input meteorological and land cover data, and algorithm assumptions, which may influence this study. For example, there is no direct soil moisture constraint in the ET algorithm even though ET is strongly sensitive to soil moisture variability (De Lannoy et al 2006, Sun et al 2013). This lack of a specific soil moisture constraint may contribute to greater model uncertainty at finer spatiotemporal scales where soil and atmospheric moisture conditions may be less correlated (Novick et al 2016).
The GOME-2 SIF record shows unique sensitivity to agricultural productivity and climate variability (Guanter et al 2014), and demonstrates effective capability for representing drought-related impacts (Yoshida et al 2015) despite the coarse scale of the observations. The GOME-2 satellite record also provides global coverage and consistent monitoring capabilities that are particularly useful for areas with sparse ground observations, including the Northern Plains. In this investigation, the SIF observations showed a similar regional drought-induced productivity decline in 2017 consistent with finer scale observations from a satellite 30 m cropland ET record and county-level crop production surveys across the Northern Plains. These records also showed similar climate sensitivity indicated from comparisons with VPD, cumulative precipitation, and AI (figures 2 and 3(b)), confirming that the GOME-2 SIF record is sensitive to drought related impacts on cropland water use and productivity (Liu et al 2018, Zhang et al 2019). The GOME-2 record has been corrected for sensor degradation (Joiner et al 2016), however, remaining artifacts include decreasing inter-annual trends (Zhang et al 2018), which may contribute uncertainty to the SIF results from this investigation. While the GOME-2 SIF based assessment of the 2017 drought impact on regional productivity was generally consistent with the finer scale cropland ET and NASS annual crop production assessments the SIF record was unable to distinguish cropland heterogeneity or croplands from other land cover types within a 0.5° resolution grid cell.
Our approach emphasizes global satellite observations to facilitate extrapolations and applications to other regions. Satellite SIF observations have been shown to be sensitive to crop productivity (Guanter et al 2014), and used for drought monitoring (Sun et al 2015, Yoshida et al 2015, Zhang et al 2019), though the coarse resolution of GOME-2 SIF records may be a major constraint for effective monitoring over heterogeneous landscapes. Next generation SIF satellites (e.g. TROPOMI; Köhler et al 2018) with much finer resolution (e.g. 7 km by 3.5 km pixel with daily visit) may have much greater potential for monitoring ecosystem productivity response to drought in these heterogeneous regions. The cropland ET and crop production datasets used in this study are largely constrained to the continental US domain due to their reliance on USDA NASS CDL and Gridmet meteorological inputs. However, other synergistic satellite products are available, including the MODIS MOD16A2 ET (Mu et al 2011, 2007) and SMAP L4_C productivity records (Jones et al 2017), providing moderate (500–1000 m and daily to 8 d) resolution global observations with generally favorable accuracy over croplands, and less ancillary data requirements for potential monitoring and drought impacts assessment in data sparse regions.
5. Conclusion
This study investigates the impact of the 2017 Northern Plains summer drought on regional cropland productivity and ET water losses. The significance of the 2017 summer drought impact was assessed relative to a multi-year observational record (2008–2017) including satellite-driven 30 m cropland ET estimates, NASS annual county-level crop production surveys and GOME-2 SIF regional productivity observations. The extent and severity of the drought indicated from the satellite and NASS records were also evaluated against the USDM. The results indicate that the satellite-based 30 m cropland ET estimates are capable of tracking the seasonal dynamics in the water deficit and evaluating field level cropland drought impacts (figure 3(a)), accounting for approximately 80% of the seasonal dynamics in cumulative precipitation (figure 3(b)). The cropland ET and coarser satellite SIF records showed similar seasonal Z-scores over the region (figure 2), while the SIF anomalies also corresponded strongly with cumulative precipitation (r = 0.67; p < 0.05), VPD (r = −0.58; p < 0.05), and AI (r = 0.60; p < 0.05) during the 2017 growing season. The spatial patterns of Z-scores for annual crop production, summer cropland ET and summer SIF indicate large drought impacts (figure 4) in the north central and southern portions of the domain in 2017, consistent with the USDM assessment (figure 1(c)). The most severely drought impacted area (USDM D2-D4) involved counties with extensive cropland cover, while regions with sparse cropland and a greater proportion of natural vegetation showed more limited drought impacts. Overall, the 2017 drought reduced cropland ET by 25%, crop production by 6% and SIF by 11% across the study domain.
Drought is projected to be more frequent and intense in the future (IPCC 2014). Regional VPD is increasing (Ficklin and Novick 2017), while growing season precipitation is declining and the intervals between precipitation events are increasing (Holden et al 2018). This will have direct and immediate impacts on croplands that can result in major economic losses (Narasimhan and Srinivasan 2005, Howitt et al 2014, Martínez-Fernández et al 2016). The spatially and temporally complex and dynamic nature of drought constrains capabilities for effective regional monitoring needed for managing water resources and food security risks. This study documents an effective approach for regional drought monitoring in agricultural regions using multi-scale satellite observations that are able to distinguish both field level ET and regional scale productivity changes.
Acknowledgments
This study was funded by USDA NIFA-AFRI and NASA programs (658 2016–67026–25067, NNX14AI50G, NNX14A169G, 80NSSC18K0738). This work used crop production and annual crop value data acquired and shared by the US Department of Agriculture (USDA) National Agricultural Statistics Service (NASS). A portion of this research was carried out at the Jet Propulsion Laboratory, California Institute of Technology, under contract with NASA.