

Abstract
Precipitation is a critical variable to monitor and predict meteorological drought. The WMO recommended standardized precipitation index (SPI) is calculated from gauge (i.e. GPCC), satellite-gauge (GPCP, CHIRPS), reanalysis (i.e. ERA-Interim, and MERRA-2), and satellite-gauge-reanalysis (i.e. MSWEP) over the global domain. Measured differences among the precipitation datasets include metrics such as percent area under drought, number of drought events, spread and correlation in the number of drought events, and critical success index in capturing moderate and severe-exceptional droughts. As precipitation products are available at different lengths and spatial resolutions, sensitivity of drought metrics to record-length and spatial resolution were explored. The results suggest that precipitation-based drought metrics can vary significantly with the choice of precipitation product, its record-lengths, and spatial resolution. These relationships also vary with the severity of drought events with more severe drought events being more sensitive to the differences in resolution and record length. The quantified variation among the products has to be recognized in the interpretation of drought events when a single or a subset of products used.
Export citation and abstract BibTeX RIS

Original content from this work may be used under the terms of the Creative Commons Attribution 3.0 licence. Any further distribution of this work must maintain attribution to the author(s) and the title of the work, journal citation and DOI.
1. Introduction
Precipitation is one critical process of the water cycle which delivers fresh water to land (Eltahir 1996, Trenberth et al 2003), has key roles in variability of atmospheric circulation, and has critical metrics in weather and climate studies (Sun et al 2018). For many water-related hydroclimate and water resources management studies, accurate estimation of precipitation is crucial. Precipitation measurements at gauges provide quality data at point scale, but complete global coverage has to be achieved at the cost of extensive interpolation, producing unrealistic assumptions in data-sparse regions (Xie and Arkin 1996, Toté et al 2015). The bias inherent in the distribution of land-based precipitation stations has prompted efforts to deploy global satellites for cross-comparing precipitation over data-sparse regions and to fill 'blind spots'. In recent decades, great efforts have been devoted to producing global and regional gridded precipitation datasets. Satellite and reanalysis precipitation products have been developed that may advance gauge observations by providing more spatially homogeneous and temporally complete estimates.
Satellite precipitation algorithms use a combination of infrared (IR) and microwave (MW) sensors: geostationary satellites provide relatively time-continuous measurements, but they do not measure precipitation directly (i.e. indirect relationships between measured IR temperature and reference precipitation are used for precipitation estimation). Microwave measurements enable a more physical retrieval of precipitation, but with lower sampling rate than IR based precipitation estimates from geostationary satellites. Reanalysis-based precipitation products assimilate various observation data into numerical models that may or may not have a proper cloud development parametrization (Bosilovich et al 2011, Dee et al 2011). The observations assimilated into the reanalysis system, model parameterizations and physical assumptions, and the complex interactions between variables all influence the subsequent precipitation forecast generated by the system.
While several studies have been conducted to compare satellite, reanalysis, and ground precipitation products at global or regional scales (e.g. Behrangi et al 2011, Moazami et al 2013 and 2016, Prakash et al 2016, Cui et al 2017), only a few studies have looked at adequacy of precipitation products for global drought analysis. Zhou et al (2014) evaluated the TMPA V7 real-time (RT) and research quality datasets over the period 2000–12 over global land with emphasize on drought application. They found that in more than 75% of global land grids, RT and research-quality products were statistically consistent at 0.05 significance level. The inconsistent grids are spatially clustered in western North America, northern South America, central Africa, and most of Australia. Sheffield et al (2014) developed an experimental drought monitoring and forecast system for sub-Saharan Africa using the variable infiltration capacity model and global satellite-land dataset. Lu et al (2018) evaluated the accuracy of multiple satellite-based precipitation products including TMPA (3B42RT and 3B42 version 7) and the CMORPH (CMORPH RAW and CMORPH BLD version 1.0) datasets and investigated the accuracy of the standardized precipitation index (SPI) estimates derived from satellite and rain gauge data over China. Their results provided insights on the SPI differences between the products adjusted with rain gauge measurements (i.e. TMPA 3B42 and CMORPH BLD) and products without gauge adjustment (i.e. TMPA 3B42RT and CMORPH RAW). Bayissa et al (2017) assessed the spatial and temporal patterns of meteorological drought using five high-resolution products for the Upper Blue Nile Basin. Results showed that there was a good agreement between CHIRPS and TARCAT rainfall products with ground observations in majority of the weather stations for all time steps.
Drought is one of the most costliest and widespread hydrometeorological extreme that reoccurs in different parts of the world every year (Mishra and Singh 2010). It affects many sectors including agriculture, food security and the environment and causes large economic losses and threatens livestock and even human life (e.g. Vicente-Serrano et al 2013, Turco et al 2017). Drought identification is further complicated by the need to have a consistent long-term climate data record. Given that many satellite precipitation products only extend back to 1979, most of the global drought analysis efforts have focused on land-based records such as The Global Precipitation Climatology Centre (GPCC) (Schneider et al 2015) or global land gridded dataset of climate extremes (Donat et al 2013). However, as we start to get about four decades of satellite precipitation data- record, an unprecedented opportunity has become available to study climate extremes and changes.
The aim of this study is to compare the performance of a few popular, longer-term satellite, reanalysis, and gauge-based precipitation products for identification of meteorological drought features, such as the number and frequency of drought events, spatial pattern, and severity. The study also performs sensitivity analyses of the record length and spatial resolution on the identified drought features. Standardized precipitation index (SPI) (McKee et al 1993) was calculated from three satellite-land precipitation dataset (i.e. GPCP, CHIRPS, and MSWEP), two reanalysis products (ERA-Interim and MERRA2) and a gauge-based product (i.e. GPCC), for purposes of cross-comparison.
2. Data and methods
2.1. Data
In this study, six precipitation data products were used:
- a.The Climate Hazards Group InfraRed Precipitation with Station data (CHIRPS), which is quasi-global (spanning 50 °S–50°N) rainfall dataset at 0.05° × 0.05° resolution and goes back to 1981. CHIRPS precipitation is a combined product of monthly precipitation climatology (CHPClim), Thermal Infrared (TIR) satellite observations, and in situ precipitation observations from various national and regional meteorological organizations (Funk et al 2015). We obtained CHIRPS product at 1°x1° from Roca et al (2019).
- b.The Global Precipitation Climatology Project (GPCP) Version 2.3, which is a monthly precipitation dataset from 1979-present and combines observations and satellite precipitation data into 2.5° × 2.5° global grids. GPCP provides precipitation from integration of various satellite data sets over land and ocean and a gauge analysis over land (Huffman et al 2009, Adler et al 2018).
- c.The GPCC Full Data Monthly Product Version 2018 (Schneider et al 2015), which is constructed from global station data and is available from 1901-present and is available at 0.25° × 0.25° and coarser resolutions.
- d.Multi-source weighted-ensemble precipitation (MSWEP) V2 (Beck et al 2019), which is based on weighted averaging of several satellite, gauge, and reanalysis products and includes a number of corrections to improve data quality. The products are available at 0.1° × 0.1° resolution and go back to 1979.
- e.
- f.ERA-Interim (Dee et al 2011), which is a reanalysis product produced by the European Centre for Medium-Range Weather Forecasts (ECMWF). The forecast model incorporated in the ERA-Interim reanalysis is based on the ECMWF IFS (Cy31r2) forecast model and it is available at 0.75° × 0.75° resolution.
The present comparative analysis was performed at 1° × 1° monthly resolution. All the products were mapped onto this resolution prior to calculation of drought indices, although higher resolution data (i.e. MSWEP) were also used to study the sensitivity of drought analysis to spatial resolution. GPCP is the only product that has coarser resolution than 1° × 1° that needs to be recognized in the interpretation of the results. The study period was set to 1983–2016, but we used GPCC (that has the longest temporal coverage among the studies products) to investigate the sensitivity of the drought analysis to the record-length.
2.2. Methodology
In this study, the SPI was calculated using a non-parametric standardization approach (Hao et al 2014, Farahmand and AghaKouchak 2015). First, the empirical probabilities of the satellite/reanalysis-based precipitation data are computed for each grid. By applying an empirical approach, we avoid any assumption on the underlying distribution function of precipitation data across space. More details can be found in Farahmand and AghaKouchak (2015). For consistency among different variables, the standardization is applied to 3 month accumulated precipitation (SPI3) as it enables capturing seasonal variation. SPI3 used throughout this study and hereafter for abbreviation we refer to it as SPI. To determine a drought event, a drought threshold is needed. Using the SPI time series for each grid, drought events can be identified for SPIs below a certain threshold. We used −0.6 as a threshold to capture drought events (Behrangi et al 2016) and −1.6 to detect extreme and exceptional droughts based on the United Sates Drought Monitor (USDM) drought classification table (https://droughtmonitor.unl.edu/AboutUSDM/AbouttheData/DroughtClassification.aspx). Drought threshold −0.6 is corresponding to the D0-Drought category (abnormally dry with SPI ranging between −0.5 and −0.7) in the US Drought Monitor (USDM; http://droughtmonitor.unl.edu/) (Svoboda et al 2002). In fact using threshold −0.6, we include all abnormally dry cases in our analyses. In order to study more severe droughts, lower SPI thresholds are also investigated in the present study.
In addition to the time series of SPI values, we also calculate the number of drought events. A drought event starts when SPI goes below the threshold and ends when SPI exceeds the threshold.
For drought detection comparison among the studies products, we applied the 2 × 2 contingency table to compute the number of hit (h), miss (m), false (f)( also known as false alarm), and the Critical Success Index (CSI) (Wilks 2006). CSI combines different aspects of other indices, i.e. the probability of detection (POD) and false alarm rate (FAR) to evaluate the overall skill of other satellite products in drought detection relative to reference data over each grid. We also compute the miss rate (MR) and FAR using the following equations:


The CSI and POD range from 0 to 1:0 indicates no skill and 1 indicates perfect skill Similarly, MR and FAR range from 0 to 1, 0 indicates perfect skill and 1 indicates no skill. In this study, we used GPCC as comparison reference observation and calculated performance indices for different drought thresholds (−0.6, −1.0, −1.5 and −2.0) for all grids of all products. Note that selection of GPCC as reference enables comparison of CSI among different products, but it does not necessarily mean that GPCC is the most accurate product. The CSI values are averaged over the Northern Hemisphere from 0° to 50°  N (NH), the Southern Hemisphere between 0° and 50°
  S (SH) and global scale (GL) from 50°
  N to 50°
  S and used in the analysis.
In order to assess trend and temporal changes in droughts for each grid, the Spearman's rho trend test at 0.05 significance level was applied. Spearman's rho is a rank-based non-parametric statistical test. Given the sample data set, the null (H0) and alternative (H1) hypothesis are as follow:
- H0 = Null hypothesis of trend absence in time series.
- H1 = Alternative hypothesis of the trend.
The result of this test is returned in Td = 1 indicates a positive trend, Td = −1 indicates negative trends, i.e. a rejection of the null hypothesis at the alpha significance level while Td = 0 indicates a failure to reject the null hypothesis
3. Results
Figure 1 shows time series of percent grids under severe and exceptional droughts (SPI3 ≤ −1.6) for January 1983–December 2016 over 0° to 50°N (NH), 0° to 50°S (SH) and 50° S to 50° N (GL) (i.e. excluding the polar areas). Monthly percent grids under drought can vary from about zero to 25% of the entire NH or SH grids (figure 1). However, this range strongly depends on the choice of precipitation product. CHIRPS tend to show the largest range and GPCC shows the smallest range among the products. As can be seen in figure S1 is available online at stacks.iop.org/ERL/14/075005/mmedia, the relative spread (range of percent grids under severe and exceptional drought divided by mean) among the precipitation products is quite large (e.g. can exceed 100%), which is often larger among gauge-satellite products than reanalysis. The spread among gauge-satellite products are also larger in SH than NH by about 95.1% and 64.7% for satellite-gauge and 51.7% and 42.9% for reanalysis, respectively. While the observed larger spread in SH might be climate related, it may also be affected by inhomogeneity in distribution and density of ground station and radiosonde data (used for bias adjustment or assimilation in reanalysis) in both hemispheres. For example, using GPCC full data V8 for 1983–2016, we found that there are 2.75 times more gauges over the Northern Hemisphere (latitude 0–50 °N) than found over the Southern Hemisphere (latitude 50 °S-0). By considering the Earth's curvature, this suggests that area-per-gauge ratio in the southern region is about 2.2 larger than northern region.

Figure 1. Percent grids under sever and exceptional drought (SPI3 ≤−1.6) over land in (a) NH, (b) SH, and (c) GL from 1983 to 2016.
Download figure:
Standard image High-resolution imageWhile the percent grids under drought can highlight differences among precipitation products in capturing total areas under drought, whether the products can identify the location of drought events or not needs to be investigated. The performance of the products in capturing spatial distribution of droughts can be compared using CSI calculated from the contingency table. Figure 2 displays CSI versus SPI threshold for the studied products. Note that in this comparison, GPCC is considered 'ground truth' to determine whether a drought occurred. Figures 2(a)–(c) compare the different products with GPCC's detection of drought events. It can be seen CHIRPS and GPCP are in better agreement with GPCC for all SPI thresholds, although MSWEP agrees better than GPCP in NH for extreme drought events (e.g. SPI threshold less than −1.5). Reanalysis products, i.e. ERA-Interim and MERRA2, show the worst agreement among the studied products. It is important to note that as drought detection thresholds change from less severe to more severe droughts, i.e. from −0.6 to −2.0, the agreement of products with GPCC decreases significantly (e.g. CSI is reduced by about 50%). Figures S2–S5 show maps of CSI, MR, FAR and POD, respectively. The maps are calculated for all products against GPCC as reference. It can be seen that for all products, MR is higher in Northern Africa and western part of South America. ERA-Interim shows larger MR values over most of the Central Africa compared to the other products (figure S3). Similarly, all products reveal high FAR over northern and central parts of Africa, with ERA-Interim covering the largest area of high FAR over these regions (figure S4). Reanalyses also show larger FAR values than other products over the western part of South America. All products also exhibit the lowest values (worst performance) of POD (figure S5) in north and Central Africa, Middle East, West China and northern and western parts of South America, but ERA-Interim shows the lowest values among other products. On the other hand, regions with high POD and low FAR and MR seem to correspond often to regions with higher density of gauge stations (e.g. the continental US, Europe, and Australia except the central part). This is partly because the contribution of satellite retrievals are generally higher over regions with sparse stations than regions with dense stations, justifying generally higher detection skills of satellite-gauge products compared to GPCC over regions with dense gauge network (figure S2). While reanalysis are not using precipitation data from gauges, some of the assimilated information come from in situ observations (i.e. sondes) that are often sparse over North Africa and remote regions (Durre et al 2006).
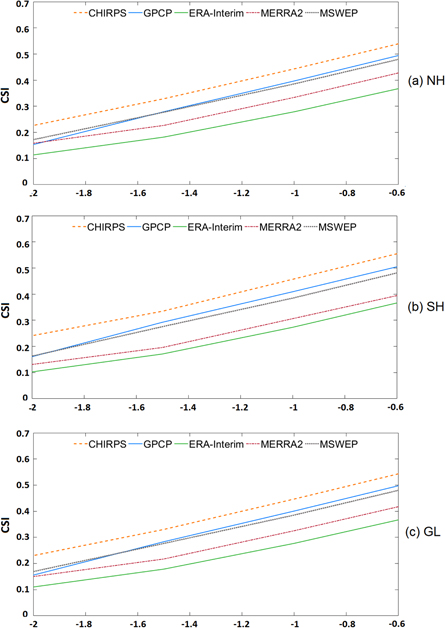
Figure 2. The performance of precipitation products in detecting drought events defined based on different SPI threshold over (a) NH (b) SH and (c) GL. GPCC is used as a reference.
Download figure:
Standard image High-resolution imageA drought 'event' is considered to start when SPI goes below the specified threshold and ends when SPI exceeds the threshold. Therefore, a longer duration of drought reduces the number of drought events within the study period. Based on this definition, figure 3 shows the map of the number of drought events for different precipitation products for 1983–2016. While the general patterns are similar, the maps highlight regional differences among the products that can be large. ERA-Interim (figure 3(e)) and GPCC (figure 3(a)) capture smaller number of drought events over North Africa or desert areas compared to the other products, likely related to the fact that zero precipitation is a normal condition in these regions and drought durations are large.
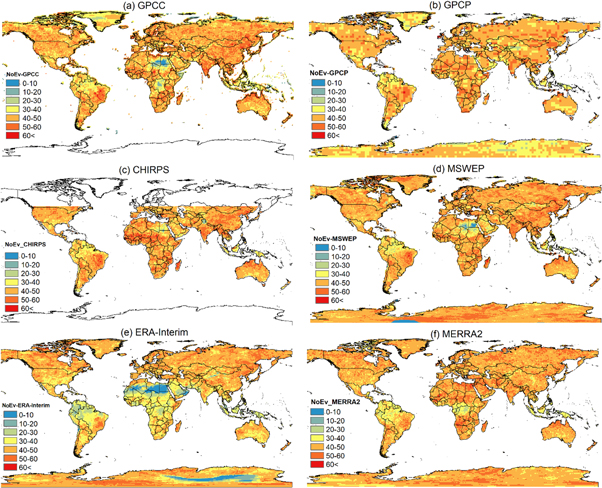
Figure 3. Number of drought events calculated from (a) GPCC, (b) GPCP, (c) CHIRPS, (d) MSWEP, (e) ERA-Interim, and (f) MERRA2.
Download figure:
Standard image High-resolution imageAverage and standard deviation for several severe and exceptional drought events (i.e. with SPI3<−1.6) are also compared over different continents using different precipitation products between 1983 and 2016 (figure S6). CHIRPS and GPCC detect the highest number of severe and exceptional drought events and ERA-Interim the lowest (figure S6(a)). However, ERA-Interim shows larger variability, i.e. standard deviation in the number of drought events (figure S6(b)), than other products over Asia and South America. No clear relationship between the two groups of reanalysis and gauge-satellite products is observed in figure S6.
In figure 4, the performance of products in capturing the number of drought events is compared against GPCC when graphed on Taylor diagram, showing correlation coefficient, standard deviation and centered root-mean-square difference (Taylor 2001). It can be seen that MSWEP followed by GPCP and CHIRPS are closest to GPCC in capturing the number of drought events, but reanalysis products (i.e. MERRA2 and ERA-Interim) are the outermost to GPCC. One possible contributing factor is the use of gauge measurements in the production of CHIRPS, GPCP, MSWEP, and GPCC, resulting in circular reasoning, unlike the case with the use of the reanalysis products.
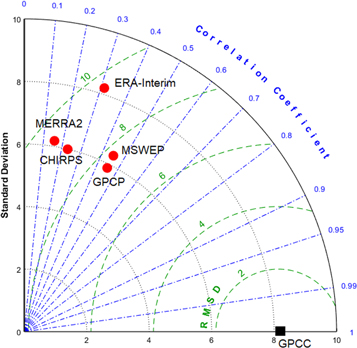
Figure 4. Taylor diagram illustrating the similarity of different precipitation products with GPCC in monitoring number of drought events (1983–2016).
Download figure:
Standard image High-resolution imageUp to this point, the analysis has been carried out using 1983–2016 data record. The outcomes of SPI analysis may change as the length of the data record increases. In fact, precipitation products have a different length of record. Several products such as TRMM 3B42, PERSIANN-CCS, and GSMaP are available for TRMM-era (e.g. since 1998 or 2000). Other products such as GPCP, MSWEP, CHIRPS, and PERSIANN-CDR go back to 1979 or early 1980s and take advantage of the entire satellite data record. On the other hand, gauge-only products go back to 1948 and 1950, such as the Climate Prediction Center Unified Gauge-Based Analysis of Precipitation (Chen et al 2008) and REGEN_AllStns_v1 (Contractor et al 2019), respectively. Few other gauge products such as GPCC and the CRU of the University of East Anglia (New et al 2001, Harris et al 2014) extend the gauge-analysis to even earlier years (i.e. 1901).
The question is how sensitive the drought index (i.e. SPI) is to the length of data-record. GPCC's long record of precipitation provides a valuable source for investigating this question over land. Figure 5 shows the effect of data-record length on percent grids under severe and exceptional drought condition (SPI3<−1.6) over NH (figure 5(a)), SH (figure 5(c)), and GL (figure 5(e)) for the period 2000–2016 using different climatology lengths (case 1: 1901–2016, case 2: 1950–2016, case 3: the satellite era, i.e. 1979–2016, and case 4: 2000–2016). It should be noted that for case 1, the entire record of 1901–2016 was used to construct SPI3, while for example for case 2 only a portion of the GPCC record was used, that extending between 1950 and 2016 and so on. The panels on the right-side show the relative-spread of differences due to different climatology used in the calculation of the SPI. This relative-spread can be quite large (i.e. up to about 100%). Figure 5 shows that percent grids under severe and exceptional drought is more erratic over SH and less erratic in NH when 1901–2016 or 1950–2016 climatology is used (figures 5(a) and (b)). This might be related to the precipitation increase in arctic region due to the warming climate (Bintanja and Andry 2017, Bintanja 2018) that is most obvious when the longer climatology is used, but contrasting cases are also seen (e.g. over Siberia and Eurasia).
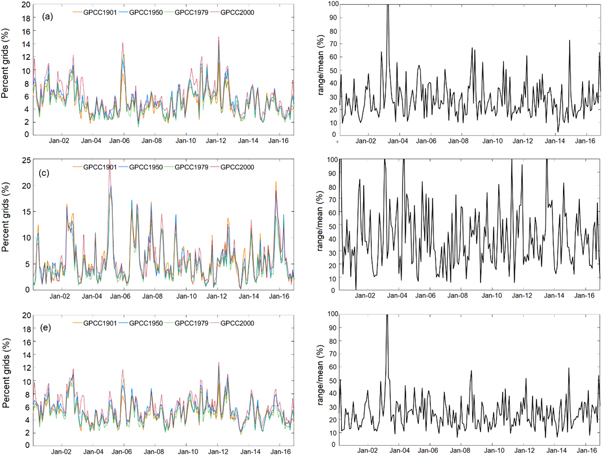
Figure 5. Investigating the effect of data-record length on SPI using GPCC. Left-side panels show time series of percent grids under severe and exceptional drought condition (SPI3<−1.6) for the period 2000–2016 calculated using four different climatology (1901–2016, 1950–2016, 1979–2016, and 2000–2016) over (a) NH, (c) SH and (e) GL. The panels on the right-side show the relative spread (range divided by mean) of differences due to different data-record length used in calculation of the SPI.
Download figure:
Standard image High-resolution imageFigure S7 shows the Spearman's rho trend test at 0.05 significance level based on SPI3 calculated from GPCC for 1901–2016 (case 1) (figure S7(a)), 1950–2016(case 2) (figure S7(b)), and 1979–2016 (case 3) (figure S7(c)). It can be seen that large areas in NH show increase in SPI when 1901–2016 climatology is used, but northern and central parts of Africa, Middle East countries, western and central South America, western regions in the United States and China, and Southern Europe experience negative trends in SPI, i.e. having more drought events (figure S7(a)). By using 1950–2016 period, large areas of positive trend in SPI is still observed in NH, but regional changes in trend direction are observed (figure S7(b)). For example, larger areas of arctic show positive trend in SPI, but drought regions shrink compared to those identified in figure S7(a). Trend analysis using the 1979–2016 period shows expansion of areas with negative SPI trend in the US and Canada and also in South America, while in large regions of Africa and Middle East the trend direction is changed to neutral and positive trends, i.e. increase in precipitation (figure S7(c)).
Figure S8 shows the number of drought events between 1979 and 2016 based on SPI3 depending on whether SPI is estimated using case 1 GPCC for 1901–2016 (figure S8(a)), case 2 (1950–2016) (figure S8(b)), or case 3 (1979–2016) (figure S8(c)). Comparing Cases 2 and 3 with Case 1, the high latitude areas in North America, North Asia, and Northern Europe have larger number of drought events, when a shorter, more recent time period is used to construct SPI, as opposed to smaller number of drought events, when 1901–2016 is used (case 1). It can be seen that when the period 1901–2016 is considered for drought assessment, the high latitude areas in North America, North Asia and North Europe have smaller number of drought events compared to other periods. In contrast, Middle East, Central and North Africa and eastern South America show smaller number of drought events when the shorter, more recent time periods are used to construct SPI (cases 2 and 3).
Precipitation datasets are available at a range of spatial resolutions. MSWEP has 0.1° × 0.1°, reanalyses are available at about half-degree, and monthly GPCP is offered at 2.5° × 2.5° resolution. Thus, one can investigate the relationship between number of drought events and differing spatial resolutions. For this purpose MSWEP original resolution was coarsened to 0.5° × 0.5° and 1° × 1° resolution and interpolated back to 0.1° × 0.1° by assuming uniformity. Linear interpolation was used for changing data resolution, i.e. the interpolated value at a query point is based on linear interpolation of the values at neighboring grid points in each respective dimension. By using the original 0.1° × 0.1° resolution map as reference, figure 6 shows CSI calculated from coarser resolution products versus a range of drought thresholds over NH (figure 6(a)), SH(figure 6(b)), and GL(figure 6(c)). As drought severity increases (i.e. lower SPI3), the coarser resolution products have lower skill (i.e. lower CSI) in detecting grids identified as drought by the original 0.1° × 0.1° map. For example, for 1° × 1° resolution maps, CSI is about 0.74 at SPI of −0.6 (figure 6(a)). This is likely because for a courser resolution product one can expect larger false alarms and missed events than a finer resolution product with similar quality. At threshold of −2, CSI is reduced to about 0.26 (more than 60% reduction in CSI). This reduction is less severe for the 0.5° × 0.5° (i.e. about 40%). The observed relationship is similar for SH and GL regions.

Figure 6. Drought detection performance as a function of product spatial resolution and SPI threshold for (a) NH, (b) SH, and (c) GL.
Download figure:
Standard image High-resolution image
4. Conclusion
Several precipitation products exist, each offering different features such as retrieval technique, merging method, spatiotemporal resolution, and record length. Therefore, it is important to investigate to what extent drought analysis and interpretation might be affected by the choice of precipitation product. The present study aims to assess and compare the performance of few popular and long-term satellite, reanalysis, and gauge-based precipitation products with respect to drought-related features such as the number and frequency of occurrence, spatial pattern, and severity that are calculated based on SPI.
Investigating the time series of SPI3 for GPCP, GPCC, CHIRPS, MSWEP, ERA-Interim, and MERRA2 showed that the choice of precipitation product can lead to significant differences in determining percent grids under severe and exceptional droughts (SPI3 ≤ −1.6). Satellite-gauge products often show larger spread (range of percent grids under severe and exceptional drought divided by mean) than reanalysis, especially in the SH where satellite-gauge products suggest about 50% larger spread than that obtained from ERA-Interim and MERRA2. The larger spread in SH can be related to more diverse climate regimes and also lower station density of ground station and radiosonde data in SH compared to NH.
Analysis of drought detection as a function of drought severity reveals large differences among the studied products. CSI index was used to compare the consistency of the products in capturing spatial distribution of droughts using GPCC as reference. GPCP and CHIRPS are in better agreement with GPCC for SPI thresholds greater than −1, but for more intense droughts (SPI threshold < −1.5), CHIRPS and MSWEP show higher CSI. The analysis suggests that there is a lesser agreement among the products in capturing the more severe and exceptional case of droughts. Analysis of spatial maps of drought detection suggests that most of the products, especially ERA-Interim, differ from GPCC over Central Africa and western part of South America where missed and false alarms are relatively the largest. Spatial distribution of number of drought events was also investigated using Taylor plot. The outcome suggests that MSWEP followed by GPCP and CHIRPS have closest pattern to GPCC in terms of capturing number of drought events, while reanalysis products (i.e. MERRA2 and ERA-Interim) are least consistent with GPCC. The similarity of satellite-gauge products to GPCC is somewhat expected as gauge data play a major role in all of these products, even those that are satellite-based. This points to the importance of maintaining the quality, consistency, and number of precipitation gauges.
The sensitivity of drought analysis to the record-length and spatial resolution were also studied. We used the long record of GPCC (1901–2016) to assess the effect of data-record length on percent grids under severe and exceptional drought condition (SPI3<−1.6). It was deduced that using different climatologies (data length) can significantly affect the drought characteristics, e.g. percent grids under severe and exceptional drought condition, largely due to the dependence of precipitation trends to the length of data record. That is percent grids under severe and exceptional drought is significantly reduced in NH high latitudes when longer climatology is used, while shorter record-length (e.g. 1979–2016) can result in significant underestimation of drought extent in mid- and low-latitudes. The results showed that the relative-spread of differences (due to different climatology used in calculation of the SPI) can be quite large (i.e. up to about 100%), impacting our interpretation of severity and areal extent of drought.
Recognizing that precipitation products are available at a range of spatial resolutions, we also studied the sensitivity of drought indices to the spatial resolution of products. CSI was used to compare SPI of coarser resolution (0.5° and 1°) MSWEP with its original resolution (0.1°) at a range of SPI thresholds. We found that for dry anomaly condition (i.e. SPI threshold of −0.6) the difference in spatial resolution may not be significant, but for sever and exceptional drought (i.e. SPI threshold of −2) CSI can be reduced significantly (i.e. more than 60% in NH), indicating that higher spatial resolution products are critically important to study severe drought events.
The present study suggests that drought analyses based on SPI largely depends on the choice of precipitation product and its specifications. This dependency has to be recognized in the interpretation of drought events when a single or a subset of products is used.