

Abstract
Forests play a central role in addressing climate change, and accurate estimates of forest carbon are critical for the development of actions that reduce emissions from forests and that maximize sequestration by forests. Methodological challenges persist regarding how best to estimate forest carbon stocks and flux at regulatory-relevant scales. Using California, USA as a case study, we compare two approaches to stock-difference forest carbon estimation for aboveground live trees: one based on ground inventories and one on land cover classification of remotely-sensed data. Previous work using ground inventory data from the Forest Inventory and Analysis Program (FIA) showed net aboveground carbon (AGC) sequestration by live trees in California forests, while estimates using land cover classification from the Landscape Fire and Resource Management Planning Tools (Landfire) showed net reductions in live tree AGC over a similar time period. We examined the discrepancy by re-analyzing the FIA inventory data through the lens of a category-change analysis based on Landfire. This analysis showed more than 50% of the live tree AGC in fewer than 4% of Landfire-equivalent categories and that the overwhelming majority (>80%) of forest area did not change height category between measurement periods. Despite the lack of categorical change, the majority of FIA plots increased in both 95th percentile tree height and in live tree AGC. These findings suggest that an approach based on observing categorical changes risks undercounting AGC sequestration resulting from growth and thus overstating the relative importance of AGC reductions that result from disturbances. This would bias AGC flux estimates downward, leading us to validate the conclusion that live trees in California were a net sink of aboveground carbon in the decade ending in 2016. Our findings suggest an inventory-based or hybrid approach is preferable to methods that depend on categorical bins for estimating AGC in disturbance-prone forest ecosystems.
Export citation and abstract BibTeX RIS

Original content from this work may be used under the terms of the Creative Commons Attribution 3.0 licence. Any further distribution of this work must maintain attribution to the author(s) and the title of the work, journal citation and DOI.
1. Introduction
Forests contain one of the largest stocks of stored carbon on the planet. Tropical forests alone are estimated to store 247 GtC, equivalent to 28.4 years of global carbon emissions from fossil fuel burning and industrial processes at 2010 levels (Saatchi et al 2011, IPCC 2014a). Deforestation and forest degradation were responsible for 12.5% of global greenhouse gas emissions from 1990 to 2010 (van der Werf et al 2009, Houghton et al 2012). Despite large emissions, forests globally sequestered more carbon than they emitted between 1990 and 2007 (Pan et al 2011). In the United States (US), forests and forest products were net sinks of carbon between 1990–2012, with net sequestration in 2012 of 236.5 TgC contributing 88% of the total sequestration from US land use in 2012 (Williams et al 2016, US EPA 2018).
Forest carbon stocks thus present both tremendous climate risks and benefits depending on changes in forest extent and use. As such, forests have figured prominently in discussions surrounding climate change mitigation, particularly in the context of tropical forests and REDD + (Gibbs et al 2007, Petrokofsky et al 2012). In the 2015 Paris Climate Agreement, land use and forests play a significant role in many Nationally Determined Contributions (NDCs). Avoiding land use change or improving existing land use were the source of one quarter of the proposed emissions reductions under the announced NDCs (Grassi et al 2017). Griscom et al (2017) estimate that actions to conserve, restore, and improve land management could contribute one third of the most cost-effective solutions to keep global average temperature increase under 2 °C, and that forest-based activities are the largest potential contributors.
In a context where high-profile policy priorities are designed around specific targets, it is important to get the measurement right (Grassi et al 2017). Carbon accounting has implications for prioritization among economic sectors as well as spatial prioritization among locations for project activities and investment (Law et al 2015). The Intergovernmental Panel on Climate Change recognizes two categories of methodologies for estimating carbon dynamics: gain-loss and stock-difference (IPCC 2006). Gain-loss focuses on the dynamics of change in forest carbon stocks-estimating amounts of increase and decrease in specific carbon pools, whether through sequestration, emission, or movement of carbon from one pool into another. Gain-loss estimation thus provides valuable insights into processes of growth and disturbance by documenting flows of carbon among pools (Stinson et al 2011, Kim et al 2017). Stock-difference, on the other hand, estimates carbon stocks at two or more time-points, and evaluates the change between the time points. Stock-difference approaches rely on forest inventory data that are frequently resource-intensive to acquire; however, in cases where inventories exist, a stock-difference approach can be efficient (IPCC 2006).
Organic carbon in forests is present in multiple pools: aboveground live trees and understory vegetation, root systems alive and dead, dead standing trees, woody debris, and the soil. However, aboveground carbon (AGC) is frequently the focus of state-level or project-level monitoring efforts because of more limited data availability on the other pools (Gonzalez et al 2015, Tyukavina et al 2015; Neeti and Kennedy 2016). In the case of California, the focus of the current study, the AGC stored in live trees (2006–2015) was estimated to be 52.1% of the total carbon in forest lands while soil carbon was the second-largest pool with 24.8% (Christensen et al 2017). The share of live tree AGC in overall carbon flux was higher still: over a 10 year period from 2001–2005 to 2011–2015, the increase in AGC in live trees was 69.5% of the net increase across all carbon pools (Christensen et al 2017). This compares to the results for the United States as a whole where AGC accounted for 55.0% of the forest ecosystem flux and 46.9% of the total forest and forest products flux (US EPA 2018).
In California, two different stock-difference forest carbon estimation efforts have become prominent in policy discussions around forest carbon. One is based on remotely-sensed (RS) data from Landfire (Ryan and Opperman 2013, Gonzalez et al 2015) while the other is based on national-scale forest inventory data collected from plots on a five-kilometer grid by the Forest Inventory and Analysis (FIA) program (Christensen et al 2017). In general terms, on-the-ground inventories provide the most accurate picture of carbon stocks for a given location but since many plots must be used to provide statistically valid estimates, the method does not provide a statistically-valid detailed map product. A land classification based on RS data allows greater scalability while producing spatially-explicit data. Analysis based on land classification is generally more cost-efficient at large scales, especially if good estimates of carbon density for forest types have already been established (Petrokofsky et al 2012).
Despite the apparent cost and scale advantages of a RS-based land classification over a ground-level inventory system, there are trade-offs with accuracy. This trade-off becomes more pronounced in cases where the goal is to estimate change over time in carbon stocks rather than to estimate stocks at a specific time. Repeated measurements of fixed-area permanent plots provide the most accurate estimate of changes in carbon stock (Brown 2002). However, given the increasing availability and low costs of RS data, many analyses of changes in biomass carbon have been made based solely on changes over time in RS-based land categories without ground-truthing the estimates of carbon density (e.g. Lai et al 2016, Zomer et al 2016). Some of this is due to the fact that large-scale forest inventory data exists in few places and are expensive to maintain.
To our knowledge, there have not been direct comparisons at large scale of results from these two contrasting approaches to a stock-difference methodology. To fill this gap, using the forests of California as a case study, we compare and contrast ground-based stock difference and RS land cover classification-based stock difference methods, identify the most likely reasons for discrepancies seen between the two approaches, evaluate potential bias, and discuss policy implications.
We are motivated by the fact that recent estimates of change in carbon stocks in California forests reveal significant discrepancies among estimates (table 1). Differences are evident in two prominent estimates used by California state regulatory: one suggests that California's forests are a net sink of carbon while another estimates they are a net source. Gonzalez et al (2015) estimated that between 2001 and 2010, California lost 4.8 Tg of live tree AGC per year, representing an annual rate of change of −0.58%. In contrast, Christensen et al (2017), using forest inventory data, estimated an increase in live tree carbon of 6.5 Tg annually from 2001–2005 to 2011–2015–an annualized change of +0.61% relative to 2006–2015. While there are differences in the time range covered between these two estimates, there are several reasons, discussed below, to conclude that the discrepancy results from differences in estimation methodologies. Gonzalez et al (2015) is based on data from the Landscape Fire and Resource Management Planning Tools (Landfire) (Ryan and Opperman 2013; supplementary data, available online at stacks.iop.org/ERL/14/074008/mmedia), a land cover classification product based largely on RS data, whereas Christensen et al (2017) is based on the Forest Inventory and Analysis (FIA) National Program (Bechtold and Patterson 2005; supplementary data).
Table 1. Comparison of estimates for California-wide aboveground carbon (AGC) and for rates of change in AGC.
| Source of estimate | Base data | Land covers included | Year (s) | Statewide estimate for live tree AGC | Time period for carbon flux estimates | Annual net change in live tree AGC | Annual % change |
|---|---|---|---|---|---|---|---|
| Wildland ecosystems (all land excluding crops and settlements) | 2001 | 920 ± 240 Tg | 2001–2010 | –6.9 ± 1.5 Tg | –0.83 ± 0.18% | ||
| 2010 | 850 ± 230 Tg | ||||||
| Gonzalez et al (2015) | Landfire | Trees and shrubland | 2001 | 915 ± 250 Tg | 2001–2010 | –7.1 ± 1.9 Tg | –0.86 ± 0.23% |
| 2010 | 840 ± 210 Tg | ||||||
| Trees only | 2001 | 830 ± 190 Tg | 2001–2010 | −4.8 ± 1.4 Tg | –0.58 ± 0.17% | ||
| 2010 | 780 ± 180 Tg | ||||||
| Christensen et al (2017) | FIA | Trees only (including foliage) | 2006–2015 | 1062 Tg | 2001–2005 to 2011–2015 | +6.5 Tga | +0.61%a |
| Trees only (excluding foliage) | 2001 | 917 Tg | 2001–2011 | +6.3 Tg | +0.67% | ||
| These results | FIA | 2011 | 980 Tg | ||||
| Trees only (excluding foliage) | 2001–2006 | 963 Tg | 2001–2006 to 2011–2016 | +4.5 Tg | +0.46% | ||
| 2011–2016 | 1008 Tg |
aThe net change value is converted from an annual average for net flux of CO2 from standing live trees carbon presented by Christensen et al. 2017 for the 2001–2005 to 2011–2015 period (p. 41). Percentage change is relative to the 2006–2015 average stock because values for 2001–2005 were not given. Christensen et al. calculate AGC for each of the five ten-year periods in the year range above and report the average annual change between each of those years. We compare the two six-year periods and divide the AGC difference by the ten years between the two periods. This difference in calculation approach has the effect of making our estimate of sequestration more conservative than the estimate by Christensen.
Climate mitigation targets in California are associated with policies stipulating that the state's forests be managed to maintain net sequestration. California Assembly Bill Number 1504 (AB-1504; 2010) and the initial Climate Change Scoping Plan (California Air Resources Board 2008) estimated that, as of 2006, California's forests sequestered roughly five million metric tons of CO2 (1.36 TgC) annually. AB-1504 stipulates that sustainable management practices should be used to maintain this rate of sequestration through 2020. In recent years, California's forests have been subject to several interlinked stressors: extreme drought (Williams et al 2016), bark beetle outbreaks (Kurz et al 2008, Hart et al 2015), and extreme fire seasons (Dennison et al 2014, Abatzoglou and Williams 2016).
The goal of this paper is to understand the major source of the differences between the Gonzalez et al (2015) study that estimated a net loss in aboveground live tree carbon in California's forests and Christensen et al (2017) that estimated net sequestration in the same carbon pool over a similar time period. While the plot-based approach of Christensen et al (2017) is explicitly designed for monitoring changes in biomass and carbon stocks over time (Thompson et al 2015), the Landfire product used by Gonzalez et al (2015) is not. The Landfire product was created to provide wall-to-wall information on vegetation and fuels in close-to real time in order to support policy makers in the management of fire risk (Ryan and Opperman 2013); it was not designed as an inventory tool or a tool for inter-temporal comparison. Policy makers in California have asked for an inventory tool that provides wall-to-wall coverage, a request which is central to the motivation for Gonzalez et al (2015) to adapt Landfire for the purposes of a carbon inventory. However, Landfire risks introducing significant bias into carbon estimates, particularly by undercounting growth in large trees; this risk is recognized but minimized by the studies that have used to it estimate carbon change over time (Battles et al 2013, Gonzalez et al 2015). Our goal with this manuscript is to provide a more robust assessment of the potential for bias in a Landfire-based approach and to determine whether turning to the Landfire product because of its other benefits—wall to wall coverage, ease of use, relative frequency of updating—is a reasonable approach or whether it risks introducing too much bias to the estimates. Our approach to evaluating this question is to take the FIA data set used by the Christensen et al (2017) inventory and to re-analyze it using the category-based approach applied to the Landfire data (Gonzalez et al 2015). This assessment of methods is relevant both to policy discussion in California and more broadly to the discussion of how measurement approaches to carbon accounting can have policy implications for the management of forests.
2. Methods
We used FIA data (Bechtold and Patterson 2005) to produce estimates of statewide change in aboveground carbon (AGC) in live trees in California from 2001–2006 to 2011–2016. We also re-classified FIA plots to approximate Landfire classifications (Ryan and Opperman 2013) in order to examine how looking at the FIA results through the lens of a Landfire classification influences the final estimate of net carbon change in the AGC pool. Landfire is not designed to monitor inter-temporal changes in carbon, and there are reasons to expect a priori that it may introduce bias into carbon accounting by undercounting growth (Battles et al 2013, Gonzalez et al 2015). We test one likely source of that bias—its use of coarse height bins—in order to assess the degree of that bias and whether or not it can explain differences in estimates obtained by the two methodologies.
2.1. FIA and Landfire data
In California, the first complete ten-year cycle for the FIA program was 2001–2010 (Christensen et al 2017). The most recent data available for the analysis was for the 2016 sampling year. Estimates of carbon contained in different pools—in this study we are focusing on aboveground live tree carbon—can be made from FIA data in a way that is designed to be statistically representative and comparable between time periods (methodology described in the supplementary data). Throughout this analysis, estimates of change will be comparing the totals from the six measurement years 2001–2006 with the equivalent totals from 2011–2016.
Landfire includes data at two time-points—2001 and 2010—and on three characteristics of land cover: (1) type, (2) canopy height, and (3) percent forest canopy cover (Ryan and Opperman 2013). Variables in Landfire are reported in a finite number of categories: 850 vegetation types across the USA (412 of which are tree cover), three to five height categories for each of herb, shrub, and forest and ten categories for vegetation canopy cover. We describe the Landfire data as well as the methods used by Gonzalez et al (2015) to adapt it to carbon accounting in the supplementary data.
2.2. Classifying FIA data into Landfire-equivalent categories
To compare FIA-based and Landfire-based measurement approaches, we took FIA data and categorized it to replicate an analysis using Landfire categories. Since the Landfire analysis (Gonzalez et al 2015) considered only aboveground live carbon, we only used that pool for our FIA analysis. While a perfect match is not possible between the variables in these two different datasets, there are FIA variables that provide a very good approximation of the variables that underlie Landfire classifications. We describe our cross-walk between these variables in the supplementary data.
2.3. Evaluating distribution and concentration of AGC among Landfire-equivalent classes
We evaluated the degree of concentration in the distribution of carbon in categories defined by the three variables used by Landfire: vegetation type, percent cover, and canopy height. We completed this aggregation at the scale of conditions in the FIA database. The cross of vegetation*height*cover resulted in 576 unique categories. For the two largest (by AGC) vegetation types—California mixed conifer and redwoods—we present the AGC total in each height*cover category. For the totals in each category, since measurement data is only available for six out of ten measurement panels. we scaled values by a factor of 10/6 to approximate statewide values and to facilitate comparison with other studies.
2.4. Comparing the estimates net change in live AGC achieved by each methodology
We calculated AGC at the plot level using equations described in FIA documentation (Thompson et al 2015). The estimates we present exclude foliage, thus differing from Christensen et al (2017) who use ratios from Jenkins et al (2003) to estimate foliage carbon. For each of five ten-year panels presented in Christensen et al (2017), our without-foliage values were 4%–5% lower than the with-foliage ones. For statewide change in AGC, we calculated total stock in the initial measurement period and subtract that from the total stock in the re-measurement period, using appropriate expansion factors for each period. Although in figure 3 we present values for change in AGC for individual plots, this is primarily for illustrative purposes; when we present population-level estimates for change in AGC, this is always calculated as a difference between time-periods so that appropriate expansion factors can be used. Once we established estimates for AGC change, we examined how that change was distributed among groups that would have changed Landfire category versus those that would not have changed category, and how an estimate of statewide net change would be affected by that distribution.
2.5. Evaluating potential sources of bias in estimation methodologies
Growth in forests is incremental, while disturbance events cause large and sudden changes. Given this dynamic where increases in carbon can be expected to be small from year to year while losses—when they happen—are large, we can expect that an approach that focuses on category transitions may be more likely to capture carbon emission and less likely to capture carbon sequestration. As category bins become larger and carbon is more concentrated in a smaller number of categories, transitions among categories will become more infrequent and the relative undercounting of growth is likely to become more pronounced. In order to quantify the magnitude of this relative undercounting, we took data from re-measured FIA plots, classified them according to categories that reflect Landfire categories, and compared net change in carbon in the groups of plots that either did or did not change Landfire categories.
We matched plots from the 2001–2006 panels with their re-measured values in 2011–2016. After matching, we assessed change in canopy height and predominant vegetation type. For height, we also assessed whether the change would have caused a category change between Landfire categories. Please see the supplementary data for further details on the assigning of plots to change categories as well as for information on the small portion of plots that were measured in only one period. We were not able to perform a similar change analysis for percent canopy cover because the FIA program only introduced the canopy cover variable in 2011. For vegetation type, the FIA reports it at the level of condition rather than plot; because condition classes are not explicitly mapped between measurement periods, it is impossible to create a precise transition matrix. Instead, we report changes in the largest single vegetation type on each plot.
3. Results
3.1. Concentrated distribution of live tree AGC among categories
Live tree AGC in California is concentrated in a small number of forest types. Three forest types accounted for the majority (52.26%) of live tree AGC in California's forests in the 2011–2016 period: California mixed conifer (MC; 36.60%), redwood (7.95%), and tanoak (7.72%). Within those forest types, live tree AGC is concentrated in a small number of height*cover categories. In MC, 64.9% is in the 25 m–50 m height category, while the majority (57.8%) is in the six largest height*cover categories (figure 1(a)). Concentration is even greater in redwood forests, with the >50 m and 25–50 m height categories capturing 46.2% and 47.7%, respectively, of total live AGC and the majority of total live AGC (60.5%) in only two height*cover categories (figure 1(b)).
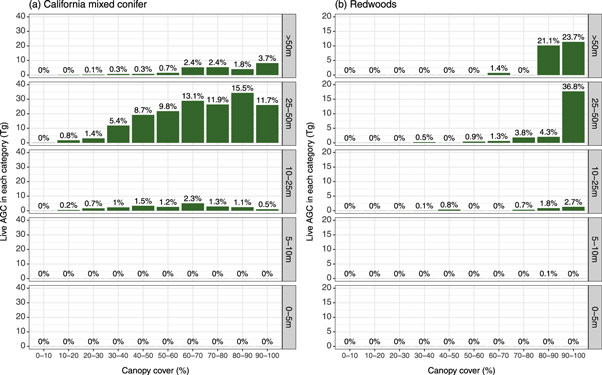
Figure 1. Carbon distribution among height and cover categories in (a) California mixed conifer and (b) redwood forest types (2011–2016). Height categories (labeled on right) represent groupings of plots based on the 95th percentile tree height on the plot. Cover classes are percent canopy cover broken into 10% increments. Height of bars represent teragrams (Tg; millions of tonnes) statewide of aboveground live tree carbon in each category while printed percentages are the percentage of the total carbon in that forest type that is found in a particular category.
Download figure:
Standard image High-resolution imageLooking at all three characteristics reported as part of Landfire data (height, cover, vegetation type), there are 576 categories present in California. Despite the large number of categories, live tree AGC is highly concentrated: the ten largest categories alone have 37.37% of the total, and the top 20 contain the majority (50.37%; table S1 in the supplementary data).
3.2. Net change in California's aboveground live tree carbon, 2001–2006 to 2011–2016
Measurements of 2011–2016 FIA plots lead to a statewide estimate of 1008 Tg of live tree AGC in California's forests after scaling for expansion factors and for number of years sampled. This compares with 2001–2016 measurements estimating 963 Tg. This statewide increase of 45 Tg in live tree AGC over ten years is equivalent to an annualized increase of 0.46%.
3.3. Increasing AGC in plots that did not change Landfire height category
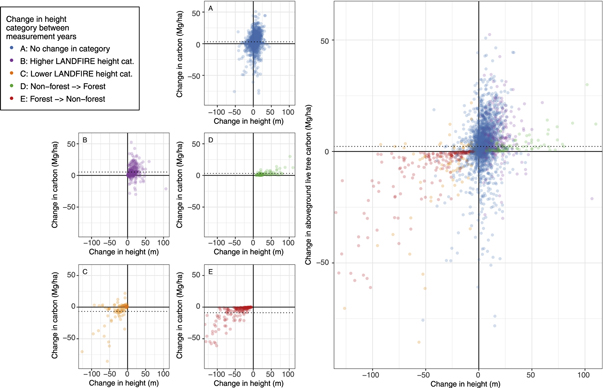
The vast majority of plots did not change categories between measurement periods. Of plots that had some forest cover in both the initial period and in the re-measurement period, 82% of those plots were dominated by the same forest type in both periods. Additionally, 71.2% of plots stayed in the same height category between measurement periods (A), while 8.6% and 4.8% moved up (B) or down (C) in height categories, respectively (figure 3 and table 2). The remainder were 2.4% of the plots that had no forest cover in the first period but had some when they were re-measured (D) and 13.0% of the plots that had some forest cover in the first time period but none when they were re-measured (E).
Table 2. Carbon stocks and net carbon flux in categories of plots determined by their transition status (i.e. whether they changed height categories or not). Although the statewide total of all plots indicates net sequestration of 9.79 Tg, the net change that would have been captured by focusing on height transitions alone would be −67.48 Tg.
| 2001–2006 | 2011–2016 | Change between periods | ||||||
|---|---|---|---|---|---|---|---|---|
| Grouping of plots according to the relationship between their re-measured Landfire height category (2011–2016) and their initial Landfire height category (2001–2006) | Forest area (1000 s km2) | AGC (Tg) | AGC per hectare (Mg ha−1) | Forest area (1000 s km2) | AGC (Tg) | AGC per hectare (Mg ha−1) | Absolute change in AGC (Tg) | Annualized percent change in AGC |
| A: No change in height category | 95.87a | 784.21 | 81.79 | 94.96 | 859.56 | 90.52 | 75.35 | 0.92 |
| A1: Less than 25 m max height | 52.19 | 188.51 | 36.12 | 51.18 | 220.73 | 43.12 | 32.22 | 1.59 |
| A2: > 25 m and < 50 m | 40.97 | 504.52 | 123.15 | 41.03 | 546.36 | 133.15 | 41.84 | 0.80 |
| A3: Greater than 50 m | 2.72 | 91.18 | 335.18 | 2.74 | 92.47 | 337.38 | 1.29 | 0.14 |
| B: Higher Landfire height cat | 13.28 | 78.49 | 59.11 | 13.16 | 97.74 | 74.26 | 19.24 | 2.21 |
| C: Lower Landfire height cat | 3.75 | 20.05 | 53.41 | 3.58 | 12.47 | 34.81 | −7.58 | −4.63 |
| D: Non-forest -> Forest | 0.00 | 0.00 | 0.00 | 2.44 | 2.94 | 12.06 | 2.94 | N/A |
| E: Forest -> Non-forest | 6.88 | 17.47 | 25.40 | 0.00 | 0.00 | 0.00 | −17.47 | N/A |
| Totals for plots that changed height category (B–E) | 24.65 | 116.01 | 47.06 | 21.63 | 113.14 | 52.30 | −2.87 | −0.25 |
| Statewide totals (A–E) | 120.52 | 900.22 | 74.69 | 116.59 | 972.70 | 83.43 | 72.48 | 0.77 |
aNote: each line of this table represents a constant set of plots between the two ranges of measurement years. However, forest area values change slightly between panels for one or both of two reasons: (1) proportion of forests on a plot changed between measurements or (2) because of changes in the overall sample, the statewide adjustment factor of a given plot (EXPVOL or EXPCURR) changed between panels.
Plots that stayed in the same height category (A) represented 77.3% (94 957km2) of statewide forest area and 85.2% (860 Tg) of live tree AGC for the 2011–2016 period. By contrast, the plots that changed height category (groups B and C) or that showed a transition between forest and non-forest (D and E) represented 17.6% of forest area and 11.2% of live tree AGC. Plots that stayed in the same height category sequestered carbon at a rate of 0.92% annually, those that moved to a higher category sequestered at 2.21% annually, and those that moved to a lower category emitted carbon at 4.63% annually. Because the estimates presented here are for live tree AGC, plots that saw a transition from forest to non-forest or vice-versa were registered as either 100% increase or 100% decrease in the AGC pool. A relatively small set of plots were either measured in the first period but not in the second, for reasons not linked to the condition of the plots (plots of the former type represented 8.1% of forest area and 5.8% of live tree AGC in the first time period; supplementary data).
When we take the total sums across groups (A)–(E), we find annual net sequestration in the live tree AGC pool of 0.77%, including forest loss and forest gain. When we take the sum of only those groups that involve a height category change or a change in forest status (B)–(E), the calculation suggests net reductions in live tree AGC of 0.25% annually. The difference between these numbers is the exclusion of group A: plots that stayed in the same height category. As discussed above, group A shows net sequestration and is by far the largest category in the sample; as such, its removal shifts the estimate for net change strongly downward towards net reductions (table 2). We found that plots that saw an increase in live tree AGC between measurement periods represented 62.9% of forest area and 22.1% of California's total area. This compared to 35.1% of forest area (11.7% of the state area) for plots that saw a net decrease in live tree AGC (table S2).
4. Discussion
4.1. Net change in live tree AGC in California's forests
Our estimate of 45 Tg of live tree AGC sequestered by California's forests over ten years is equivalent to 16.5 million metric tons CO2 per year (table 1). This is more than the five million metric tons of CO2 sequestration on forest land per year set as a target by AB-1504. These results update and are consistent with Christensen et al (2017) finding of a 6.5 Tg average annual sequestration of live tree AGC for the 2001–2005 to 2011–2015 interval.
Gonzalez et al (2015) reported total 2001 live tree AGC in California's land under tree cover that is comparable with our estimate. Our estimate of 917 Tg is within the 95% confidence interval of their estimate of 830 Tg ± 190 Tg. However, the Gonzalez et al (2015) estimate for the second time period (2010) and the estimate for net change in forest carbon differ sharply from ours. While we estimate 63 Tg live tree AGC sequestered for the 2001–2011 period and 45 Tg sequestered for the 2001–2006 to 2011–2016 period, Gonzalez et al (2015) estimate net carbon reductions of 48 Tg from live tree AGC on land under tree cover, 2001–2010.
There are important differences between these estimates, notably the range of years and the land types included (table 1). However, it is unlikely that the difference in timing would explain the discrepancy: drought, extreme fire seasons, and beetle outbreaks negatively influenced California forests in the 2010–2016 period and likely increased the rate of loss of AGC, thus making it more likely that the Christensen et al (2017) estimate and our estimate would be more negative than the Gonzalez et al (2015) one. In all three studies, changes in area of tree cover are explicitly accounted for. In fact, the FIA-based estimates are likely biased downwards (towards carbon losses) by the manner they assess changes in forest area. A loss of forest area being reported as a 100% loss in AGC almost certainly overestimates the impact of forest cover loss.
4.2. Sources of difference among estimates and potential for bias
A key difference among these studies is that Gonzalez et al (2015) covered all wildlands whereas Christensen et al (2017) and our study only report results on forest land under tree cover. The focus on tree-dominated ecosystems alone is a limitation of the FIA data, and is one reason why bringing in wall-to-wall data products as Gonzalez et al (2015) have done with Landfire can make an important contribution to ecosystem carbon accounting. To assess whether or not differences in overall estimates can be explained by differences in coverage, we have disaggregated results from Gonzalez et al (2015) to highlight values that are most comparable to FIA (table 1). This disaggregation clearly shows that the differences in area do not resolve the discrepancy among the estimates. Even for tree-dominated forest land, Gonzalez et al (2015) report net losses of carbon while FIA-based analyses estimate net sequestration.
Because differences in areal coverage cannot explain estimate discrepancies, we turned to potential sources of bias in the use of the Landfire data product—a data product that was not explicitly designed for statistically-robust assessment of changes in carbon stock as was the FIA. One likely candidate for discrepancies is suggested by our findings on the distribution of live tree AGC stocks and changes relative to categories of cover, height, and vegetation type. Gonzalez et al (2015), using land cover categorization from Landfire, report 1083 unique combinations of vegetation*height*cover in California. Classifying FIA data using variables and cut-points based on those from Landfire, we found 576 unique categories. However, despite the large number of categories overall, we found the majority of carbon (50.4%) to be in only 20 categories. This high concentration raises the concern that transitions among categories will be relatively rare. This is problematic for an analysis of net flux that only detects change when a transition occurs. In forests, this leads to a lack of precision and potential bias in the estimates, because it may be more likely to detect a transition representing a large negative change. Incremental growth, however, may frequently leave a pixel in the same category, and thus not be detected. Figure 2 shows the great majority of plots remain in the same height category between measurement periods. This means estimates of net change will be biased downwards. Larger categories and less frequent transitions will only amplify the problem.

Figure 2. Height categories based on the 95th percentile tree height in each FIA plot, grouped according to the Landfire-equivalent height category of the plot in the initial (2001–2006) measurement period. Alternating grey and white horizontal bands show the height categories. Light blue (left of each pair) shows the distribution of 95th percentile heights in the initial measurement period (by definition, bounded within each height category) while dark blue (right of each pair) shows the distribution of 95th percentile heights in the re-measurement period.
Download figure:
Standard image High-resolution imageTo test this hypothesis, we analyzed net change in plots compared against whether or not a given plot changed its height category (figure 3). We found that despite an overall increase in live tree AGC across all plots, the net change in plots that changed height category was negative. An accounting that uses all re-measured FIA plots showed 0.77% annualized increase in live tree AGC; however, using only plots that changed category leads to an estimate of a 0.25% annualized decrease. Although this is not a full re-analysis of Landfire, we consider it strongly suggestive that analyses grounded in transitions among Landfire categories would lead to a strong negative bias for estimates of net change in live tree AGC. Looking at paired FIA re-measurements plots, live tree AGC increased on 22.1% of total area and 62.9% of forest area, while it decreased on 12.2% of total area and 35.1% of forest area. This compares with results based on Landfire (Gonzalez et al 2015) that suggested live tree AGC increased on only 14% of the area of California's wildlands and decreased on 20% of that area.
Figure 3. Change in aboveground live tree carbon in FIA plots versus change in 95th percentile tree height in the same plots. Colors show different categories of transition status as described in the legend. The smaller sub-charts on the left each show a single category from the larger overall chart on the right. The dotted line on the full chart shows the average change per hectare in AGC across all FIA plots included in this analysis, while dotted lines on the sub-charts indicate the average change for each height-change category (see table 2 for percent change in each category).
Download figure:
Standard image High-resolution image
Another candidate for the differences is how the carbon flux from wildfires is estimated. The Gonzalez et al (2015) method models carbon flux inside of wildfire perimeters as a total loss of live tree AGC via a permanent conversion from forestland to grassland carbon densities, while the FIA method (Christensen et al 2017) directly measured the stock-difference of live tree AGC on the fire-affected plots. An earlier study of FIA forest plots affected by wildfires noted that high severity wildfires did kill trees representing more than 97% of live tree AGC, but noted that only 21% of FIA plots that were remeasured on federal lands burned at high severity (Eskelson et al 2016). Low and moderate severity fires killed only 4% and 37% of live trees, respectively. The assumption that all wildfire area should be modeled as a high fire severity will substantially increase the carbon loss estimates using the Landfire method.
Gonzalez et al (2015) acknowledge that their results may undercount forest growth, and they propose a correction factor (p.75). However, this value is based on FIA-estimated increase in forest carbon stocks (6% ± 1%) that is already a landscape-wide estimate of net change (i.e. growth plus losses) rather than an estimate of growth rates in those forest stands that are sequestering. The most robust way to generate an estimate for net changes is to go directly to the plot-level data, as we have done is this study.
It is also important to point out that neither the Gonzalez et al (2015) or the Christensen et al (2017) method followed the latest good practice guidance for forests and forest products (IPCC 2014b) that explicitly require the use of available data on harvested wood carbon used for energy and longer-lived products in use and in landfills when that data is available. Because California imports the majority of its wood products that eventually end up in California's landfills, the inclusion of wood product tracking could add considerable complexity. However, not including products results in a state level accounting system that implicitly penalizes sustainable forestry operations that produce large volumes of harvested wood products per unit of forest area.
4.3. Improving landscape-scale carbon flux estimates for California and other jurisdictions
No system of measurement is perfect. Gonzalez et al (2015) correctly state that a statewide assessment of ecosystem carbon flux needs to include all ecosystems rather than focusing solely on forests (p. 69). We agree, and we recognize that FIA data is limited in that it only assesses AGC in tree-dominated areas. However, given that lands under tree cover account for more than 90% of California's aboveground ecosystem carbon (Gonzalez et al 2015), ensuring unbiased estimates of change on those lands is paramount. With respect to the two approaches evaluated in this study—both of which use the stock-difference approach to estimate carbon dynamics—our analysis finds that the inventory-based FIA approach is less likely to introduce bias into an estimate of changes in live tree AGC in California. The problems of estimating change from RS data are well-known in the tropical forest literature (Brown, 2002, Mitchard et al 2014). An approach examining transitions among land cover categories can be effectively used to identify sites and volume of losses—as has been done recently with Landfire specifically (Zheng et al 2011, Powell et al 2014)—but is less appropriate as an estimator of net change in forest carbon. For estimating net change on forested land, an inventory-based approach such as the FIA, when the data is available, is likely to be more reliable than an approach relying on category changes such as one based on Landfire.
An approach to statewide carbon accounting that combines the RS- and inventory-based methods will likely provide a more accurate estimate of change in live aboveground carbon than either method in isolation. In California, this could mean relying on FIA data for the tree-dominated landscapes that constitute roughly 28% of area and 90% of its ecosystem carbon but turning to Landfire or an equivalent product to estimate change in the remaining area. Alternatively—or complementarily—process-based models that relate RS variables such as leaf-area index have shown success in modeling soil properties and growth rates to levels of accuracy within the range of plot-based measurement error (Coops et al 2012). Although a process-based modeling approach would have higher data requirements than Landfire or FIA which are both publicly available, it does offer the opportunity for a more unbiased approach to modeling forest growth while still allowing wall-to-wall coverage as policy makers may require.
Combining (1) the present study's FIA-based estimates of net change in live tree AGC for forest land (45 Tg for 2001–2006 to 2011–2016), (2) Christensen et al (2017) estimates of change in non-tree live AGC on forest land (3.0 Tg for 2001–2005 to 2011–2015), and (3) Landfire-based estimates for live AGC in non-forest wildlands (−21 Tg per Gonzalez et al 2015 for 2001–2010) gives an estimate of net sequestration of live AGC in California's forests and wildlands of 27 Tg over ten years (if one assumes the same time periods). Although this is more modest AGC sequestration than that seen in live trees in forests alone, it is nonetheless equivalent to 9.9 million metric tons of CO2 annually-beyond the target in AB-1504. Measurements of other carbon pools on forest land in the state (Christensen et al 2017) show net sequestration in the remaining forest land carbon pools—the belowground and the dead aboveground—in addition to the sequestration discussed above in the live AGC pool.
The most recent Climate Change Scoping Plan (California Air Resources Board 2017) depended on research (Gonzalez et al 2015) that concluded that California forests are no longer a carbon sink. The more recent California Forest Carbon Plan (Forest Climate Action Team 2018) depended on research (Christensen et al 2017) that concluded that California forests are a strong carbon sink. Neither of these two methods used to inform state regulations in California includes the forest carbon stored in harvested wood products in use or in solid waste disposal sites that is included in national estimates (US EPA 2018). The large differences in methods used to generate estimates of live tree AGC and the inclusion of estimates of all IPCC required forest carbon pools (aboveground biomass, belowground biomass, dead wood, litter, soil organic carbon, harvested wood products in use, harvested wood products in solid waste disposal sites, harvested wood used for energy) will need to be resolved if California's methodology is to be internationally relevant.
Estimates for net carbon flux from forests have important implications for policy. At jurisdictional scale, estimates of forest carbon flux may play a role in prioritization among climate mitigation policies and programs across different sectors by providing a measure of the importance of the forest sector relative to others with respect to emissions-reductions efforts. At a landscape scale, flux estimates can aid in targeting forest management programs to those areas with the most potential for emissions reductions or sequestration enhancements. At all scales, 'measurement matters' (Law et al 2015), and the choice of measurement tools has far-reaching potential to influence policy outcomes.
Acknowledgments
Stella Cousins provided valuable advice on working with FIA data and improved this article with thoughtful feedback during its early development. This article benefited greatly from discussion with Samuel Evans and from the feedback of the editorial board and four anonymous reviewers. We gratefully acknowledge funding from the California Natural Resources Agency under agreement #0CA14031.