

Abstract
Efficient use of freshwater resources is necessary to balance food production and long-term sustainability of irrigated agricultural systems. Here we developed a framework to benchmark irrigation water use relative to crop yield for individual fields based on site-specific weather and soil. Subsequently, we used the framework to diagnose on-farm irrigation management, in relation to crop production, in maize and soybean producer fields in Nebraska (USA). We found actual irrigation to be similar to estimated irrigation water requirement in about half of the fields (i.e. small water surplus). Remarkably, these fields attained yields similar to fields where actual irrigation exceeded water requirements (i.e. large water surplus). Underlying causes for water surplus included producer risk aversion in soils with low water storage capacity, use of coarse methods for scheduling irrigation, and tillage. Scenario assessment indicated that total irrigation volume could potentially be reduced up to 25%–40%, without hurting crop yields, by reducing current irrigation surplus in years with above- or near-average seasonal precipitation. About a third of the producer fields already achieved high yields with little water surplus, supporting the contention that achieving high productivity with less irrigation by better matching irrigation amounts in relation with crop water requirements are compatible goals. The proposed framework can be applied to other crops and regions provided there are well-validated models, local soil and weather datasets, and reliable field-level irrigation, yield, and management records.
Export citation and abstract BibTeX RIS

Original content from this work may be used under the terms of the Creative Commons Attribution 3.0 licence. Any further distribution of this work must maintain attribution to the author(s) and the title of the work, journal citation and DOI.
1. Introduction
Benchmarking is defined as the act of measuring performance relative to an expected or target response. It is an established method to evaluate output–input response and track progress in many disciplines (Malano et al 2004). It also provides a gauge of current behavior and the means to track long-term changes in behavior, as well as effectiveness of new technology or management practices. Within the realm of agricultural production, benchmarking and the use of efficiency frontiers are commonly used to diagnose and monitor management of agricultural inputs (e.g. van Ittersum and Rabbinge 1997, Silva et al 2017). For example, Hochman et al (2014) presented a framework to benchmark the efficiency of cropping systems in northern Australia in which relative output (yield) was analyzed in relation to the relative input (nitrogen fertilizer) to create an input-yield production frontier and identify management factors to increase input-use efficiency.
Irrigated agriculture accounts for 40% of global food crop production, occupying only 20% of global cropland (Food and Agriculture Organization of the United Nations FAO 2016). Freshwater resources will likely become more limiting for irrigated agriculture due to climate change, declining groundwater levels, and increasing competition with residential and industrial sectors (Kumar 2012, Scanlon et al 2012). Despite increasing concerns about the long-term sustainability of irrigated agriculture, there are very few studies assessing irrigation water use in agricultural producers' fields (e.g. Tennakoon and Milroy 2003, Salvador et al 2011, Grassini et al 2011b, Borgia et al 2013, Tan 2019). These previous studies focused on small geographic regions and did not have an explicit focus on assessing irrigation management in relation to crop production at field and regional levels. To our knowledge, no generic framework exists to determine the degree to which actual field irrigation compares with crop irrigation water requirements as determined by crop type, climate, and soil. Such a framework could potentially help benchmark on-farm irrigation water use and identify opportunities to produce similar or more grain yield using less or similar amount of irrigation water.
In this study, we developed a framework to benchmark irrigation water use for crop production. Subsequently, we applied the framework to diagnose and identify opportunities for improvement in irrigated producers' fields in Nebraska—a region that accounts for ca. 3 million ha of irrigated maize and soybean production (supplementary section S1 is available online at stacks.iop.org/ERL/14/054009/mmedia). We used a spatial framework that accounts for variation in climate and soils to upscale potential irrigation water savings from field to regional level. While we acknowledge that a complete assessment of long-term sustainability of irrigated crop systems would require accounting for other biophysical (e.g. recharge rates, water quality) and socio-economic factors, our study provides a first step in this direction by benchmarking field-level irrigation water use in relation to crop productivity.
2. Methods
A robust framework to benchmark irrigation water use in relation with crop yields in agricultural producer fields should account for factors influencing crop yield potential and irrigation water requirements. Yield potential is defined as the yield attained by a crop cultivar when grown with non-limiting water and nutrients and kept free of weeds, pathogens, and insect pests (Evans 1993, van Ittersum and Rabbinge 1997, van Ittersum et al 2013). Irrigation water requirement is defined as the seasonal amount of irrigation water that is required to achieve yield potential, after accounting for crop water requirements, water inputs from in-season rainfall and stored soil water at sowing, and unavoidable water losses through soil evaporation, surface runoff, and drainage below the root zone.
In our framework, yield potential and irrigation water requirements are estimated using process-based crop simulation models (supplementary information, section S2). Briefly, crop models simulate daily crop growth and water balance. Irrigation is triggered anytime soil water is not sufficient to satisfy crop water requirements. Data inputs for simulating yield potential and irrigation water requirements include weather (solar radiation, temperature, precipitation, humidity, and wind speed), soil and field properties (rootable soil depth, soil texture, drainage class, field slope), and management practices (sowing date, cultivar maturity, and plant density). Models also require specification of initial conditions, for example, available soil water content at sowing time or at the time the model is initialized. While we are aware of previous studies using crop models to estimate irrigation water requirements, we note that these previous studies mostly focused on predicting yield response to irrigation (e.g. Bryant et al 1992, Heng et al 2009, Hussein et al 2011) or developing irrigation decision support tools (e.g. Stockle and James 1989, Bergez et al 2001, Han 2016). In contrast, our approach consists of a combination of crop simulation models, producer-reported data, and a spatial framework with the explicit goal of benchmarking both actual irrigation and crop yields in producer fields.
Once yield potential and irrigation water requirements are estimated for an individual field, relative yield (RY) is estimated as the ratio between producer-reported yield and simulated yield potential (supplementary information, section S2). RY is useful to compare fields across regions and years with different yield potential. A RY close to 1.0 indicates that producer yield is similar to the yield potential for that specific site-year. In irrigated crop systems where agricultural producers have access to markets, inputs, and extension services4 , as is the case of US maize, reaching 80% of yield potential is a reasonable goal (Grassini et al 2011a, 2011b, 2014). Lower RY would indicate sub-optimal management practices leading to a relatively large yield gap (van Ittersum et al 2013). Likewise, irrigation water surplus (WS) is estimated as the difference between producer irrigation and simulated irrigation water requirement. A WS close to zero indicates that producer irrigation is similar to the simulated irrigation water requirement. A negative WS indicates producer irrigation below irrigation requirement and a WS above 50 mm, for example, represents producer irrigation exceeding the irrigation water requirement for that site-year case by roughly two events in a pivot-irrigated field (ca. 25 mm per irrigation event). For the purpose of diagnosing yields and irrigation surplus, and identifying opportunities for improvement, fields are grouped into four categories as shown in figure 1. The four categories are based on magnitude of RY and WS: high RY, negligible WS (category A), small RY, negligible WS (category B), high RY, large WS (category C), and small RY, large WS (category D). The framework is useful for screening managements and technologies that could save water without hurting crop yields. If complemented with socio-economic data, the proposed framework can also be useful to explore trade-offs between field-level irrigation water savings and increasing farm costs, labor, and/or risk.
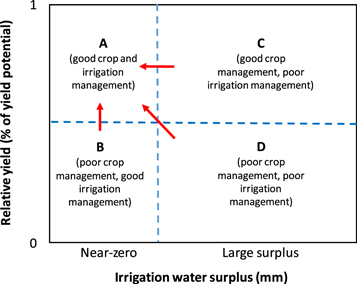
Figure 1. Conceptual diagram showing relative yield (RY; ratio of producer yield to simulated yield potential) versus irrigation water surplus (WS; difference between producer irrigation and simulated irrigation water requirements). Four categories are shown: (A) high RY, small WS, (B) small RY and WS, (C) high RY and WS, and (D) low RY, large WS. Dashed lines delineate categories; arrows show possible trajectories to increase yield, reduce irrigation, or both.
Download figure:
Standard image High-resolution imageThis conceptual framework was applied to an original database that consisted of 534 pivot-irrigated maize and soybean fields in Nebraska (central US Great Plains) (supplementary information, section S1, figure S2). Nebraska ranks 3rd and 5th nationally in the US amongst maize and soybean producing states, respectively, and has experienced tremendous growth in total irrigated cropland over the last 50 years, from 0.8 million ha in 1964 to 3.4 million ha in 2017 (USDA-National Agricultural Statistics Service NASS (2018); supplementary information, section S1, figure S1). The following information was available for each field: average yield, applied irrigation water and fertilizer inputs, and management practices such as planting date, cultivar maturity, seeding rate, tillage, and irrigation scheduling method. These data were collected through personal interviews over three years (2010–2012) with contrasting weather conditions, including a drought year (2012). Seasonal irrigation amount was measured using flowmeters installed at each irrigation well. Details are available in supplementary information (section S1, figures S3–S4). Reported yield and irrigation amounts were found to be representative of Nebraska's producers' fields as determined by comparing database values against county and state average values reported by independent data sources such as USDA-NASS and USDA-ERS (see Grassini et al 2015 for details).
For our case study in Nebraska, three crop models were used to estimate yield potential and irrigation water requirements: Hybrid-Maize, SoySim, and SoyWater (Setiyono et al 2010, Specht et al 2010, Yang et al 2004, 2017) (supplementary information, sections S2). Previous studies have used these models to estimate yield potential and water requirements in the central US Great Plains region (Setiyono et al 2010, Torrion et al 2011, Grassini et al 2009, 2011a, 2011b, 2015, Gibson et al 2017, Rattalino Edreira et al 2017, Yang et al 2004, 2017). Both Hybrid-Maize and SoySim models simulate crop yield potential, assuming no limitations by nutrient and water supply and no incidence of weeds, insect pests, and pathogens. Hybrid-Maize and SoyWater simulate soil water balance on a daily time step based on crop water uptake (as determined by weather, canopy cover, root depth, and soil water content), water inputs from precipitation and irrigation, and non-productive water losses through soil evaporation, canopy interception, deep drainage, and surface runoff. Irrigation is triggered when crop water uptake does not meet potential (i.e. non-water limited) crop evapotranspiration (Hybrid-Maize) or when soil water content falls below a pre-determined threshold (SoyWater). We cross-validated WS estimated using process-based crop models with estimates of WS derived from two independent empirical methods (supplementary information, section S2, figure S7).
Each producer field was classified into the four categories shown in figure 1 and underlying causes for large WS were investigated (supplementary information, section S3 and S4). We used a RY of 0.80 as a threshold to categorize fields into high versus low RY based on average RY reported by the Global Yield Gap Atlas for US irrigated maize (www.yieldgap.org). For the categorization of fields into small versus large WS, we used a value of WS of 50 mm. This value roughly corresponded to two irrigation events and aims to account for unavoidable inefficiencies in irrigation scheduling (e.g. an irrigation event followed by precipitation) and uncertainties in estimation of irrigation water requirements. About 7% of fields exhibited producer irrigation smaller than irrigation water requirements by a large margin (>150 mm), typically reporting substantially lower yields. In most cases, these fields went through extreme circumstances such as crop failure due to flooding early in the season or malfunctioning of the irrigation system. Likewise, the case that despite irrigation amounts were the largest during the extreme 2012 drought year5 , irrigation systems were not able to meet the high crop water requirements in many fields, especially those located in sandy soils (supplementary information, figures S3–S4, S6). Therefore, these fields (7% of total database) were excluded from the analysis as they cannot be considered representative of the majority of irrigated fields in Nebraska. Finally, we used a biophysical spatial framework (Rattalino Edreira et al 2018) to upscale potential irrigation water savings to a regional level (see supplementary information, section S5 for details on calculation on potential irrigation water savings and upscaling method).
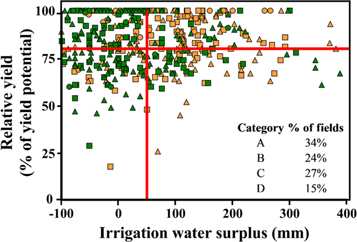
Figure 2. Relative yield (RY) versus irrigation water surplus (WS) in producer irrigated maize (red) and soybean (green) fields for three years: 2010 (squares), 2011 (triangles), and 2012 (circles). Each data point represents a field-year case. Red lines represent thresholds for RY and WS categories (see figure 1). Inset shows proportion of fields in each category.
Download figure:
Standard image High-resolution image3. Results
Approximately a third of the total fields (34%) reached RY > 0.80 with WS < 50 mm (category A), indicating that achieving yields near yield potential and irrigating without exceeding irrigation requirements are not conflicting goals in irrigated maize and soybean fields (figure 2). Average WS was larger in maize versus soybean fields (t-test, p < 0.01), with the majority of maize fields (63%) exhibiting large WS (categories C and D). In contrast, only 26% of the soybean fields had a large WS. Variation in precipitation and ETo across years and regions influenced magnitude of WS (supplementary information, figure S5). About 69% and 30% of maize and soybean fields, respectively, exhibited large WS in 2010 and 2011 (figure 2). Despite larger irrigation amounts in the drought year (2012), they were barely sufficient to meet the high irrigation water requirements and a small proportion of fields (18%) exhibited WS (supplementary information, section S2). Estimates of WS using other independent empirical methods exhibited similar variation across field-years compared with our estimates based on process-based crop models (supplementary information, section S2).
Irrigation scheduling method significantly impacted magnitude of WS in both maize and soybean fields (figure 3). Average WS in fields in irrigation scheduling category 1, where irrigation was scheduled based on best available cost-effective technologies, was not statistically different from zero (t-test; p = 0.21), indicating that synchronization of irrigation inputs and crop water requirements is possible when irrigation decisions are guided by tools based on real-time weather and soil water content. In contrast, WS was statistically larger than zero in fields in irrigation scheduling category 3, where irrigation was scheduled based on more rudimentary methods such as crop visual inspection and fixed calendar dates. Difference in WS between irrigation scheduling categories 1 and 3 is equivalent to four irrigation events of approximately 25 mm each. Irrigation surplus was 35% smaller in fields where irrigation was scheduled based on 'soil feeling' (irrigation scheduling category 2) compared to fields in irrigation scheduling category 3 but still larger than WS in irrigation scheduling category 1 fields. A striking finding was that yield did not differ between fields using different types of irrigation scheduling methods, with actual yield averaging 86% of yield potential across irrigation scheduling methods (figure 3). The fact that only 22% of total fields fall within irrigation scheduling category 1 highlights the large room that is available for saving irrigation water, without detriment to current crop yields. Magnitude of WS was also influenced by soil type, with increasing WS as soil available water holding capacity (AWHC) decreased, suggesting a risk-aversion attitude in sandy soils (supplementary information S4, table S2). Likewise, WS was smaller in no-till and reduced-till fields compared with disked fields. Crop residues left in the field may reduce irrigation requirements by increasing precipitation storage efficiency during the non-growing season and by reducing direct soil evaporation and runoff as found by Nielsen et al (2005) and Klocke et al (2009). Yield differences among AWHC classes and tillage methods were small and statistically weak (t-test, p > 0.10).

Figure 3. (A), (B) Influence of irrigation scheduling method on irrigation water surplus and relative yield (ratio between producer yield and yield potential). Irrigation scheduling ranged from advanced (category 1) to coarse methods (category 3). (C), (D) Irrigation water surplus across fields with varying soil available water holding capacity and tillage methods. Upper and lower boundaries of boxes indicate 75th and 25th percentile, respectively. Horizontal line within boxes is the median; crosses indicate mean values. Bars indicate the 90th and 10th percentiles of the distribution. Letters indicate statistically significant differences (Tukey's test, p < 0.05).
Download figure:
Standard image High-resolution image
A spatial framework that delineates regions with similar climate and soil was used to upscale potential irrigation water savings from field to regional level (supplementary information, section S5). If irrigation in maize and soybean fields exhibiting large WS (i.e. categories C and D) would have been managed such that actual irrigation led to a small WS (50 mm), 40% and 25% of the irrigation volume applied in 2010 and 2011 could potentially have been saved. These irrigation water savings are equivalent to 407 and 268 million cubic meters in 2010 and 2011, respectively, for the area contained within the four climate-soil domains where surveyed fields were located. In contrast, in the drought year (2012), only 7% of irrigation water would have been saved (equivalent to 192 million cubic meters across the four regions). Hence, potential irrigation water savings are greater in years with above- or near-average precipitation. Fields in southeast Nebraska accounted for the largest percentage of potential irrigation water savings (ca. 55%) in years with above-or near-average precipitation because, although this region does not exhibit the largest field-scale WS amongst the four regions, it accounts for the largest portion of irrigated cropland. In contrast, while WS was the largest in northeast Nebraska due to coarse-texture soils, this region includes a relatively smaller fraction of cropland area and would account only for ca. 20% of estimated regional irrigation water savings. To summarize, there is substantial room for saving irrigation water in years with precipitation near or above average without negative impact on crop yields.
4. Discussion and conclusion
This study shows application of a novel framework to diagnose on-farm irrigation water use, identify opportunities for improvement, and assess potential irrigation water savings. In the case of Nebraska, reducing current WS represents 'low-hanging fruit' to increase farm net profit using current knowledge and cost-effective technologies to track soil water status and flexible irrigation equipment that allows delivering water right on time and in the right amount. The framework can be used by producers not only to benchmark irrigation and yield in their own fields, but also to compare them against other producer fields located within the same climate-soil domain. Along these lines, our study shows that ca. one third of producers reached high yields with small WS, indicating that meeting productivity and input-use efficiency goals are not conflicting goals with proper management and access to cost-effective technologies. Arguments are occasionally made that excess irrigation is, in fact, beneficial for other ecosystem services (e.g. aquifer and/or stream recharge). However, we note that irrigation excess has adverse impacts on water quality, contributes to greenhouse gas emissions due to higher energy use, and represents additional financial costs to agricultural producers6 (e.g. Klocke et al 1999, Spalding et al 2001, Exner et al 2014). While we acknowledge that benchmarking on-farm irrigation water use as performed in this study is imperative, we recognize that it is not sufficient by itself to assess long-term sustainability of irrigated crop systems. Such an assessment would require a broader, multi-scale approach that accounts for other biophysical and socio-economic factors. We believe that our study makes a key contribution towards this direction by providing a robust assessment of irrigation water use at field and regional levels in relation to crop productivity.
Our approach provides estimates of potential irrigation water savings at different spatial scales (field, climate-soil domain, region), which, in turn, can help prioritize research and extension programs and inform policy. For example, in our study case, coarse soils in northeast Nebraska have the greatest potential to reduce irrigation water use at field level; however, despite its smaller WS, southeast Nebraska accounts for a larger portion of the statewide irrigation water surplus due to its larger cropland. Hence, to be effective at reducing the volume of irrigation water used state-wide, resources should focus on climate-soil domains that account for the largest share of water surplus and use financial incentives to encourage water-saving practices (e.g. cost sharing for investment in improved irrigation scheduling technologies) and provide field evidence to producers about the economic benefits and minimum risk associated with these practices (e.g. Koundouri et al 2006, Irmak et al 2012, Levidow et al 2014, Torrion et al 2014, Rudnick et al 2015). Targeting 'hotspots' for irrigation water surplus located in specific areas, even if they account for a small share of regional cropland, would still be relevant to reduce potential for contaminant leaching at local level (e.g. coarse-texture soils). While the potential irrigation water savings estimated here may not be entirely realized because not all of the sources of irrigation surplus can be fully eliminated (e.g. a precipitation event hours after irrigation) and/or there may be barriers to adopt new technologies and knowledge (e.g. producer behavior and risk perception, increasing costs), the framework presented in this study allows estimation of the overall room for saving irrigation without penalties in crop yields. Along these lines, we note that producers in Nebraska are on track in relation with adoption of cost-effective water technologies. For example, approximately 23% of irrigated farms in Nebraska used soil moisture sensors in 2013 compared to only 14% in 2008 (USDA-National Agricultural Statistics Service NASS 2014).
Finally, the proposed framework can be used at local and regional levels by resources managers, policy makers, and governmental agencies to monitor impact derived from investments on research and extension programs targeted to reduce irrigation water use. We argue that the irrigation water surplus and RY are robust metrics to evaluate changes over time as they account for changes in irrigation and yield due to weather variations across years. Previous work has shown that factors explaining field-to-field variation in irrigation and yield tend to persist across years, which should facilitate identification of fields with low RY, or large WS, or both (Farmaha et al 2016, Gibson et al 2018). Indeed, our study shows that ca. 15% of fields exhibited large yield gaps and water surplus; these fields should be prioritized for reducing the current water surplus given their lower efficiency in producing grain per unit of water. Although Nebraska was used as a case study for proof of concept, the framework is conceptually robust, generic, and can be applied in other irrigated cropping systems of the world provided field-level data on yield, irrigation, and management (and associated soil and climate) are available together with a robust model to estimate yield potential and irrigation water requirements. We expect that availability of this information will increase due to increased pressure to develop agricultural datasets worldwide to address growing environmental concerns over water quality and quantity.
Acknowledgments
Funding and support for this project comes from the Robert B. Daugherty Water for Food Global Institute at the University of Nebraska, Nebraska Corn Board, and Nebraska Soybean Board. We thank Drs. Haishun Yang, Dean Eisenhauer, and Juan Ignacio Rattalino Edreira (UNL), Dr. John Gates (CropMetrics), and Dr. Paolo Nasta (University of Napoli Federico II) for useful comments on an earlier draft of the manuscripts and help with the upscaling method. We are also grateful to the Nebraska Natural Resources Districts (NRDs) and the many producers in Nebraska who provided data for this study.
Footnotes
- 4
Refers to access to agricultural inputs (fertilizer, pesticides, high-quality seeds, etc), markets to sell grain, and extension services that provide up-to-date knowledge of crop and irrigation management and technologies.
- 5
Year 2012 was the driest year in Nebraska since climate data started to be recorded in 1895.
- 6
Agricultural producers do not pay for water in Nebraska, however they pay for the energy used to pump (most commonly electricity and diesel). Pumping costs can be high in areas with deep groundwater.