

Abstract
Biodiversity conservation is often considered to be an important co-benefit of REDD+ and other mechanisms aiming to increase carbon in biomass and soil to mitigate climate change. This reasoning is based on the assumption that the level of biodiversity and ecosystem carbon are positively correlated. Firstly, however, studies have shown both positive and negative relationships. Secondly, incentives for additional ecosystem carbon do not trigger random or all potential changes in land-use, but often concentrate on one or a few specific changes that could have an opposite effect than the general trend indicates. Therefore, it is important to study biodiversity impacts of plausible measures to increase carbon. We obtained land-use scenarios on pathways to increase carbon based on 97 face-to-face interviews of local land-use experts in twelve landscapes in seven countries and five continents. We then conducted another set of face-to-face interviews with biodiversity experts yielding 2963 estimations concerning the value of land-use classes for 264 taxa of fauna and flora in these landscapes. We found positive carbon to biodiversity relationships in ten of the twelve landscapes. The biodiversity impacts of measures to increase carbon were positive in eleven of the twelve landscapes. Our results indicate that a random land-use change that increases biodiversity is also likely to increase carbon and vice versa.
Export citation and abstract BibTeX RIS

Original content from this work may be used under the terms of the Creative Commons Attribution 3.0 licence. Any further distribution of this work must maintain attribution to the author(s) and the title of the work, journal citation and DOI.
Introduction
Biodiversity and the global carbon cycle are linked in many important ways. Negative effects on biodiversity are often listed as one of the few main impacts of climate change [1]. A different link arises from the fact that carbon in biomass and soil of ecosystems is away from the atmosphere in the form of CO2. Therefore, managing landscapes for biodiversity is expected to have an impact on ecosystem carbon and vice versa. Because of the importance of this link and potential practical implications, an important body of literature has developed in recent years. A perfect positive relationship would indicate to land managers that conserving most carbon-dense areas would be a win-win solution that is best also for biodiversity conservation. Contrastingly, a negative relationship would indicate that a trade-off exists, and that the importance of biodiversity and carbon should be compared to find an optimal solution [2].
The perhaps expected positive relationship between biodiversity and carbon was found in studies ranging from global on plants [3], pantropical on vertebrates [4], sub-continental on trees [5], national on vertebrates [6] to local on mammals [7]. However, high carbon and biodiversity were not associated in Indonesia due to plant and vertebrate species-poor but carbon-rich peatlands [8] or in the Brazilian savannah, where a large share of plant and ant species adapted to open environments could not cope with increasing biomasses because of decreasing fires [9]. In Brazilian rain forests the association was clear in human disturbed plots but not in old-growth forests that varied in carbon density [10]. Many studies report weak, non-existing or conflicting trends within the study areas [11–15].
However, the situation is typically more complex. Land management for increasing carbon is not random. Instead, efforts to add carbon relative to a business-as-usual scenario may concentrate on one or a few mechanisms. For example, payments to increase carbon may trigger the establishment of exotic monoculture tree plantations on native savannah [16]. This could decrease biodiversity despite the general positive relationship between carbon and biodiversity in the entire landscape. Therefore, to understand the impacts on biodiversity of any attempts to increase carbon, the actual mechanisms on how the increase is likely to happen should be linked to biodiversity approximations.
Numerous theories can be used to understand the biodiversity-carbon relationship, nearly all of which predict a positive relationship. A large number of theories link productivity and species number and can be used to understand well known global patters of decreasing species number from the equator [17]. However, in smaller scales, this relationship is debatable. Ecosystem functioning could be enhanced by increasing the number of plant species, as this increases the likelihood that most adapted species are present or that species present have positive interactions [18]. However, empirical support for net primary productivity being associated with high plant diversity is weak with grasses and at small spatial scales [19]. Furthermore, even if productivity and biodiversity were linked, productivity and biomass clearly are not at least in global scale [20]. More potential is offered by examining mechanisms that link biomass, instead of productivity, to biodiversity. When an area is void of large plants and animals due to an extreme climate [21] or young age, e.g. after a volcanic eruption [22] or severe anthropogenic disturbance [23], both biodiversity and biomass are very low, suggesting a positive relationship in these conditions. In more average circumstances, large plants typically lead to both high biomass and more structural complexity, including microhabitats in tree trunks [24] and within the three-dimensional canopy, and therefore potentially to more diversity [25]. When focusing on landscapes, including anthropogenic land uses such as croplands, increasing human influence often means simple production systems such as monocultures and exotic species. Both of these have been traditionally believed to lower the range of niches to which local organisms are adapted, thereby reducing biodiversity [26]. Because these human-influenced land uses often have low biomasses to keep autotrophic respiration low, therefore allowing more growth [27], a positive biodiversity-carbon relationship could also be expected in landscapes with varying human impact. Mechanisms linking soil organic carbon (SOC) and biodiversity are less obvious. Although, when carbon in deep organic layers is included, these will often drive ecosystem carbon variation in landscapes containing peat soils. Peatlands typically form the minority of the land area at spatial scales common in biodiversity analyses, e.g. the national scale, and provide habitat for fewer species than more common soil classes [8]. However, these species are typically more rare than those in more common habitats [28]—a feature peatlands hold in common with oceanic islands [13]. When maximizing global biodiversity, conserving more rare and biodiversity-poorer areas becomes advisable, while the opposite is true if the objective is to maximize the biodiversity of the conserved area.
Because of conflicting earlier results and lack of studies at the global scale, our objective was to determine whether biodiversity-carbon relationships were positive in twelve human-influenced landscapes around the world. Furthermore, we examined the biodiversity impacts of plausible actions to increase ecosystem carbon in these landscapes, and this evaluation is, to our knowledge, the first of its kind.
Material and methods
We based the research on nine landscapes for which potential to increase ecosystem carbon was already studied [29] and on one new landscape in northern Laos and two new landscapes in northern Vietnam. We describe the new landscapes and give additional methodological information separately (supplementary 1 is available online at stacks.iop.org/ERL/14/054001/mmedia). In summary, we estimated ecosystem carbon for approximate business-as-usual scenarios and scenarios envisioned by interviewed land-use experts (supplementary 2) with a simple carbon bookkeeping tool called CarboScen [30]. We obtained the required equilibrium carbon densities mainly from local studies (supplementary 3). The interviewed experts were all from the same country as the landscape, and most lived in or very close to the landscape. During these face-to-face interviews, we asked how land-use would change from the business-as-usual scenario with annual payments of US$1 and US$10 for every additional Mg of stocked carbon, assuming an infinite period of payments, the handling of payments by a central government, and good governance and efficient distribution of funding.
We collected, for this paper, another interview-based dataset on biodiversity in all of the 12 landscapes. We searched for experts on biodiversity or certain taxonomic groups mainly from universities and other research organizations. At the beginning of each interview, we asked the experts to focus on any monophylogenetic group of any taxonomic rank that they know well and that is important for biodiversity conservation in their countries. We then described the landscape and the 4–10 land-use classes connected to it, and asked the experts to numerically rate the suitability of these for the conservation of the focal taxon. We explained that this 'value for biodiversity' of zero should be given to land-use classes unsuitable for the taxon in question and a value of ten should be given for the best habitat in the country in question. In total, we conducted 115 biodiversity interviews, and the majority of them (67) focused on only one of the landscapes, while the remaining experts focused on two landscapes within one country. Each interview focused on an average of 2.71 taxa. Of the 440 set of estimations made by an expert on a particular taxon and landscape, 148 were for mammals, 64 for birds, 18 for reptiles, 13 for amphibians, 36 for insects, three for other invertebrates, 148 for vascular plants, six for other plants and four for fungi.
Results
The three new landscapes for which we conducted the interviews on their potential to increase ecosystem carbon, had similar or somewhat higher starting carbon densities than older landscapes not dominated by peatlands (table 1). The two Indonesian landscapes are outliers with significantly more carbon to begin with, a drastic drop in carbon in the business-as-usual scenario and the most potential for increasing carbon relatively to business-as-usual (table 1). In the three new landscapes, LaosNorth had a relatively neutral business-as-usual carbon trend, but the two Vietnamese landscapes showed rapid increases in carbon (table 1). The potential to increase carbon from the business-as-usual development with payments was low in the Vietnamese landscapes but was significantly higher in LaosNorth (table 1). This is understandable, as the Vietnamese landscapes are at later stages of forest transition [31] and have more stable land uses. Contrastingly, LaosNorth is in a more chaotic situation, with several possible alternative land-use scenarios and plenty of extensively used 'vacant' land.
Table 1. Ecosystem carbon and value for biodiversity for the twelve studied landscapes. We computed all the changes for a two-hundred-year period by discounting carbon and biodiversity values by 3%, using constant exponential rate discounting analogous to conventional economic discounting [32]. The implication is that changes in carbon or biodiversity that occur sooner have a greater influence on the values reported in the tables. This approach was an alternative to the normal method of valuing equally all years for a fixed period of e.g. fifty years (i.e. interest rate of 0%), and not considering changes after that (abrupt change to an infinite interest rate). To simplify the interviews, we used the carbon-rental approach [33] in which the compensation for lost opportunities is paid annually instead of the more common one-time payments. The payment of US$10 for every additional Mg of ecosystem carbon with our approach corresponds to the commonly used one-time payment of US$50 per Mg of CO2 or equivalent assuming an interest rate of 5.5% [29]. Starting ecosystem carbon densities and changes (left) can be compared between landscapes. However, starting values for biodiversity and their changes should not be compared between countries and are only indicative between landscapes within a country. The interest is whether the change triggered by carbon payments is positive or negative. We computed the confidence intervals with bootstrapping [34]. Results on carbon density for nine landscapes were published earlier [29].
| Ecosystem carbon density (Mg ha–1) | Value for biodiversity (scale 0–10) | |||||||||||||||
|---|---|---|---|---|---|---|---|---|---|---|---|---|---|---|---|---|
| Value at start of the simulation (2015 or 2018) | Change in business-as-usual scenario | Additional relative to business-as-usual scenario with payment of US$1 | Additional relative to business-as-usual scenario with payment of US$10 | Value at start of the simulation (2015 or 2018) | Change in business-as-usual scenario | Change relative to business-as-usual scenario with payment of US$1 | Change relative to business-as-usual scenario with payment of US$10 | |||||||||
| Mean | Confidence interval (95%) based on variation in land-use change estimations | Mean | Confidence interval (95%) based on variation in land-use change estimations | Mean based on results of six to eight land-use change estimations | Confidence interval (95%) based on variation in six to eight land-use change estimations | Mean based on a land-use change matrix averaging individual changes estimated in the six to eight land-use change estimations | Confidence interval (95%) based on variation in biodiversity estimations | Mean based on results of six to eight land-use change estimations | Confidence interval (95%) based on variation in six to eight land-use change estimations | Mean based on a land-use change matrix averaging individual changes estimated in the six to eight land-use change estimations | Confidence interval (95%) based on variation in biodiversity estimations | |||||
| FinlandNorth | 129.5 | 8.3 | 4.3 | 2.1–6.7 | 14.5 | 10.3–19.4 | 3.72 | 0.00 | 0.03 | 0.02–0.05 | 0.04 | 0.01–0.06 | 0.12 | 0.08–0.15 | 0.19 | 0.05–0.32 |
| FinlandSouth | 108.5 | 2.5 | 3.5 | 2.1–5.3 | 8.9 | 6.9–11.1 | 3.97 | 0.00 | 0.05 | 0.03–0.07 | 0.05 | 0.02–0.08 | 0.12 | 0.09–0.15 | 0.13 | 0.06–0.20 |
| IndonesiaEast | 4607.6 | −393.5 | 105.6 | 43.6–169.7 | 150.3 | 60.9–240.8 | 3.32 | −0.16 | 0.12 | 0.05–0.18 | 0.15 | 0.07–0.22 | 0.38 | 0.12–0.62 | 0.50 | 0.36–0.64 |
| IndonesiaWest | 1933.7 | −324.0 | 36.6 | 7.6–72.2 | 110.0 | 67.7–154.5 | 2.80 | −0.42 | 0.13 | 0.01–0.25 | 0.17 | 0.12–0.21 | 0.47 | 0.29–0.65 | 0.56 | 0.43–0.66 |
| LaosNorth | 157.0 | −0.8 | 4.2 | 0.0–10.4 | 19.7 | 10.6–28.4 | 6.88 | −0.34 | 0.06 | −0.01–0.14 | 0.07 | 0.02–0.13 | 0.31 | 0.14–0.48 | 0.38 | 0.16–0.60 |
| MexicoEast | 150.8 | 0.0 | 2.0 | 0.4–4.5 | 7.3 | 2.8–12.2 | 4.22 | 0.00 | 0.07 | 0.00–0.15 | 0.08 | 0.06–0.11 | 0.22 | 0.08–0.35 | 0.26 | 0.15–0.37 |
| MexicoWest | 94.5 | −0.1 | 0.2 | 0.0–0.5 | 2.7 | 1.2–4.4 | 4.26 | −0.02 | 0.04 | −0.03–0.12 | 0.05 | 0.05–0.06 | 0.19 | 0.07–0.31 | 0.21 | 0.17–0.25 |
| PeruNorth | 160.2 | −4.7 | 3.3 | 1.6–5.2 | 8.7 | 6.5–11.1 | 4.69 | −0.09 | 0.07 | 0.03–0.11 | 0.09 | 0.07–0.11 | 0.19 | 0.13–0.25 | 0.23 | 0.19–0.28 |
| PeruSouth | 165.7 | −3.4 | 4.1 | 2.3–6.2 | 10.4 | 8.5–12.2 | 5.43 | −0.10 | 0.25 | 0.13–0.37 | 0.27 | 0.22–0.31 | 0.65 | 0.54–0.76 | 0.66 | 0.52–0.79 |
| TanzaniaEast | 79.6 | −1.4 | 1.1 | 0.4–1.9 | 2.8 | 1.7–3.8 | 1.10 | −0.03 | −0.02 | −0.04–0.00 | −0.02 | −0.03–(−0.01) | −0.05 | −0.07–(−0.03) | −0.05 | −0.08–(−0.03) |
| VietnamNorth | 126.1 | 9.4 | 0.4 | 0.0–0.7 | 6.0 | 1.8–10.5 | 2.82 | 0.08 | 0.04 | 0.00–0.07 | 0.04 | 0.03–0.05 | 0.23 | 0.10–0.37 | 0.32 | 0.26–0.38 |
| VietnamSouth | 156.0 | 10.7 | 0.2 | 0.0–0.6 | 2.8 | 1.4–4.1 | 4.99 | 0.00 | 0.01 | 0.00–0.03 | 0.01 | 0.01–0.02 | 0.24 | 0.12–0.35 | 0.25 | 0.21–0.30 |
The actual mechanisms in land-use causing these increases in carbon are diverse. Typically, an expert estimated several changes to be triggered by the envisioned carbon payments (supplementary 2). Certain patterns become evident when focusing only on the most significant change by a given expert for the US$10 scenario (as arrows in figure 3). In FinlandNorth, FinlandSouth, LaosNorth, MexicoEast and VietnamSouth the experts expect the funding to trigger management that increases carbon in areas that are already forests. Similar mechanisms also dominate in MexicoWest and VietnamNorth, but the primary methods include some forestation of open land-use types such as cropland and pasture. Due to large areas of ditched peat soils, the mechanisms of increasing carbon relative to the business-as-usual in the Indonesian landscapes focus on reducing decomposition and peat burning, by foresting open degraded areas and even through some hydrological restoration. The main mechanism in PeruNorth and TanzaniaEast was increasing trees in agricultural land uses, but included some conversion of agricultural land into relatively natural forests in PeruNorth and the conversion of semi-natural 'coral rag scrub' into tree plantations in TanzaniaEast.
As expected, the relationship between relative ecosystem carbon density and the biodiversity value of the land-use classes was generally positive, but large variation was observed (figure 1 and supplementary 4). Despite this variation, rising trends were statistically highly significant for birds, invertebrates, mammals, reptiles or amphibians and plants or fungi (supplementary 4). The relationship was somewhat stronger when only biomass carbon density is plotted against the biodiversity value (figure 1 and supplementary 4). This was also as expected, as SOC (down to a depth of 0.3 m in mineral soils and down to the mineral soil level in organic soils), included in ecosystem carbon in addition to biomass carbon, is not theoretically strongly linked to biodiversity. Omitting SOC is often justifiable, as changes in soil are slow and poorly understood. However, previously waterlogged organic soil is prone to decomposing [35] or even burning [36], and therefore its inclusion is appropriate in our setup.
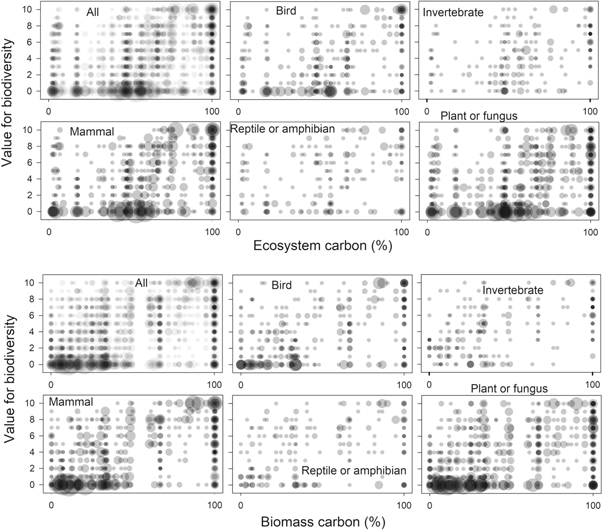
Figure 1. Carbon and value for biodiversity merged from land-use classes in the twelve landscapes. Ecosystem carbon density, including both carbon in soil and biomass (top six panels) and biomass carbon density (bottom six), is shown relative to maximal carbon in the landscape in question. The number of same expert estimates in a given landscape is proportional to the area of the data points. Darker shades indicate overlapping data points (transparency 90% for 'All' and 70% for the other five panels).
Download figure:
Standard image High-resolution imageWhen biodiversity value is plotted against ecosystem carbon separately for the twelve landscapes, most show statistically significant trends (figure 2 and supplementary 4). However, IndonesiaWest had an opposing trend when soil carbon was included and both IndonesiaWest and TanzaniaEast showed only weak trends without soil carbon (supplementary 4). Both Indonesian landscapes had clearly rising trends within peatlands (ecosystem carbon density over 1000 Mg ha−1 in figure 2), but ecosystems in mineral soils with a minuscule carbon density relative to peatlands had higher values for biodiversity. In TanzaniaEast, all other land uses except 'coral rag forest' had low values for biodiversity. We obtained only little biodiversity data for LaosNorth.
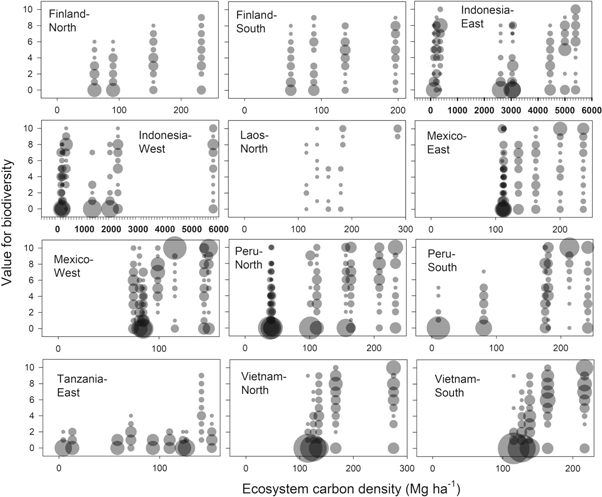
Figure 2. Ecosystem carbon and value for biodiversity of land-use classes separately for the twelve landscapes. The number of same expert estimates in a given landscape is proportional to the area of the data points. Darker shades indicate overlapping data points (transparency 50%). The number of land-use classes in each landscape corresponds to the number of vertical groups of data points.
Download figure:
Standard image High-resolution imageAll of the most significant mechanisms suggested by individual land-use experts to be triggered by US$10 payments for each additional Mg of carbon, are speeding up a carbon-wise positive land-use change, e.g. increasing forestation [37] rather than decreasing deforestation [38]. Nearly all of these primary mechanisms also lead to an increasing average value for biodiversity in the landscapes. The only exceptions are two decreasing arrows in MexicoWest, potentially due to a methodological issue related to the land-use classification used, and three decreasing arrows in TanzaniaEast, where the three experts predict the native 'coral rag scrub' to be converted to tree plantations of mainly exotic species with negative biodiversity impacts (figure 3.), rightly exposing a potential risk for biodiversity conservation. On average, US$10 payment scenarios are beneficial for biodiversity in all landscapes except TanzaniaEast (table 1 and figure 4). With the lower US$1 payment, several confidence intervals on biodiversity impacts pass the zero-level (table 1), as many land-use experts were not certain that payments will trigger a change.
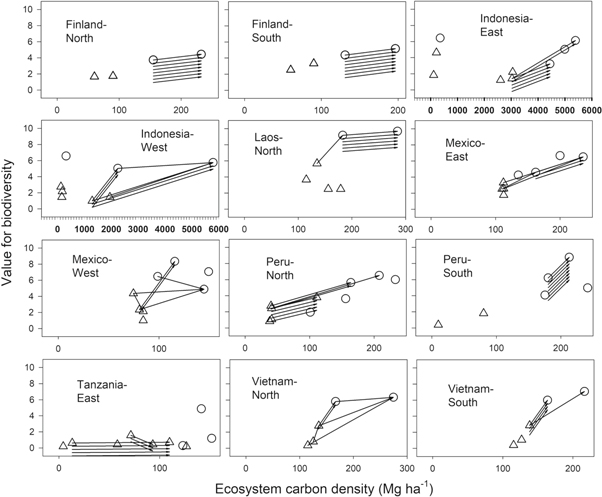
Figure 3. Mean ecosystem carbon and value for biodiversity of land-use classes separately for the twelve landscapes. Triangles represent human-influenced land uses and circles represent natural land uses based on an assessment by ML after the site visits. Natural was defined here as probably having less than 50% of gross primary productivity from planted or sown plants and above-ground biomass probably being at least 25% of the natural old-growth biomass. Arrows indicate the changes suggested by land-use experts with a US$10 annual payment for each extra Mg of carbon that will cause the most difference relative to business-as-usual scenarios. We shifted additional arrows in the same location 0.2 units downwards for visibility.
Download figure:
Standard image High-resolution image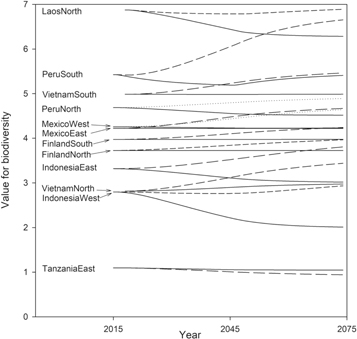
Figure 4. Values for biodiversity in the twelve landscapes. The continuous lines represent average values for biodiversity in the business-as-usual scenarios and the dashed lines in scenarios based on payments of US$10 per additional Mg of carbon. Note that the scale for value for biodiversity is not globally uniform and the focus should be on the slopes of the curves and not in comparing the levels.
Download figure:
Standard image High-resolution image
Discussion
We showed that ecosystem carbon and value for biodiversity of land-use classes in the twelve landscapes have a positive relationship, as expected based on the majority of earlier studies and theoretical thinking. This indicates that a random action to increase biodiversity is likely to increase carbon and vice versa. Despite the symmetry, more research focus has apparently been directed on the biodiversity impacts of carbon action and on harnessing carbon funding to conserve biodiversity [39], rather than the opposite. This could be caused by the overrepresentation of biodiversity relative to carbon in scientific literature comparative to the mass media [40] and policy action.
Because of large scatter, any action to increase carbon or biodiversity could have an unexpected effect based on the general trend. We showed that plausible ways to increase carbon are beneficial for biodiversity conservation in nearly all of the studied landscapes. However, we did not study the carbon impacts of actions to increase biodiversity, but it is not difficult to think of exceptions to the general trend. For example, using fire for biodiversity management clearly reduces carbon and therefore intensifies climate change.
Increasing biodiversity or carbon relative to a business-as-usual scenario can be done in two totally different ways. A positive action, such as reforestation, can either be boosted or a negative action, such as deforestation, slowed down or even stopped. These options differ fundamentally. First, there is a much more significant time lag when a positive action is boosted. After a restoration, it may take centuries before populations of dead wood-dependent organisms recover or before biomass or soil carbon densities approach close to old-growth forest densities. Similarly, the socio-economic cost of increasing carbon is delayed and the discounted 'net present value' could make it more attractive for policy makers, who can e.g. inflate their achievements by talking about large areas while only investing small sums during their short terms in office. The second reason why boosting a positive action differs fundamentally is that by intervening more rather than less in the landscapes encourages transformation to a less natural system if the objective is to increase carbon. For example, a deforested area that is reforested to increase carbon is probably managed more intensively than the original forest and therefore worse for biodiversity. This is because simple systems are typically preferred for food and fibre production, and both land-use change events offer an opportunity to cost-efficiently simplify the system. Interestingly, all the suggested main mechanisms to increase carbon were concerned with boosting a positive action (arrows in figure 3), probably because the land-use experts saw slowing negative processes as challenging, mostly due to the experiences that they had gained in their landscapes. The discussions associated with our quantitative biodiversity interviews indicated that slowing a carbon-wise negative land-use change appears to almost guarantee biodiversity benefits, while speeding up a positive land-use change may not, as it may move the land-use away from natural ecosystems.
Our results were based on two sets of interviews and numerous assumptions. We assumed local land-use experts to be able to realistically estimate the land-use impacts of funding for additional carbon. These estimations may have been subjected to exaggeration of the power of money to attract funding to the area, but this bias is likely to be insignificant. Another overestimation could originate from an insufficient consideration of price increases for food and other land-derived products due to payments for additional carbon globally. This overestimation could be roughly similar in all the landscapes, and therefore it would not influence their relative position in potential to increased carbon. Numerous issues may also influence our biodiversity dataset. Thanks to the discussions associated with the structured quantitative interviews, we could understand the thinking of the biodiversity experts and assess the magnitude of potential biases. The data indicate that NGO representatives exaggerated the difference between good and bad habitats, perhaps due to their background involving work convincing people to conserve good habitats. However, it seems very unlikely that biases in experts' thinking would have significantly influenced the observed trends. Our methodology of allowing the experts choose the taxon they focused on created an uncontrollable situation, and the resulting mix may be far from the concept of 'biodiversity' to many. On the other hand, charismatic megafauna, and keystone and endemic species are overrepresented in our dataset, just as in biodiversity conservation discourse in general [41]. Our dataset therefore most likely corresponds better to how 'biodiversity' is generally understood than a systematic approach to selecting taxa would have resulted in. Finally, our straightforward way of averaging values for biodiversity for the different land uses and multiplying with area is clearly a severe simplification that does not take into account nonlinearities in species-area relationships and connectivity [42] and unexpected surprises common in population ecology [43]. Therefore, our results should be interpreted only to indicate the direction and rough magnitude of biodiversity change.
Spatial biodiversity conservation planning has received plenty of attention, has advanced impressively theoretically [44] and can be considered a sub-discipline of its own. On the other hand, research on spatial planning of ecosystem carbon has been largely neglected. In this study, we have demonstrated a novel approach to investigate carbon and biodiversity jointly. Studying them together is perhaps natural, as they can be considered the main externalities benefiting mainly people in other countries, and is therefore often poorly taken into account in national policies of low and middle income countries. Our experts on the impacts of carbon payments on land-use included nationally important externalities when considering opportunity costs. Therefore, this study serves as an important step towards global land-use optimization from one of the several possible perspectives and could be for example expanded to include other land-use impacts on climate such as albedo [45]. Unfortunately, the lack of common biodiversity units among the seven studied countries make direct global comparisons impossible. That said, global patterns [46] indicate that biodiversity co-benefits of adding carbon to Finnish landscapes are minuscule compared to those in tropical landscapes. A more comprehensive and methodologically challenging study would simultaneously value both carbon and biodiversity based on a globally uniform unit, e.g. based on species number or reducing extinctions.
Acknowledgments
We thank the International Climate Initiative (IKI) of the German Federal Ministry for the Environment, the Norwegian Agency for Development Cooperation (Norad) and Institute of Ecology, Peking University for funding, Orlando Torres Sánchez for pivotal support in Mexico, Anne M Larson, Atte Moilanen, Thu Thuy Pham and Tim Trench for discussions and assistance, Arttu Malkamäki for comments on the manuscript, Stella Thompson for linguistic editing, and the onymous and anonymous interviewed biodiversity experts and land-use experts, of whom only Dang Viet Quang did not wish to remain anonymous. MK raised the funding, ML developed the research idea, ML, SH, TRBD and AG performed the interviews, ML analysed the data and wrote the first draft of the manuscript, ML, TRBD and NDT edited the draft to produce the final version.
Supplementary data: Supplementary 1 Detailed methods (77 KB, PDF)
Supplementary data: Supplementary 2 Carbon Interview Scenarios (106 KB, Excel)
Supplementary data: Supplementary 3 Carbon Density (20 KB, Excel)
Supplementary data: Supplementary 4 Regressions (28 KB, Excel)
Supplementary data: Supplementary 5 Carbon Interviewees (20 KB, Excel)
Supplementary data: Supplementary 6 Biodiversity (79 KB, Excel)